

The DOI matches its Crossref record; 37 of the 38 references it cites were found in a registry or an index.
Accelerating dynamics of collective attention
Open accessAbstract
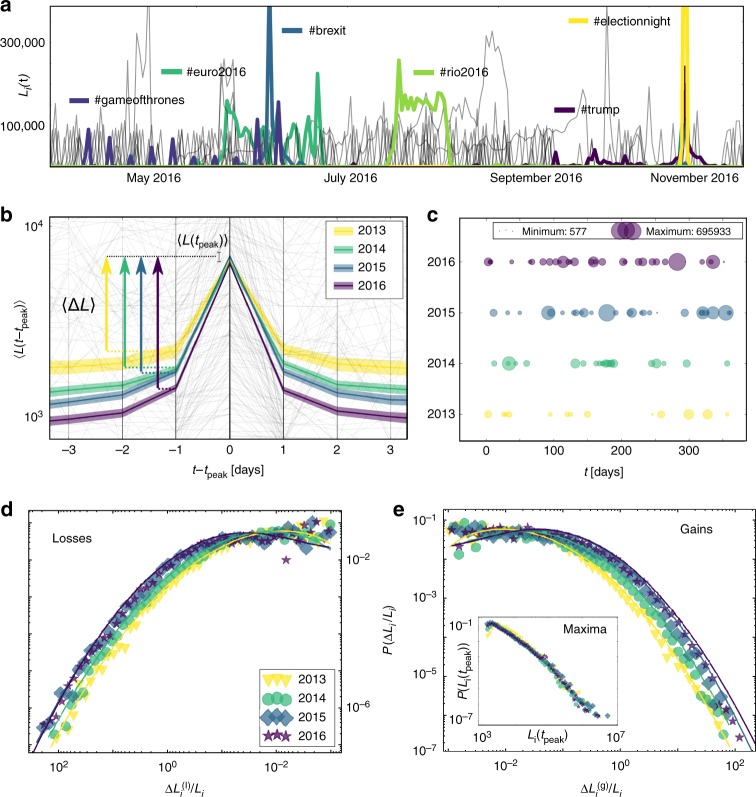
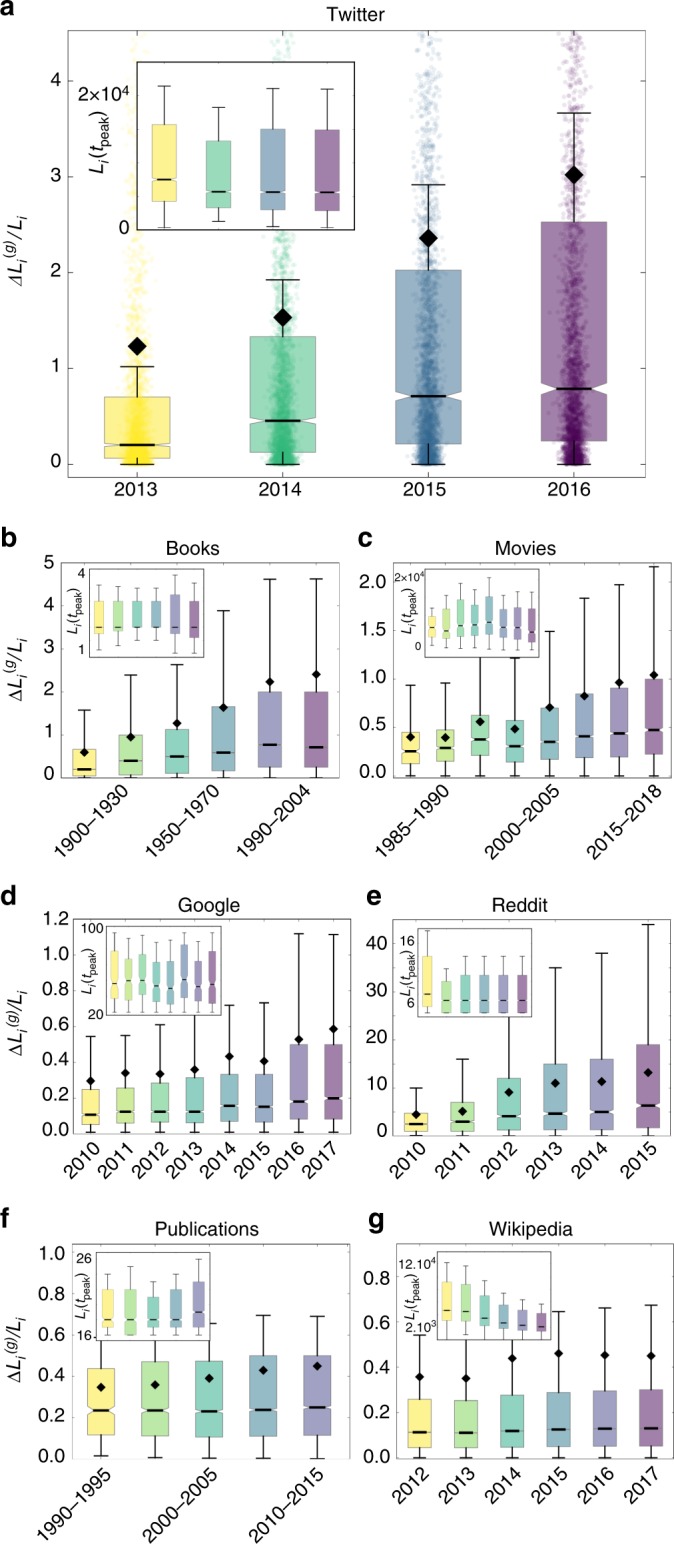
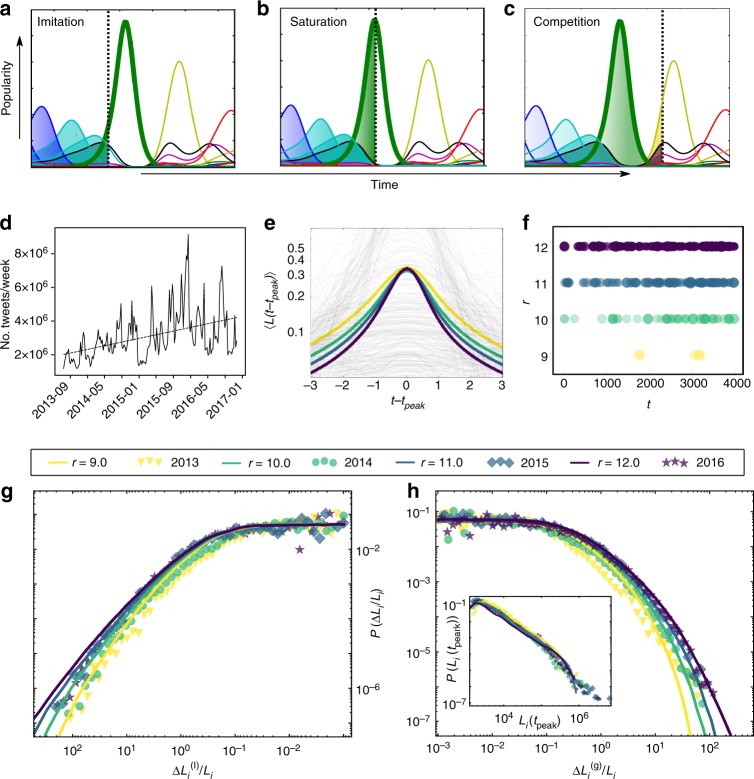
With news pushed to smart phones in real time and social media reactions spreading across the globe in seconds, the public discussion can appear accelerated and temporally fragmented. In longitudinal datasets across various domains, covering multiple decades, we find increasing gradients and shortened periods in the trajectories of how cultural items receive collective attention. Is this the inevitable conclusion of the way information is disseminated and consumed? Our findings support this hypothesis. Using a simple mathematical model of topics competing for finite collective attention, we are able to explain the empirical data remarkably well. Our modeling suggests that the accelerating ups and downs of popular content are driven by increasing production and consumption of content, resulting in a more rapid exhaustion of limited attention resources. In the interplay with competition for novelty, this causes growing turnover rates and individual topics receiving shorter intervals of collective attention.
Overview
The claims and statistics of this paper haven’t been checked yet.
Run the check — free, no account needed. It reads the open-access text and checks the sources it cites.
Integrity signals
Registry
Cites
Statistics
Figures
Verification
Claims the paper makes
The claims and statistics of this paper haven’t been checked yet.
Run the check — free, no account needed. It reads the open-access text and checks the sources it cites.
Claims other papers make about this one
Each is checked against this paper’s own text: does it say what the citing paper says it does?
In the citing paper
“The datasets used in this work have been collected, analyzed and validated in previous works [2-4].”
From Modeling echo chambers and polarization dynamics in social networks (2020) · cites this paper as [3]
Self-check
Percentages, sums and reported differences re-computed from the paper’s own numbers.
The self-check needs the paper’s full text.
Citations
Cites
Rogers, E. M., Singhal, A., & Quinlan, M. M. (2019) · Routledge eBooks · doi:10.4324/9780203710753-35 · Cited by 37,670
The spread of true and false news online
Vosoughi, S., Roy, D., & Aral, S. (2018) · Science · doi:10.1126/science.aap9559 · Cited by 8,847
Power-Law Distributions in Empirical Data
Clauset, A., Shalizi, C. R., & Newman, M. E. J. (2009) · SIAM Review · doi:10.1137/070710111 · Cited by 8,019
Self-organized criticality: An explanation of the 1/ f noise
Bak, P., Tang, C., & Wiesenfeld, K. A. (1987) · Physical Review Letters · doi:10.1103/physrevlett.59.381 · Cited by 7,644
The Kolmogorov-Smirnov Test for Goodness of Fit
Massey, F. J. (1951) · Journal of the American Statistical Association · doi:10.1080/01621459.1951.10500769 · Cited by 7,210
Stanton, B. F., & Rogers, E. M. (1963) · Journal of Farm Economics · doi:10.2307/1235767 · Cited by 6,726
Cramming More Components Onto Integrated Circuits
Moore, G. E. (1998) · Proceedings of the IEEE · doi:10.1109/jproc.1998.658762 · Cited by 5,954
Lazer, D. M. J., Baum, M. A., Benkler, Y., Berinsky, A. J., Greenhill, K. M., Menczer, F., Metzger, M. J., Nyhan, B., Pennycook, G., Rothschild, D., et al. (2018) · Science · doi:10.1126/science.aao2998 · Cited by 4,160
The Kolmogorov-Smirnov Test for Goodness of Fit
Massey, F. J. (1951) · Journal of the American Statistical Association · doi:10.2307/2280095 · Cited by 3,690
Quantitative Analysis of Culture Using Millions of Digitized Books
Michel, J.-B., Shen, Y. K., Aiden, A. P., Veres, A., Gray, M. K., The Google Books Team, Pickett, J. P., Hoiberg, D., Clancy, D., Norvig, P., et al. (2010) · Science · doi:10.1126/science.1199644 · Cited by 3,235
Research works printed but not linked: 4
- Salganik, M. J. Bit by Bit: Social Research in the Digital Age (Princeton, NJ: Princeton University Press, 2017).
- Simon, H. A. Designing organizations for an information-rich world. In M. Greenberge (Ed.), Computers communications, and the public interest (pp. 37-52) (Baltimore, MD: John Hopkins Press, 1971).
- Requested at: https://journals.aps.org/datasets. Accessed July 5, 2018.
- Rogers, E. M. Communication Technology, vol. 1 (New York: Simon and Schuster, 1986).
Cited by
Sorted by citations
Pennycook, G., & Rand, D. G. (2021) · Trends in Cognitive Sciences · doi:10.1016/j.tics.2021.02.007 · Cited by 1,360
“An important limitation of such approaches is that they are 'opt in' – that is, people have to actively choose to engage with the inoculation technique (often for a fairly substantial amount of time – at least in terms of the internet attention span [102]).”
Baumgartner, J., Zannettou, S., Keegan, B., Squire, M., & Blackburn, J. (2020) · Proceedings of the International AAAI Conference on Web and Social Media · doi:10.1609/icwsm.v14i1.7347 · Cited by 881
Art and the science of generative AI
Epstein, Z., Hertzmann, A., the Investigators of Human Creativity, Akten, M., Farid, H., Fjeld, J., Frank, M. R., Groh, M., Herman, L., Leach, N., et al. (2023) · Science · doi:10.1126/science.adh4451 · Cited by 788
Citizens Versus the Internet: Confronting Digital Challenges With Cognitive Tools
Kozyreva, A., Lewandowsky, S., & Hertwig, R. (2020) · Psychological Science in the Public Interest · doi:10.1177/1529100620946707 · Cited by 479
Modeling echo chambers and polarization dynamics in social networks
Baumann, F., Lorenz-Spreen, P., Sokolov, I. M., & Starnini, M. (2020) · Physical Review Letters · doi:10.1103/physrevlett.124.048301 · Cited by 427
Self-citation
Metadata
- Authors
- Lorenz-Spreen, P., Mønsted, B. M., Hövel, P., & Lehmann, S.
- Affiliations
- Max Planck Institute for Human Development (DE)
- Technical University of Denmark (DK)
- University College Cork (IE)
- University of Copenhagen (DK)
- Corresponding author
- Hövel, Philipp
- Lehmann, Sune
- Venue
- Nature Communications
- Published
- 2019-04-15
- Volume
- 10
- Issue
- 1
- Pages
- 1759-1759
- ISSN
- 2041-1723 (ISSN-L)
- PMC
- PMC6465266
- OpenAlex
- W2939088842
- Cited by
- 304
- References
- 38
- Citations by year
- 2026: 46 · 2025: 51 · 2024: 40 · 2023: 43 · 2022: 45 · 2021: 41 · 2020: 32 · 2019: 6
- FWCI
- 14.47
- Type
- journal article
- Language
- en
- Open access
- gold
- doi.org
- Locations
- Nature Communications (publishedVersion, cc-by)
- Europe PMC (PubMed Central) (publishedVersion, cc-by)
- PubMed Central (publishedVersion, cc-by)
- PubMed (publishedVersion)
- Research at the University of Copenhagen (University of Copenhagen) (publishedVersion, cc-by)
- Arrow@dit (Dublin Institute of Technology) (acceptedVersion)
- RePEc: Research Papers in Economics (submittedVersion)
- Cork Open Research Archive (University College Cork, Ireland) (submittedVersion, cc-by)
- DOAJ (DOAJ: Directory of Open Access Journals) (submittedVersion)
- DOAJ (DOAJ: Directory of Open Access Journals) (submittedVersion, cc-by-sa)
- Technical University of Denmark, DTU Orbit (Technical University of Denmark, DTU) (submittedVersion, other-oa)
- MPG.PuRe (Max Planck Society) (submittedVersion, other-oa)
- Funders
- Deutsche Forschungsgemeinschaft
- Topics
- Physical Sciences › Physics and Astronomy › Statistical and Nonlinear Physics › Complex Network Analysis Techniques
- Social Sciences › Economics, Econometrics and Finance › Economics and Econometrics › Complex Systems and Time Series Analysis
- Social Sciences › Communication › Digital Media and Philosophy
- Keywords
- collective attention, attention dynamics, cultural artifacts, popularity, social media
- MeSH terms
- Attention, Humans, Models, Theoretical, Information Dissemination, Social Media
About these checks
Registry, retraction, Cites and statistics results are computed, not judged, with one exception: a printed reference that no index lists is read once by a model before it counts as a citation error. Claims are extracted by a model and kept only when their quote appears verbatim in the text; each cited source is then checked, with a model’s help, for whether it says what the claim relies on. Those verdicts can be wrong — read the claim’s quote and the cited source before relying on one.
Statistics and arithmetic are recomputed, not judged.
Confidence bands are shown only for fields calibrated on our annotated test set. None is calibrated yet, so no band is shown.
What counts as a claim ›How we measure confidence ›How we check this ›
Are you an author, or do you see a problem with this page? Request a review
