

The DOI matches its Crossref record; 59 of the 60 references it cites were found in a registry or an index.
Multifunctional CRISPR-Cas9 with engineered immunosilenced human T cell epitopes
Open accessPublished version of a preprint
Abstract
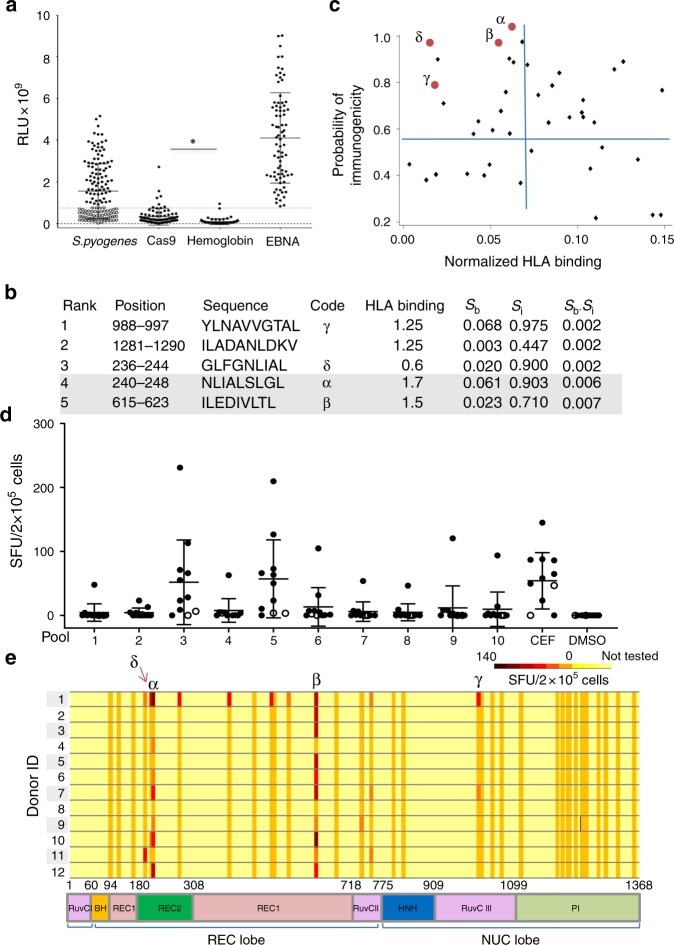
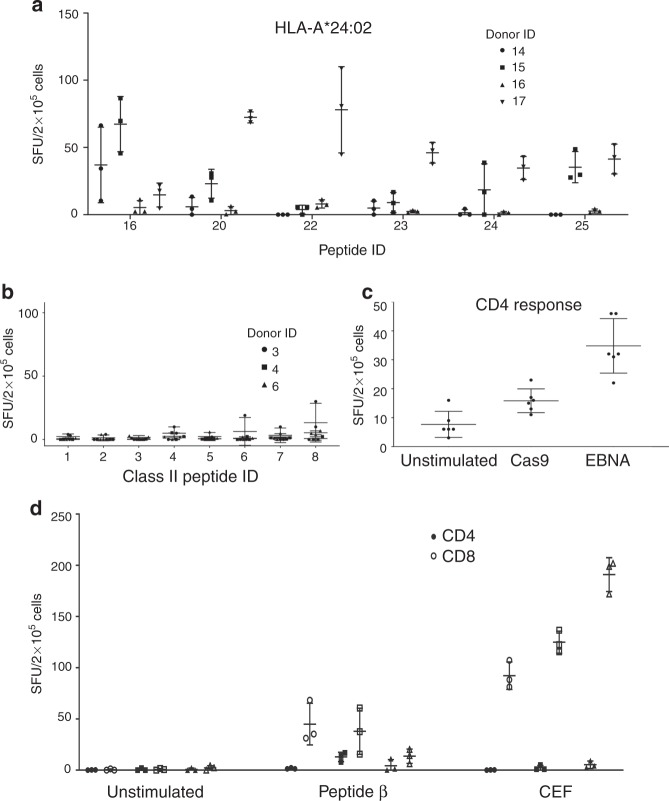
The CRISPR-Cas9 system has raised hopes for developing personalized gene therapies for complex diseases. Its application for genetic and epigenetic therapies in humans raises concerns over immunogenicity of the bacterially derived Cas9 protein. Here we detect antibodies to Streptococcus pyogenes Cas9 (SpCas9) in at least 5% of 143 healthy individuals. We also report pre-existing human CD8+T cell immunity in the majority of healthy individuals screened. We identify two immunodominant SpCas9 T cell epitopes for HLA-A*02:01 using an enhanced prediction algorithm that incorporates T cell receptor contact residue hydrophobicity and HLA binding and evaluated them by T cell assays using healthy donor PBMCs. In a proof-of-principle study, we demonstrate that Cas9 protein can be modified to eliminate immunodominant epitopes through targeted mutation while preserving its function and specificity. Our study highlights the problem of pre-existing immunity against CRISPR-associated nucleases and offers a potential solution to mitigate the T cell immune response.
Overview
The claims and statistics of this paper haven’t been checked yet.
Run the check — free, no account needed. It reads the open-access text and checks the sources it cites.
Integrity signals
Registry
Cites
Statistics
Figures
Verification
Claims the paper makes
The claims and statistics of this paper haven’t been checked yet.
Run the check — free, no account needed. It reads the open-access text and checks the sources it cites.
Claims other papers make about this one
Each is checked against this paper’s own text: does it say what the citing paper says it does?
In the citing paper
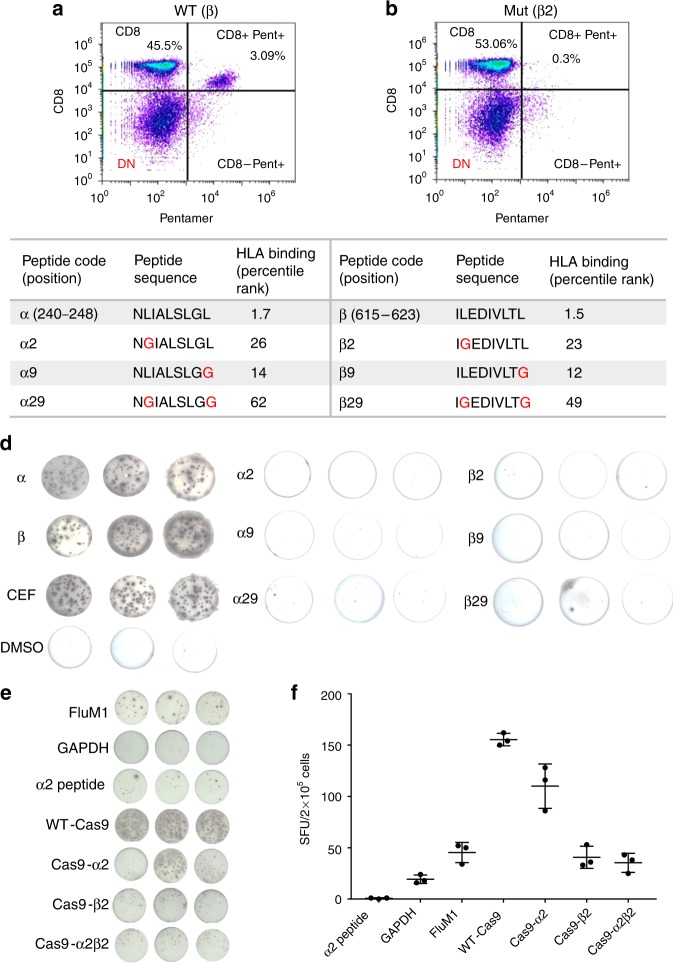
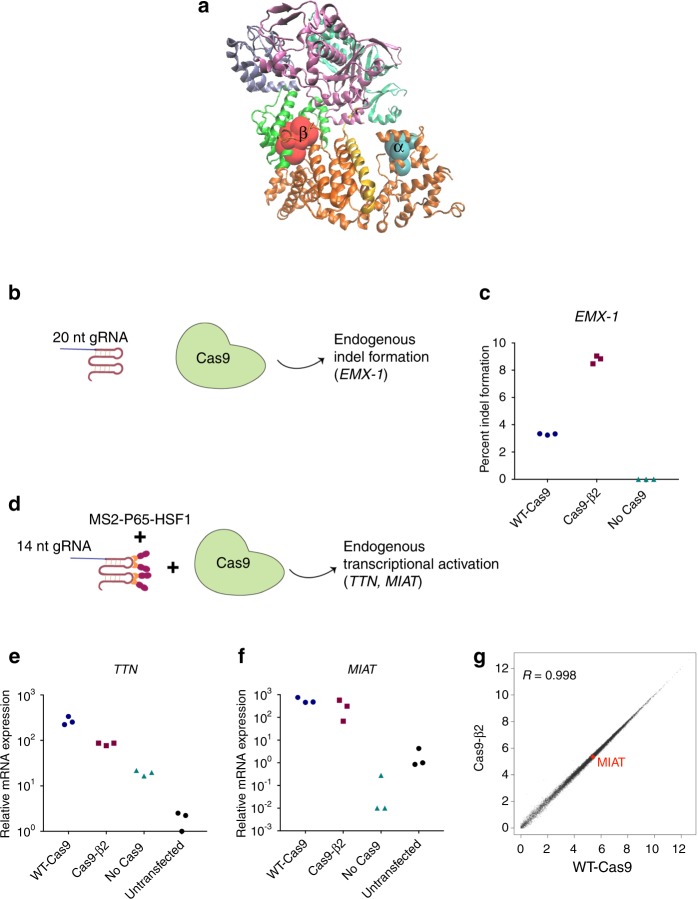
“This finding demonstrated that Cas9 proteins can be modified to eliminate immunodominant epitopes through targeted mutations while preserving its function and specificity (Figure 2) [96].”
From Immune responses to gene editing by viral and non-viral delivery vectors used in retinal gene therapy (2022) · cites this paper as [96]
In the citing paper
“When SpCas9 with mutations in the selected epitopes was delivered to healthy donor B-cell APCs, the measured T-cell response had significantly decreased.”
From Immune responses to gene editing by viral and non-viral delivery vectors used in retinal gene therapy (2022) · cites this paper as [96]
In the citing paper
“Furthermore, a high prevalence of preexisting cellular immunity against Cas9 (Cas9-reactive T-cells) has also been identified2–4.”
From Investigation of Cas9 Antibodies in the Human Eye (2022) · cites this paper as [2]
In the citing paper
“some studies have found preexisting serum α-Cas9 to be present in only 2.5–10% of large human cohorts1,2.”
From Investigation of Cas9 Antibodies in the Human Eye (2022) · cites this paper as [2]
In the citing paper
“multiple groups have reported high frequencies (>60% of patients) of Cas9 reactive T-cells in humans2–4.”
From Investigation of Cas9 Antibodies in the Human Eye (2022) · cites this paper as [2]
Self-check
Percentages, sums and reported differences re-computed from the paper’s own numbers.
The self-check needs the paper’s full text.
Citations
Cites
VMD: visual molecular dynamics
Humphrey, W., Dalke, A., & Schulten, K. (1996) · Journal of Molecular Graphics · doi:10.1016/0263-7855(96)00018-5 · Cited by 66,952
STAR: ultrafast universal RNA-seq aligner
Dobin, A., Davis, C. A., Schlesinger, F., Drenkow, J., Zaleski, C., Jha, S., Batut, P., Chaisson, M., & Gingeras, T. R. (2013) · Bioinformatics · doi:10.1093/bioinformatics/bts635 · Cited by 51,709
Robinson, M. D., McCarthy, D. J., & Smyth, G. K. (2010) · Bioinformatics · doi:10.1093/bioinformatics/btp616 · Cited by 41,364
Trapnell, C., Roberts, A., Goff, L. A., Pertea, G. M., Kim, D., Kelley, D. R., Pimentel, H., Salzberg, S. L., Rinn, J. L., & Pachter, L. S. (2012) · Nature Protocols · doi:10.1038/nprot.2012.016 · Cited by 12,145
Non-viral vectors for gene-based therapy
Yin, H., Kanasty, R. L., Eltoukhy, A. A., Vegas, A. J., Dorkin, J. R., & Anderson, D. G. (2014) · Nature Reviews Genetics · doi:10.1038/nrg3763 · Cited by 3,123
The global burden of group A streptococcal diseases
Carapetis, J. R., Steer, A. C., Mulholland, E. K., & Weber, M. (2005) · The Lancet Infectious Diseases · doi:10.1016/s1473-3099(05)70267-x · Cited by 3,001
Gene Therapy of Human Severe Combined Immunodeficiency (SCID)-X1 Disease
Cavazzana, M., Hacein‐Bey‐Abina, S., Basile, G. D. S., Gross, F., Yvon, E. S., Nusbaum, P., Selz, F., Hue, C., Dogniaux, S., Casanova, J., et al. (2000) · Science · doi:10.1126/science.288.5466.669 · Cited by 2,685
SYFPEITHI: database for MHC ligands and peptide motifs
Rammensee, H., Bachmann, J., Emmerich, N., Bachor, O. A., & Stevanović, S. (1999) · Immunogenetics · doi:10.1007/s002510050595 · Cited by 2,316
Crystal structure of Cas9 in complex with guide RNA and target DNA
Nishimasu, H., Ran, F. A., Hsu, P. D., Konermann, S., Shehata, S. I., Dohmae, N., Ishitani, R., Zhang, F., & Nureki, O. (2014) · Cell · doi:10.1016/j.cell.2014.02.001 · Cited by 2,306
Manno, C. S., Pierce, G. F., Arruda, V. R., Glader, B., Ragni, M., Rasko, J. J. E., Ozelo, M. C., Hoots, K., Blatt, P., Konkle, B., et al. (2006) · Nature Medicine · doi:10.1038/nm1358 · Cited by 2,163
Cited by
Sorted by citations
Items 201–204 of 204
Hu, B., Gutty, V. S. R., Herzog, R. W., & Duan, D. (2026) · Frontiers in Medicine · doi:10.3389/fmed.2026.1930231
CRISPR/Cas9 technology in oncology: mechanisms, applications, and future perspectives
Абдурахманович, О. М., Karacheva, E. I., Arapieva, M. M., Ulyumdzhiev, K. S., Deiko, V. A., & Муллаянович, Б. И. (2026) · Сибирский научный медицинский журнал · doi:10.18699/ssmj20260403
The CRISPR/Cas technology landscape: From molecular mechanisms to multidisciplinary applications
Liu, Z., Yang, Y., Li, Z., Li, P., Jia, J., Qiao, X., Su, Y., Qin, Y., Wang, H., Dai, Y., et al. (2026) · Genes & Diseases · doi:10.1016/j.gendis.2026.102484
Edición genética: una valoración científica y bioética del primer caso en seres humanos en el Perú
Paredes-Moscosso, S. R., Villegas-Llerena, C., & Carbajal, C. Ñ. (2026) · Medicina y Ética · doi:10.36105/mye.2026v37n4.01
Metadata
- Authors
- Ferdosi, S. R., Ewaisha, R., Moghadam, F., Krishna, S., Park, J. G., Ebrahimkhani, M. R., Kiani, S., & Anderson, K. S.
- Affiliations
- Arizona State University (US)
- Mayo Clinic (US)
- Corresponding author
- Kiani, Samira
- Anderson, Karen S.
- ORCID
- Venue
- Nature Communications
- Published
- 2019-04-23
- Volume
- 10
- Issue
- 1
- Pages
- 1842-1842
- ISSN
- 2041-1723 (ISSN-L)
- PMC
- PMC6478683
- OpenAlex
- W2950183003
- Cited by
- 204
- References
- 60
- Citations by year
- 2026: 17 · 2025: 36 · 2024: 23 · 2023: 31 · 2022: 31 · 2021: 26 · 2020: 27 · 2019: 12
- FWCI
- 7.94
- Type
- journal article
- Language
- en
- Open access
- gold
- doi.org
- Locations
- Nature Communications (publishedVersion, cc-by)
- bioRxiv (Cold Spring Harbor Laboratory) (acceptedVersion, cc-by-nc-nd)
- Europe PMC (PubMed Central) (publishedVersion, cc-by)
- PubMed Central (publishedVersion, cc-by)
- PubMed (publishedVersion)
- RePEc: Research Papers in Economics (submittedVersion)
- DOAJ (DOAJ: Directory of Open Access Journals) (submittedVersion)
- DOAJ (DOAJ: Directory of Open Access Journals) (submittedVersion, cc-by-sa)
- Funders
- Massachusetts General Hospital
- Defense Advanced Research Projects Agency (D16AP00047)
- National Institute of Biomedical Imaging and Bioengineering (R01EB024562)
- Topics
- Life Sciences › Biochemistry, Genetics and Molecular Biology › Molecular Biology › CRISPR and Genetic Engineering
- Life Sciences › Biochemistry, Genetics and Molecular Biology › Molecular Biology › vaccines and immunoinformatics approaches
- Health Sciences › Medicine › Oncology › CAR-T cell therapy research
- Keywords
- CRISPR/Cas9, SpCas9, T cell epitopes, CD8+ T cell immunity, HLA-A*0201, epitope prediction, immunogenicity, gene therapy, personalized gene therapy
- MeSH terms
- CRISPR-Associated Protein 9, Antibodies, Bacterial, Antigen-Presenting Cells, Humans, Lymphocyte Activation, Streptococcus pyogenes, HLA-A Antigens, Genetic Therapy, Mutagenesis, CD8-Positive T-Lymphocytes, Epitope Mapping, Epitopes, T-Lymphocyte, Precision Medicine, HEK293 Cells, Cell Engineering, Healthy Volunteers
About these checks
Registry, retraction, Cites and statistics results are computed, not judged, with one exception: a printed reference that no index lists is read once by a model before it counts as a citation error. Claims are extracted by a model and kept only when their quote appears verbatim in the text; each cited source is then checked, with a model’s help, for whether it says what the claim relies on. Those verdicts can be wrong — read the claim’s quote and the cited source before relying on one.
Statistics and arithmetic are recomputed, not judged.
Confidence bands are shown only for fields calibrated on our annotated test set. None is calibrated yet, so no band is shown.
What counts as a claim ›How we measure confidence ›How we check this ›
Are you an author, or do you see a problem with this page? Request a review
