

The DOI matches its Crossref record; 4 of the 4 references it cites were found in a registry or an index.
Palaeodemographic modelling supports a population bottleneck during the Pleistocene-Holocene transition in Iberia
Abstract
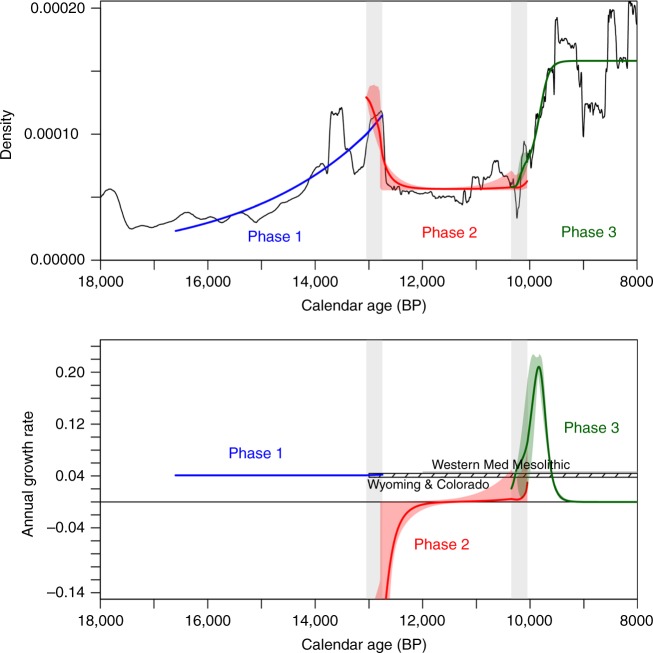
Demographic change lies at the core of debates on genetic inheritance and resilience to climate change of prehistoric hunter-gatherers. Here we analyze the radiocarbon record of Iberia to reconstruct long-term changes in population levels and test different models of demographic growth during the Last Glacial-Interglacial transition. Our best fitting demographic model is composed of three phases. First, we document a regime of exponential population increase during the Late Glacial warming period (c.16.6-12.9 kya). Second, we identify a phase of sustained population contraction and stagnation, beginning with the cold episode of the Younger Dryas and continuing through the first half of the Early Holocene (12.9-10.2 kya). Finally, we report a third phase of density-dependent logistic growth (10.2-8 kya), with rapid population increase followed by stabilization. Our results support a population bottleneck hypothesis during the Last Glacial-Interglacial transition, providing a demographic context to interpret major shifts of prehistoric genetic groups in south-west Europe.
Overview
The claims and statistics of this paper haven’t been checked yet.
Run the check — free, no account needed. It reads the open-access text and checks the sources it cites.
Integrity signals
Registry
Cites
Statistics
Figures
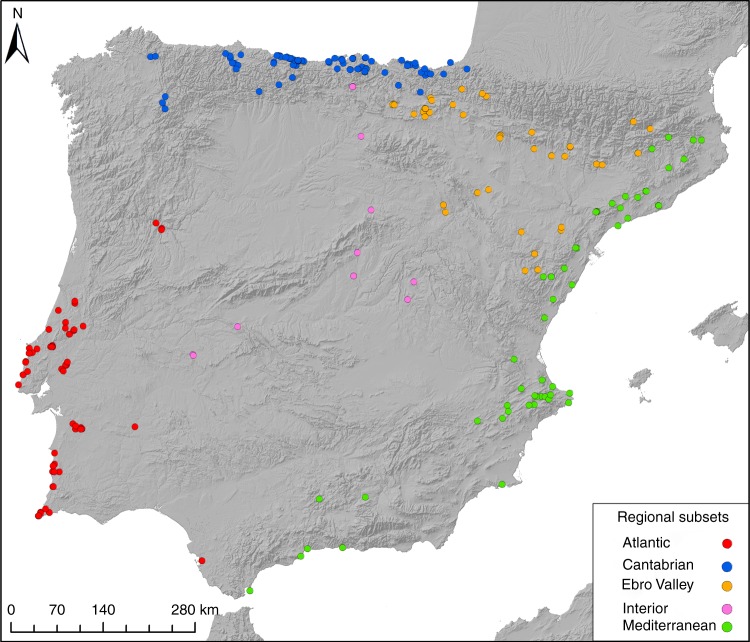
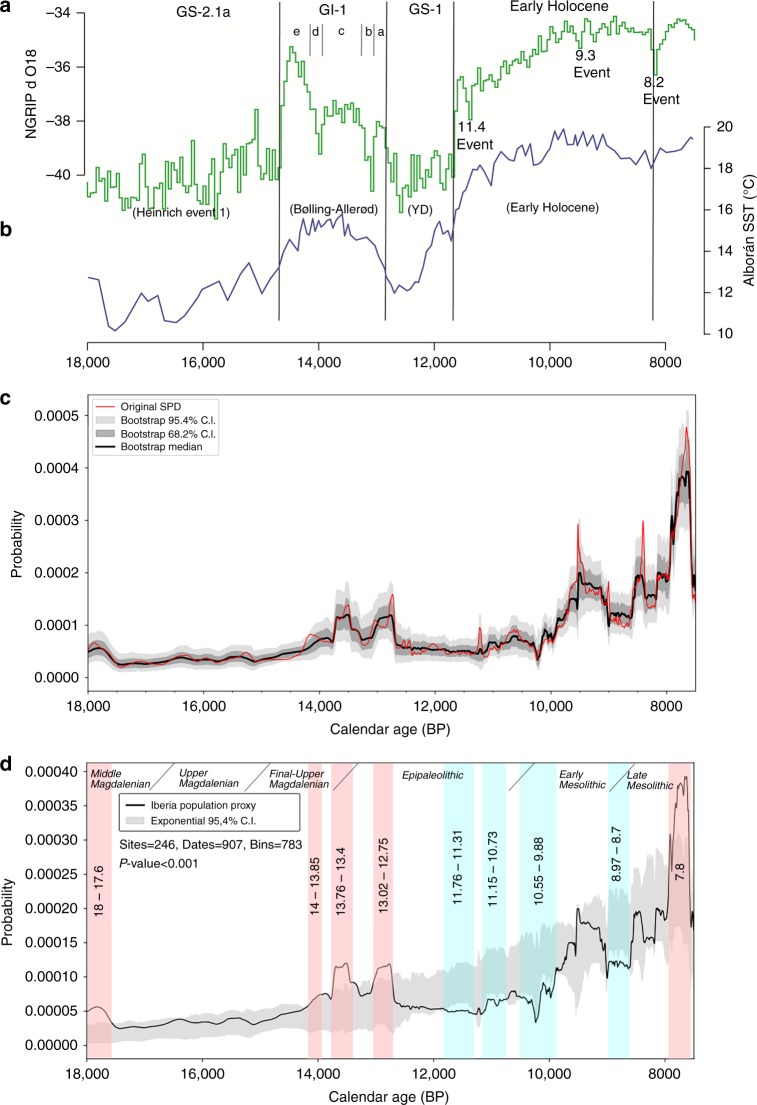
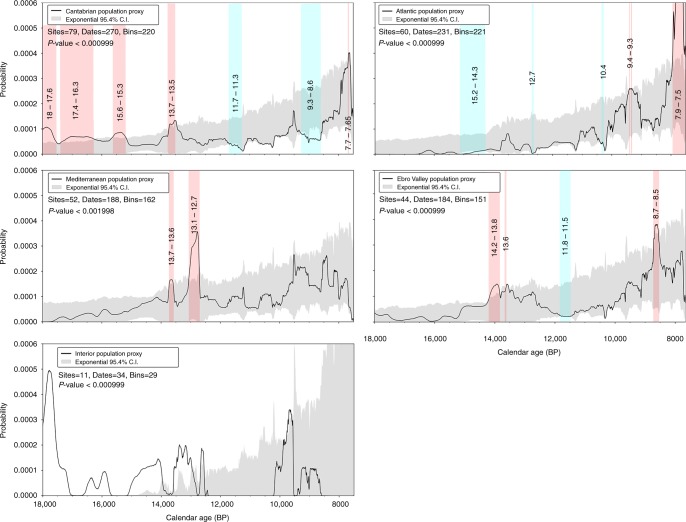
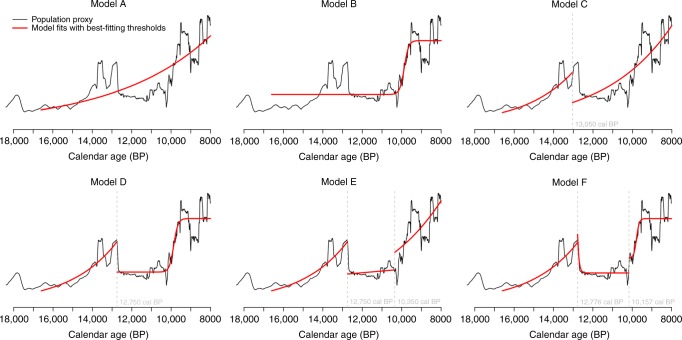
Verification
Claims the paper makes
The claims and statistics of this paper haven’t been checked yet.
Run the check — free, no account needed. It reads the open-access text and checks the sources it cites.
Claims other papers make about this one
Each is checked against this paper’s own text: does it say what the citing paper says it does?
The cited source says what the claim attributes to it.
In the citing paper
“Furthermore, human population dynamics are not linear (Diachenko and Zubrow 2015; Fernández-López de Pablo et al. 2019; Verhagen et al. 2014).”
From From landscape affordances to landscape connectivity: contextualizing an archaeology of human ecology (2020) · cites this paper as Fernández-López de Pablo et al. 2019
Self-check
Percentages, sums and reported differences re-computed from the paper’s own numbers.
The self-check needs the paper’s full text.
Citations
Cites
IntCal13 and Marine13 radiocarbon age calibration curves 0–50,000 years cal BP
Reimer, P. J., Bard, E., Bayliss, A., Beck, J. W., Blackwell, P. G., Ramsey, C. B., Buck, C. E., Cheng, H., Edwards, R. L., Friedrich, M., et al. (2013) · Radiocarbon · doi:10.2458/azu_js_rc.55.16947 · Cited by 14,591
The genetic history of Ice Age Europe
Fu, Q., Posth, C., Hajdinjak, M., Petr, M., Mallick, S., Fernandes, D., Furtwängler, A., Haak, W., Meyer, M., Mittnik, A., et al. (2016) · Nature · doi:10.1038/nature17993 · Cited by 959
The genomic history of the Iberian Peninsula over the past 8000 years
Olalde, I., Mallick, S., Patterson, N., Rohland, N., Villalba-Mouco, V., Silva, M., Dulias, K., Edwards, C. J., Gandini, F., Pala, M., et al. (2019) · Science · doi:10.1126/science.aav4040 · Cited by 552
Recent Explosive Human Population Growth Has Resulted in an Excess of Rare Genetic Variants
Keinan, A., & Clark, A. G. (2012) · Science · doi:10.1126/science.1217283 · Cited by 548
Research works printed but not linked: 74
- Riede, F. Climate and demography in early prehistory: using calibrated 14C dates as population proxies. Hum. Biol. 81, 309–337 (2009). · DOI
- Kelly, R. L., Surovell, T. A., Shuman, B. N. & Smith, G. M. A continuous climatic impact on Holocene human population in the Rocky Mountains. Proc. Natl Acad. Sci. USA 110, 443–447 (2013). · DOI
- Stiner, M. C. & Khun, S. L. Changes in the ‘Connectedness’ and Resilience of Paleolithic Societies in Mediterranean Ecosystems. Hum. Ecol. 34, 693–712 (2006). · DOI
- Yang, M. A. & Fu, Q. Insights into modern human Prehistory using ancient genomes. Trends Genet 34, 184–196 (2018). · DOI
- Williams, A. N. The use of summed radiocarbon probability distributions in archaeology: a review of methods. J. Archaeol. Sci. 39, 578–589 (2012). · DOI
- Shennan, S. et al. Regional population collapse followed initial agriculture booms in mid-Holocene Europe. Nat. Commun. 4, 2486 (2013). · DOI
- Steele, J. Radiocarbon dates as data: quantitative strategies for estimating colonization front speeds and event densities. J. Archaeol. Sci. 37, 2017–2030 (2010). · DOI
- Timpson, A. et al. Reconstructing regional population fluctuations in the European Neolithic using radiocarbon dates: a new case-study using an improved method. J. Archaeol. Sci. 52, 549–557 (2014). · DOI
- Crema, E., Habu, J., Kobayashi, K. & Madella, M. Summed probability distribution of 14C dates suggests regional divergences in the population dynamics of the Jomon Period in Eastern Japan. PLoS ONE 11, e0154809 (2016). · DOI · Paper page
- Surovell, T. A., Finley, J., Smith, G. M., Brantingham, P. & Kelly, R. L. Correcting temporal frequency distributions for taphonomic bias. J. Archaeol. Sci. 36, 1715–1724 (2009). · DOI
- Freeman, J., Byers, D. A., Robinson, E. & Kelly, R. L. Culture process and the interpretation of radiocarbon data. Radiocarbon 60, 453–467 (2018). · DOI
- Contreras, D. A. & Meadows, J. Summed radiocarbon calibrations as a population proxy: a critical evaluation using a realistic simulation approach. J. Archaeol. Sci. 52, 591–608 (2014). · DOI
- Gamble, C., Davies, W., Pettit, P. & Richards, M. Climate change and evolving human diversity in Europe during the Last Glacial. Philos. Trans. R. Soc. Lond. B 359, 243–254 (2004). · DOI
- Gamble, C., Davies, W., Pettitt, P., Hazelwood, L. & Richards, M. The archaeological and genetic foundations of the European population during the Late Glacial: implications for agricultural thinking. Camb. Archaeol. J. 15, 193–223 (2005). · DOI
- Tallavaara, M., Luoto, M., Korhonen, N., Järvinen, H. & Seppä, H. Human population dynamics in Europe over the Last Glacial Maximum. Proc. Natl Acad. Sci. USA 112, 8232–8237 (2015). · DOI
- Brown, W. A. The past and future of growth rate estimation in demographic temporal frequency analysis: Biodemographic interpretability and the ascendance of dynamic growth models. J. Archaeol. Sci. 80, 96–108 (2017). · DOI
- Zahid, H. J., Robinson, E. & Kelly, R. L. Agriculture, population growth, and statistical analysis of the radiocarbon record. Proc. Natl Acad. Sci. USA 113, 931–935 (2016). · DOI
- Goldberg, A., Mychajliw, A. M. & Hadly, E. A. Post-invasion demography of prehistoric humans in South America. Nature 532, 232–235 (2016). · DOI
- Johansen, N. N., Larson, G., Meltzer, D. J. & Vander, M. A composite window into human history. Science 356, 1118–1120 (2017). · DOI
- Barton, C. M. et al. Risk and resilience in the late glacial: a case study from the western Mediterranean. Quat. Sci. Rev. 184, 68–84 (2018). · DOI
- Alday, A. et al. The silence of the layers: Archaeological site visibility in the Pleistocene-Holocene transition at the Ebro Basin. Quat. Sci. Rev. 184, 65–106 (2018). · DOI
- Clark, G. A., Barton, C. M. & Straus, L. G. Landscapes, climate and forager mobility in the Upper Paleolithic of northern Spain. Quat. Int. https://doi.org/10.1016/j.quaint.2018.04.037 (2018). · DOI
- Michczynska, D. J. & Pazdur, A. Shape analysis of cumulative probability density function of radiocarbon dates set in the study of climate change in the Late Glacial Holocene. Radiocarbon 46, 733–744 (2004). · DOI
- Fletcher, W. J., Sanchez, M. F., Peyron, O. & Dormoy, I. Abrupt climate changes of the last deglaciation detected in a Western Mediterranean forest record. Clim. . 6, 245–264 (2010).
- González-Sampériz, P. et al. Patterns of human occupation during the Early Holocene in the Central Ebro Basin (NE Spain) in response to the 8.2 ka climatic event. Quat. Res. 71, 121–132 (2009). · DOI
- Fernández-López de Pablo, J. & Jochim, M. A. The impact of the 8,200 cal BP climatic event on human mobility strategies during the Iberian Late Mesolithic. J. Anthropol. Res. 66, 39–68 (2010). · DOI
- Rhode, D., Brantingham, P. J., Perreault, Ch & Madsen, D. B. Mind the gaps: testing for hiatuses in regional radiocarbon date sequences. J. Archaeol. Sci. 52, 567–577 (2014). · DOI
- Straus, L. G. Environmental and cultural changes across the Pleistocene-Holocene transition in Cantabrian Spain. Quat. Int. 465, 222–233 (2018). · DOI
- Nukushina, D. In Entre Ciência e Cultura: Da Interdisciplinaridade à Transversalidade da Arqueologia. Actas das VIII Jornadas de Jovens em Investigação Arqueológica, Colecção ArqueoArte (eds. Coelho, I., Torres, J., Gil, L. & Ramos T.) Vol. 4, 43–51 (Centro de História d’Aquém e d’Além-MarFaculdade de Ciências Sociais e Humanas – Universidade Nova de Lisboa e Universidade dos Açores AND Instituto de Estudos MedievaisFaculdade de Ciências Sociais e Humanas – Universidade Nova de Lisboa, Lisboa, 2016).
- Bicho, N., Umbelino, C., Detry, C. & Pereira, T. The emergence of Muge Mesolithic shell middens in Central Portugal and the 8200 cal yr BP Cold Event. J. Isl. Coast. Archaeol. 5, 86–104 (2010). · DOI
- Zilhão, J. Time Is On My Side. In The Dynamics of Neolithisation in Europe. Studies in honour of Andrew Sherratt (eds Hadjikoumis, A., Robinson, E., Viner, S.) 45–65 (Oxbow Books, Oxford, 2011). · DOI
- Fano, M. A., Cubas, M. & Wood, R. The first farmers in Cantabrian Spain: Contributions of numerical chronology to understand an historical process. Quat. Int. 364, 153–161 (2015). · DOI
- Aho, K., Derryberry, D. & Peterson, T. Model selection for ecologists: the worldviews of AIC and BIC. Ecology 95, 631–636 (2014). · DOI · Paper page
- Arim, M., Abades, S. R., Neil, P. E., Lima, M. & Marquet, P. A. Spread dynamics of invasive species. Proc. Natl Acad. Sci. USA 103, 374–378 (2006). · DOI
- Silva, F. & Vander Linden, M. Amplitude of travelling front as inferred from 14C predicts levels of genetic admixture among European early farmers. Sci. Rep. 7, 11985 (2017). · DOI
- Roberts, N. et al. Human responses and non-responses to climatic variations during the last Glacial-Interglacial transition in the eastern Mediterranean. Quat. Sci. Rev. 184, 47–67 (2018). · DOI
- Kingsland, S. The refractory model: The logistic curve and the history of population ecology. Q. Rev. Biol. 57, 29–52 (1982). · DOI
- Young, D. A. & Bettinger, R. L. Simulating the global human expansion in the Late Pleistocene. J. Archaeol. Sci. 22, 89–92 (1995). · DOI
- Bettinger, R. L. & Young, D. A. Hunter-gatherer population expansion in North Asia and the New World. In Entering America, Northeast Asia and Beringia before the Last Glacial Maximum (ed. Madsen, D.) 239–251 (University of Utah Press, Salt Lake City, 2004).
- Bevan, A. et al. Holocene fluctuations in human population demonstrate repeated links to food production and climate. Proc. Natl Acad. Sci. USA 114, E10524–E10531 (2017). · DOI
- Buchanan, B., Collard, M. & Edinborough, K. Paleoindian demography and the extraterrestrial impact hypothesis. Proc. Natl Acad. Sci. USA 105, 11651–11654 (2008). · DOI
- Courchamp, F., Clutton-Brock, T. H. & Grenfell, B. T. Inverse density dependence and the Allee effect. Trends Ecol. Evol. 14, 405–410 (1999). · DOI · Paper page
- Steele, J. Human dispersals: mathematical models and the archaeological record. Hum. Biol. 81, 121–140 (2009). · DOI
- Winterhalder, B. & Goland, C. On population, foraging efficiency, and plant domestication. Curr. Anthropol. 34, 710–715 (1993). · DOI
- Aura, J. E. et al. Economic transitions in finis terra: the western Mediterranean of Iberia, 15–7 ka BP. Farming 2, 1–17 (2009). (online version).
- Marín-Arroyo, A. B. Economic adaptations during the Late Glacial in northern Spain: a simulation approach. Before Farming 2, 1-18 (online version)(2009). · DOI
- Jones, E. L. Archaeofaunal evidence of human adaptation to climate change in Upper Paleolithic Iberia. J. Archaeol. Sci. Rep. 2, 257–263 (2015). · DOI
- Gutiérrez-Zugasti, I. Coastal resource intensification across the Pleistocene-Holocene transition in Northern Spain: Evidence from shell size and age distributions of marine gastropods. Quat. Int. 244, 54–66 (2011). · DOI
- Jordá, J. F. et al. Breaking the waves: Human use of marine bivalves in a microtidal range coast during the Upper Pleistocene and the Early Holocene, Vestíbulo chamber, Nerja Cave (Málaga, southern Spain). Quat. Int. 407, 59–79 (2016). · DOI
- Freeman, J. et al. Synchronization of energy consumption by human societies throughout the Holocene. Proc. Natl Acad. Sci. USA 115, 9962–9967 (2018). · DOI
- Bocquet-Appel, J. P. Paleoanthropological traces of a Neolithic demographic transition. Curr. Anthropol. 43, 637–650 (2002). · DOI
- Hamilton, M. J., Milne, B. T., Walker, R. S., Burger, O. & Brown, J. H. The complex structure of hunter-gatherer social networks. Proc. R. Soc. Lond. B: Biol. Sci. 274, 2195–2203 (2007). · DOI
- Cacho, I. et al. Variability of the western Mediterranean Sea surface temperature during the last 25,000 years and its connection with the Northern Hemisphere climatic changes. Paleoceanography 16, 40–52 (2001). · DOI
- Burjachs, F., Jones, S. E., Giralt, S. & Fernández-López de Pablo, J. Lateglacial to Early Holocene recursive aridity events in the SE Mediterranean Iberian Peninsula: The Salines playa lake case study. Quat. Int. 403, 187–200 (2016). · DOI · Paper page
- Morellón, M., Aranbarri, J., Moreno, A., González-Sampériz, P. & Valero-Garcés, B. L. Early Holocene humidity patterns in the Iberian Peninsula reconstructed from lake, pollen and speleothem records. Quat. Sci. Rev. 181, 1–18 (2018). · DOI
- Lubell, D., Jackes, M., Schwarcz, H., Knyf, M. & Meiklejohn, C. The Mesolithic-Neolithic transition in Portugal: isotopic and dental evidence of diet. J. Archaeol. Sci. 21, 201–216 (1994). · DOI
- García-Guixé, E., Subira, M. E. & Richards, M. P. Paleodiets of humans and fauna from the Spanish Mesolithic site of El Collado. Curr. Anthropol. 47, 549–556 (2006). · DOI
- Fernández-López de Pablo, J. & Gabriel, S. El Collado shell midden and the exploitation patterns of littoral resources during the Mesolithic in the Eastern Iberian Peninsula. Quat. Int. 407, 106–117 (2016). · DOI
- Salazar-García, D. C. et al. Isotope evidence for the use of marine resources in the Eastern Iberian Mesolithic. J. Archaeol. Sci. 42, 231–240 (2014). · DOI
- Marín-Arroyo, A. B. Human response to Holocene warming on the Cantabrian Coast (northern Spain): an unexpected outcome. Quat. Sci. Rev. 81, 1–11 (2013). · DOI
- Dias, R., Detry, C. & Bicho, N. Changes in the exploitation dynamics of small terrestrial vertebrates and fish during the Pleistocene-Holocene transition in the SW Iberian Peninsula: A review. Holocene 26, 964–984 (2016). · DOI
- Bergadà, M. M., Villaverde, V. & Román, D. Microstratigraphy of the magdalenian sequence at Cendres Cave (Teulada-Moraira, alicante, Spain): Formation and diagenesis. Quat. Int. 315, 56–75 (2013). · DOI
- Bergadà, M. M. et al. Chronostratigraphy in karst records from the Epipaleolithic to the Mid/Early Neolithic (c.13.0-6.0 cal ka BP) in the Catalan coastal Ranges of NE Iberia: environmental changes, sedimentary processes and human activity. Quat. Sci. Rev. 184, 26–46 (2017). · DOI
- Torfing, T. Demographic proxies for the Neolithic with emphasis on the Langeland Region, Denmark. Acta Archaeol. 87, 33–48 (2016). · DOI
- Crombé, Ph & Robinson, E. 14C dates as demographic proxies in Neolithisation models of northwestern Europe: a critical assessment using Belgium and northeast France as a case-study. J. Archaeol. Sci. 52, 558–566 (2014). · DOI
- Naudinot, N., Tomasso, A., Tozzi, C. & Peresani, M. Changes in mobility patterns as a factor of 14C date density variation in the Late Epigravettian of Northern Italy and Southeastern France. J. Archaeol. Sci. 52, 578–590 (2014). · DOI
- Posth, C. et al. Pleistocene mitochondrial genomes suggest a single major dispersal of Non-Africans and a Late Glacial population turnover in Europe. Curr. Biol. 26, 827–833 (2016). · DOI · Paper page
- Villalba-Mouco, V. et al. Survival of Late Pleistocene Hunter-Gatherer Ancestry in the Iberian Peninsula. Curr. Biol. 29, 1–9 (2019). · DOI
- Anderson, D., Goodyear, A. C., Kennett, J. & West, A. Multiple lines of evidence for possible Human population decline/settlement reorganization during the early Younger Dryas. Quat. Int. 242, 570–583 (2011). · DOI
- Bos, A. A. et al. The Younger Dryas and Preboreal landscape in the Moervaart area (northwestern Belgium) and the apparent decrease in human occupation. Veg. Hist. Archaeobotany 27, 697–715 (2018). · DOI
- Michczynski, A. & Michczynska, D. J. The effect of PDF peaks’ height increase during calibration of radiocarbon date sets. Geochronometria 25, 1–4 (2006).
- Efron, B. Bootstrap Methods: Another Look at the Jackknife. Ann. Stat. 7, 1–26 (1979). · DOI · Paper page
- Rasmussen, S. O. et al. A stratigraphic framework for abrupt climatic changes during the Last Glacial period based on three synchronized Greenland ice-core records: refining and extending the INTIMATE event stratigraphy. Quat. Sci. Rev. 106, 14–28 (2014). · DOI
- Burnham, K. P., Anderson, D. R. Model Selection and Multimodel Inference: A Practical Information-Theoretic Approach 2nd edn, (Springer-Verlag, New York, 2002).
Cited by
Sorted by citations
DiNapoli, R. J., Crema, E. R., Lipo, C. P., Rieth, T. M., & Hunt, T. L. (2021) · Nature Communications · doi:10.1038/s41467-021-24252-z · Cited by 43
Kempf, M. (2020) · Archaeological and Anthropological Sciences · doi:10.1007/s12520-020-01157-4 · Cited by 30
Metadata
- Authors
- Fernández-López de Pablo, J., Gutiérrez-Roig, M., Gómez-Puche, M., McLaughlin, R., Silva, F., & Lozano, S.
- Venue
- Nature Communications
- Published
- 2019-04-23
- Volume
- 10
- Issue
- 1
- ISSN
- 2041-1723
- PMC
- PMC6478856
- Cited by
- 69
- References
- 4
- Language
- en
About these checks
Registry, retraction, Cites and statistics results are computed, not judged, with one exception: a printed reference that no index lists is read once by a model before it counts as a citation error. Claims are extracted by a model and kept only when their quote appears verbatim in the text; each cited source is then checked, with a model’s help, for whether it says what the claim relies on. Those verdicts can be wrong — read the claim’s quote and the cited source before relying on one.
Statistics and arithmetic are recomputed, not judged.
Confidence bands are shown only for fields calibrated on our annotated test set. None is calibrated yet, so no band is shown.
What counts as a claim ›How we measure confidence ›How we check this ›
Are you an author, or do you see a problem with this page? Request a review
