

The DOI matches its Crossref record; 8 of the 8 references it cites were found in a registry or an index.
Regulation of locomotor speed and selection of active sets of neurons by V1 neurons
Open accessAbstract
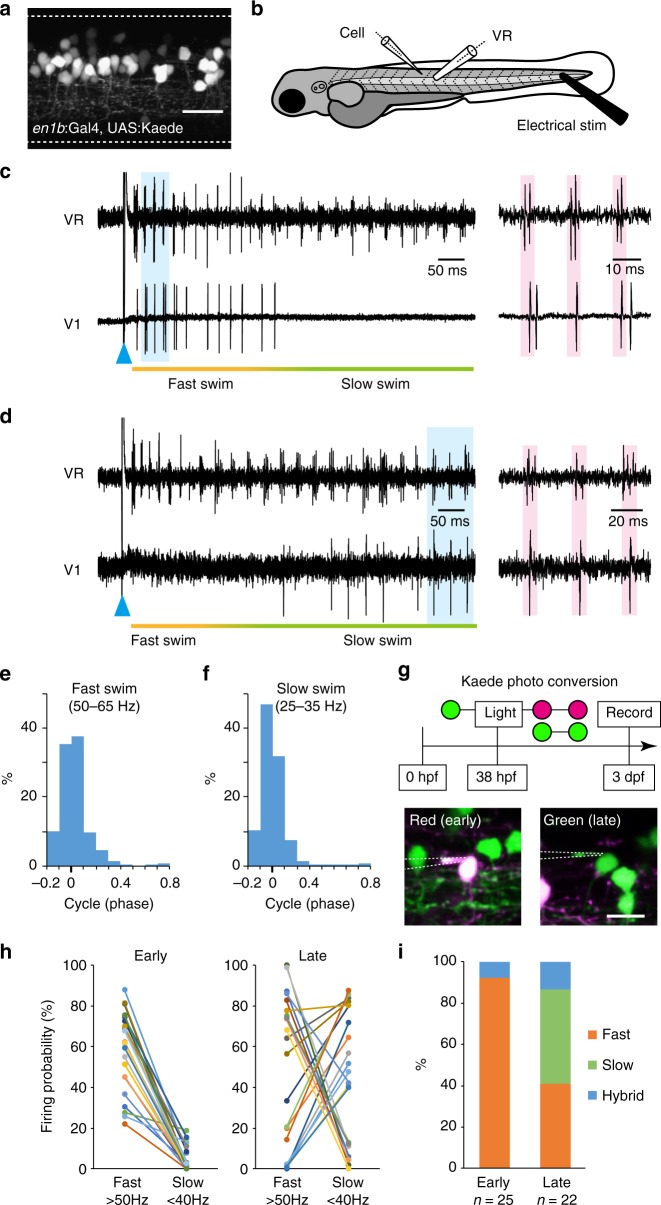
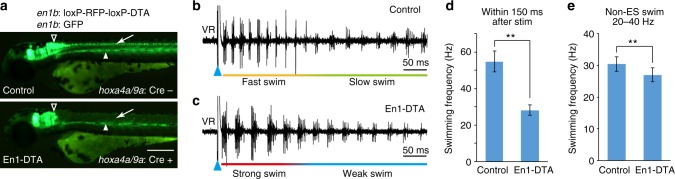
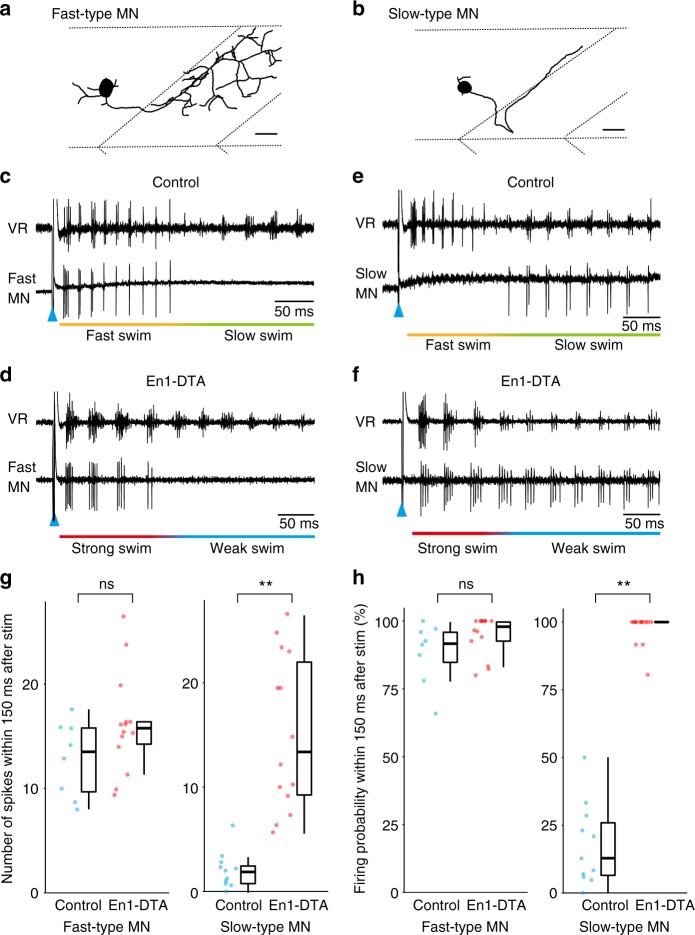
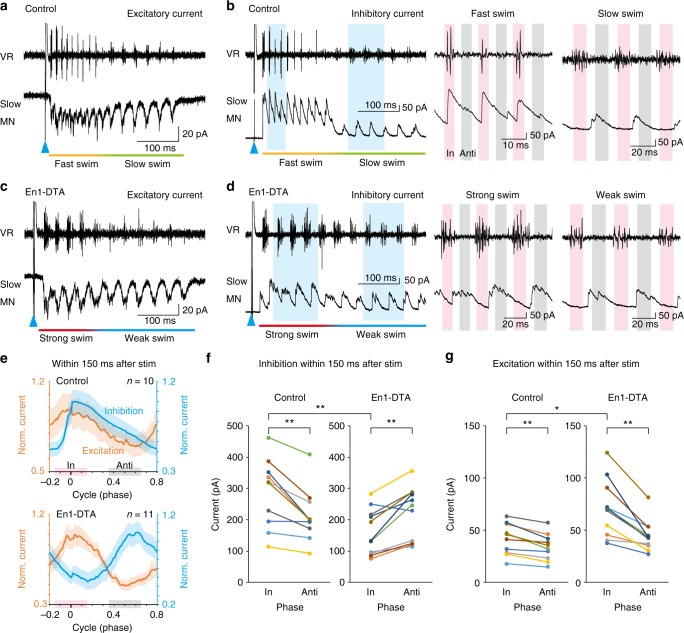
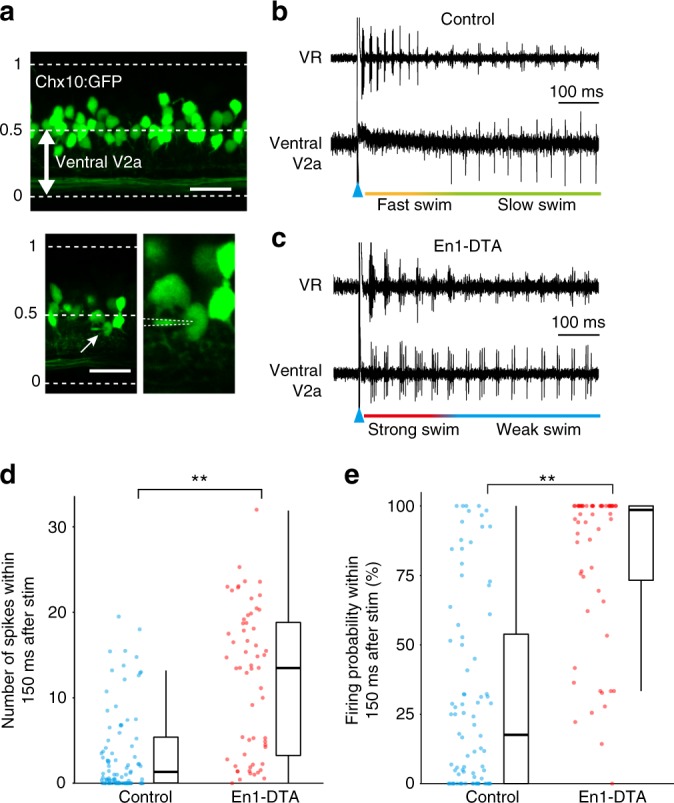
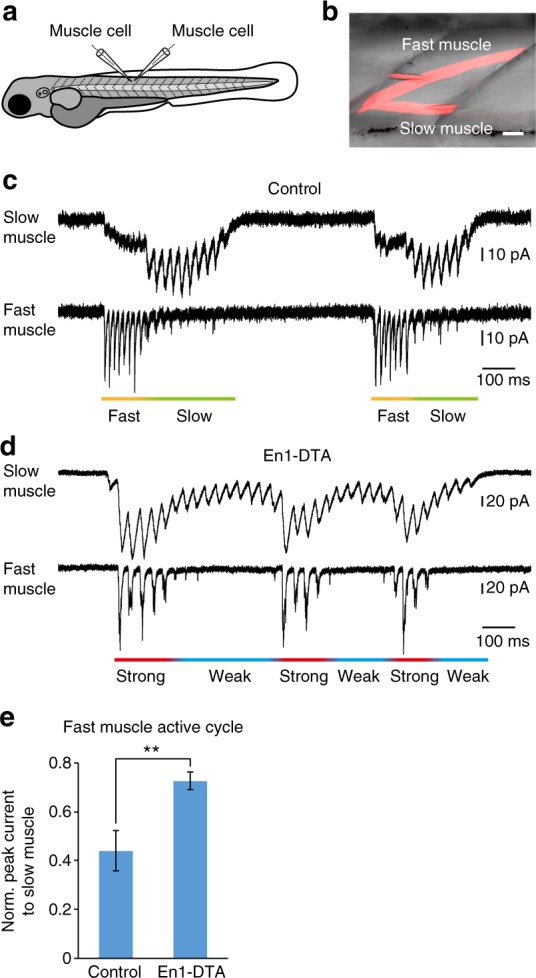
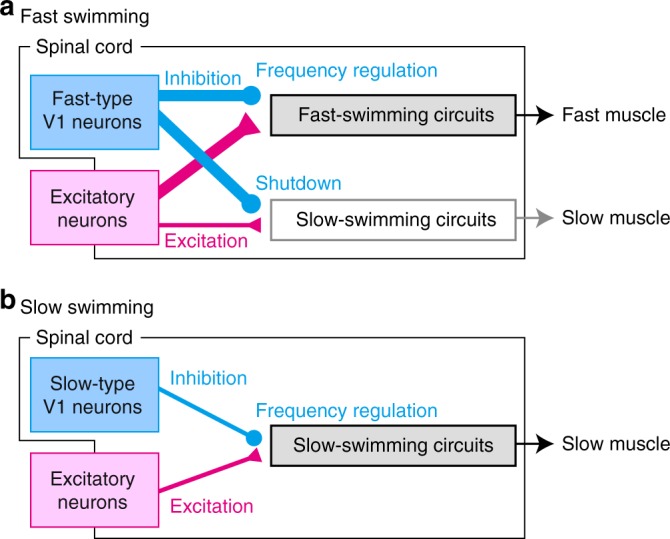
During fast movements in vertebrates, slow motor units are thought to be deactivated due to the mechanical demands of muscle contraction, but the associated neuronal mechanisms for this are unknown. Here, we perform functional analyses of spinal V1 neurons by selectively killing them in larval zebrafish, revealing two functions of V1 neurons. The first is the long-proposed role of V1 neurons: they play an important role in shortening the cycle period during swimming by providing in-phase inhibition. The second is that V1 neurons play an important role in the selection of active sets of neurons. We show that strong inhibitory inputs coming from V1 neurons play a crucial role in suppressing the activities of slow-type V2a and motor neurons, and, consequently, of slow muscles during fast swimming. Our results thus highlight the critical role of spinal inhibitory neurons for silencing slow-component neurons during fast movements.
Overview
The claims and statistics of this paper haven’t been checked yet.
Run the check — free, no account needed. It reads the open-access text and checks the sources it cites.
Integrity signals
Registry
Cites
Statistics
Figures
Verification
Claims the paper makes
The claims and statistics of this paper haven’t been checked yet.
Run the check — free, no account needed. It reads the open-access text and checks the sources it cites.
Claims other papers make about this one
Each is checked against this paper’s own text: does it say what the citing paper says it does?
The cited source doesn’t support the claim as written.
In the citing paper
“Genetic ablation of the ipsilaterally ascending inhibitory V1 INs increased swim vigor but produced no overt changes in swimming patterns (Kimura and Higashijima, 2019).”
From Modeling spinal locomotor circuits for movements in developing zebrafish (2021) · cites this paper as Kimura and Higashijima, 2019
Checked by a reasoning model — may be wrong.
Experimental — accuracy not yet measuredThe source backs part of the claim, not all of it — or backs it for a different population, condition or comparison.
In the citing paper
“Genetic ablation of ipsilaterally projecting, inhibitory neurons in the V1 population affects swim vigor but has no effects on the patterning of swimming (Kimura and Higashijima, 2019).”
From Modeling spinal locomotor circuits for movements in developing zebrafish (2021) · cites this paper as Kimura and Higashijima, 2019
Experimental — accuracy not yet measuredThe cited source says what the claim attributes to it.
In the citing paper
“experiments in which the genetically identified V1 neurons are ablated suggest a role in controlling swim vigor (Kimura and Higashijima, 2019).”
From Modeling spinal locomotor circuits for movements in developing zebrafish (2021) · cites this paper as Kimura and Higashijima, 2019
The cited source says what the claim attributes to it.
In the citing paper
“The circuits for frequency and vigor are likely to interact, as seen by the swimming frequency-dependent action of V1 neurons (Kimura and Higashijima, 2019).”
From Modeling spinal locomotor circuits for movements in developing zebrafish (2021) · cites this paper as Kimura and Higashijima, 2019
The check wasn’t confident either way, so it gives no verdict — never disputed.
In the citing paper
“Most spinal neurons at larval stages exhibit either tonic firing or firing with spike rate adaptation (Kimura and Higashijima, 2019; Menelaou and McLean, 2012; Menelaou and McLean, 2019; Satou et al., 2020), while a subset of MNs showing intrinsic burst firing (Menelaou and McLean, 2012).”
From Modeling spinal locomotor circuits for movements in developing zebrafish (2021) · cites this paper as Kimura and Higashijima, 2019
Experimental — accuracy not yet measured
Self-check
Percentages, sums and reported differences re-computed from the paper’s own numbers.
The self-check needs the paper’s full text.
Citations
Cites
Circuits controlling vertebrate locomotion: moving in a new direction
Goulding, M. (2009) · Nature Reviews Neuroscience · doi:10.1038/nrn2608 · Cited by 777
Decoding the organization of spinal circuits that control locomotion
Kiehn, O. (2016) · Nature Reviews Neuroscience · doi:10.1038/nrn.2016.9 · Cited by 742
V1 spinal neurons regulate the speed of vertebrate locomotor outputs
Gosgnach, S., Lanuza, G. M., Butt, S. J. B., Saueressig, H., Zhang, Y., Velasquez, T., Riethmacher, D., Callaway, E. M., Kiehn, O., & Goulding, M. (2006) · Nature · doi:10.1038/nature04545 · Cited by 405
Kimura, Y., Okamura, Y., & Higashijima, S.-I. (2006) · The Journal of Neuroscience · doi:10.1523/jneurosci.4993-05.2006 · Cited by 302
Self-citationHindbrain V2a neurons in the excitation of spinal locomotor circuits during zebrafish swimming
Kimura, Y., Satou, C., Fujioka, S., Shoji, W., Umeda, K., Ishizuka, T., Yawo, H., & Higashijima, S.-I. (2013) · Current Biology · doi:10.1016/j.cub.2013.03.066 · Cited by 186
Self-citationMotor unit recruitment for dynamic tasks: current understanding and future directions
Hodson-Tole, E. F., & Wakeling, J. M. (2009) · Journal of Comparative Physiology B · doi:10.1007/s00360-008-0289-1 · Cited by 145
Menelaou, E., & McLean, D. L. (2012) · The Journal of Neuroscience · doi:10.1523/jneurosci.1809-12.2012 · Cited by 116
Pujala, A., & Koyama, M. (2019) · eLife · doi:10.7554/elife.42135 · Cited by 80
Research works printed but not linked: 40
- Cope, T. C. & Sokoloff, A. J. Orderly recruitment among motoneurons supplying different muscles. J. Physiol. Paris 93, 81–85 (1999). · DOI
- Henneman, E., Somjen, G. & Carpenter, D. O. Functional significance of cell size in spinal motoneurons. J. Neurophysiol. 28, 560–580 (1965). · DOI · Paper page
- Mendell, L. M. The size principle: a rule describing the recruitment of motoneurons. J. Neurophysiol. 93, 3024–3026 (2005). · DOI
- Powers, R. K. & Binder, M. D. Input-output functions of mammalian motoneurons. Rev. Physiol. Biochem. Pharm. 143, 137–263 (2001). · DOI
- Zajac, F. E. & Faden, J. S. Relationship among recruitment order, axonal conduction velocity, and muscle-unit properties of type-identified motor units in cat plantaris muscle. J. Neurophysiol. 53, 1303–1322 (1985). · DOI
- Liu, D. W. & Westerfield, M. Function of identified motoneurones and coordination of primary and secondary motor systems during zebra fish swimming. J. Physiol.-Lond. 403, 73–89 (1988). · DOI · Paper page
- McLean, D. L., Fan, J., Higashijima, S., Hale, M. E. & Fetcho, J. R. A topographic map of recruitment in spinal cord. Nature 446, 71–75 (2007). · DOI · Paper page
- Kishore, S., Bagnall, M. W. & McLean, D. L. Systematic shifts in the balance of excitation and inhibition coordinate the activity of axial motor pools at different speeds of locomotion. J. Neurosci. 34, 14046–14054 (2014). · DOI
- McLean, D. L., Masino, M. A., Koh, I. Y., Lindquist, W. B. & Fetcho, J. R. Continuous shifts in the active set of spinal interneurons during changes in locomotor speed. Nat. Neurosci. 11, 1419–1429 (2008). · DOI · Paper page
- Jayne, B. C. & Lauder, G. V. How swimming fish use slow and fast muscle fibers: implications for models of vertebrate muscle recruitment. J. Comp. Physiol. A 175, 123–131 (1994). · DOI
- Song, J., Ampatzis, K., Ausborn, J. & El Manira, A. A hardwired circuit supplemented with endocannabinoids encodes behavioral choice in zebrafish. Curr. Biol. 25, 2610–2620 (2015). · DOI
- Tsukamoto, K. Contribution of the red and white muscles to the power output required for swimming by the yellowtail. Bull. Jpn. Soc. Sci. Fish. 50, 2031–2042 (1984). · DOI
- Blake, O. M. & Wakeling, J. M. Early deactivation of slower muscle fibres at high movement frequencies. J. Exp. Biol. 217, 3528–3534 (2014). · DOI
- Citterio, G. & Agostoni, E. Selective activation of quadriceps muscle fibers according to bicycling rate. J. Appl. Physiol. Respir. Environ. Exerc. Physiol. 57, 371–379 (1984).
- Grimby, L. & Hannerz, J. Firing rate and recruitment order of toe extensor motor units in different modes of voluntary conraction. J. Physiol. 264, 865–879 (1977). · DOI · Paper page
- Hodson-Tole, E. F. & Wakeling, J. M. Motor unit recruitment patterns 1: responses to changes in locomotor velocity and incline. J. Exp. Biol. 211, 1882–1892 (2008). · DOI
- Lee, S. S. et al. Recruitment of faster motor units is associated with greater rates of fascicle strain and rapid changes in muscle force during locomotion. J. Exp. Biol. 216, 198–207 (2013). · DOI
- Alaynick, W. A., Jessell, T. M. & Pfaff, S. L. SnapShot: spinal cord development. Cell 146, 178–178 e171 (2011). · DOI · Paper page
- Goulding, M. & Pfaff, S. L. Development of circuits that generate simple rhythmic behaviors in vertebrates. Curr. Opin. Neurobiol. 15, 14–20 (2005). · DOI
- Alvarez, F. J. et al. Postnatal phenotype and localization of spinal cord V1 derived interneurons. J. Comp. Neurol. 493, 177–192 (2005). · DOI · Paper page
- Higashijima, S., Masino, M. A., Mandel, G. & Fetcho, J. R. Engrailed-1 expression marks a primitive class of inhibitory spinal interneuron. J. Neurosci. 24, 5827–5839 (2004). · DOI
- Li, W. C., Higashijima, S., Parry, D. M., Roberts, A. & Soffe, S. R. Primitive roles for inhibitory interneurons in developing frog spinal cord. J. Neurosci. 24, 5840–5848 (2004). · DOI
- Saueressig, H., Burrill, J. & Goulding, M. Engrailed-1 and netrin-1 regulate axon pathfinding by association interneurons that project to motor neurons. Development 126, 4201–4212 (1999). · DOI
- Kimura, Y., Hisano, Y., Kawahara, A. & Higashijima, S.-i Efficient generation of knock-in transgenic zebrafish carrying reporter/driver genes by CRISPR/Cas9-mediated genome engineering. Sci. Rep. 4, 6545 (2014). · DOI
- Ampatzis, K., Song, J., Ausborn, J. & El Manira, A. Pattern of innervation and recruitment of different classes of motoneurons in adult zebrafish. J. Neurosci. 33, 10875–10886 (2013). · DOI · Paper page
- Ampatzis, K., Song, J., Ausborn, J. & El Manira, A. Separate microcircuit modules of distinct v2a interneurons and motoneurons control the speed of locomotion. Neuron 83, 934–943 (2014). · DOI · Paper page
- McLean, D. L. & Fetcho, J. R. Spinal interneurons differentiate sequentially from those driving the fastest swimming movements in larval zebrafish to those driving the slowest ones. J. Neurosci. 29, 13566–13577 (2009). · DOI
- Eklof-Ljunggren, E. et al. Origin of excitation underlying locomotion in the spinal circuit of zebrafish. Proc. Natl. Acad. Sci. USA 109, 5511–5516 (2012). · DOI · Paper page
- Menelaou, E., VanDunk, C. & McLean, D. L. Differences in the morphology of spinal V2a neurons reflect their recruitment order during swimming in larval zebrafish. J. Comp. Neurol. 522, 1232–1248 (2014). · DOI
- Buss, R. R. & Drapeau, P. Activation of embryonic red and white muscle fibers during fictive swimming in the developing zebrafish. J. Neurophysiol. 87, 1244–1251 (2002). · DOI
- Roberts, A., Li, W. C. & Soffe, S. R. Roles for inhibition: studies on networks controlling swimming in young frog tadpoles. J. Comp. Physiol. A. 194, 185–193 (2008). · DOI
- Song, J., Ampatzis, K., Bjornfors, E. R. & El Manira, A. Motor neurons control locomotor circuit function retrogradely via gap junctions. Nature 529, 399–402 (2016). · DOI
- Luna, V. M., Daikoku, E. & Ono, F. “Slow” skeletal muscles across vertebrate species. Cell Biosci. 5, 62 (2015). · DOI
- Smith, J. L., Betts, B., Edgerton, V. R. & Zernicke, R. F. Rapid ankle extension during paw shakes: selective recruitment of fast ankle extensors. J. Neurophysiol. 43, 612–620 (1980). · DOI
- Friedman, W. A., Sypert, G. W., Munson, J. B. & Fleshman, J. W. Recurrent inhibition in type-identified motoneurons. J. Neurophysiol. 46, 1349–1359 (1981). · DOI
- Asakawa, K., Abe, G. & Kawakami, K. Cellular dissection of the spinal cord motor column by BAC transgenesis and gene trapping in zebrafish. Front Neural Circuits 7, 100 (2013). · DOI
- Satou, C., Kimura, Y. & Higashijima, S. Generation of multiple classes of V0 neurons in zebrafish spinal cord: progenitor heterogeneity and temporal control of neuronal diversity. J. Neurosci. 32, 1771–1783 (2012). · DOI
- Urasaki, A., Morvan, G. & Kawakami, K. Functional dissection of the Tol2 transposable element identified the minimal cis-sequence and a highly repetitive sequence in the subterminal region essential for transposition. Genetics 174, 639–649 (2006). · DOI
- Satou, C. et al. Functional role of a specialized class of spinal commissural inhibitory neurons during fast escapes in zebrafish. J. Neurosci. 29, 6780–6793 (2009). · DOI
- Houweling, A. R., Doron, G., Voigt, B. C., Herfst, L. J. & Brecht, M. Nanostimulation: manipulation of single neuron activity by juxtacellular current injection. J. Neurophysiol. 103, 1696–1704 (2010). · DOI
Cited by
Sorted by citations
Song, J., Pallucchi, I., Ausborn, J., Ampatzis, K., Bertuzzi, M., Fontanel, P., Picton, L. D., & El Manira, A. (2020) · Neuron · doi:10.1016/j.neuron.2019.12.030 · Cited by 84
Modeling spinal locomotor circuits for movements in developing zebrafish
Roussel, Y., Gaudreau, S. F., Kacer, E. R., Sengupta, M., & Bui, T. V. (2021) · eLife · doi:10.7554/elife.67453 · Cited by 39
Spinal V1 neurons inhibit motor targets locally and sensory targets distally
Sengupta, M., Daliparthi, V., Roussel, Y., Bui, T. V., & Bagnall, M. W. (2021) · Current Biology · doi:10.1016/j.cub.2021.06.053 · Cited by 30
Computational modeling of speed microcircuits in larval zebrafish spinal cord with Sili Fish
Topcu, E., & Bui, T. V. (2025) · Journal of Neurophysiology · doi:10.1152/jn.00393.2024
Metadata
- Authors
- Kimura, Y., & Higashijima, S.-I.
- Affiliations
- National Institute for Basic Biology (JP)
- Corresponding author
- Higashijima, Shin-ichi
- Venue
- Nature Communications
- Published
- 2019-05-22
- Volume
- 10
- Issue
- 1
- Pages
- 2268-2268
- ISSN
- 2041-1723 (ISSN-L)
- PMC
- PMC6531463
- OpenAlex
- W2945632060
- Cited by
- 60
- References
- 8
- Citations by year
- 2026: 4 · 2025: 13 · 2024: 8 · 2023: 6 · 2022: 8 · 2021: 8 · 2020: 11 · 2019: 2
- FWCI
- 3.84
- Type
- journal article
- Language
- en
- Open access
- gold
- doi.org
- Locations
- Nature Communications (publishedVersion, cc-by)
- Europe PMC (PubMed Central) (publishedVersion, cc-by)
- PubMed Central (publishedVersion, cc-by)
- PubMed (publishedVersion)
- RePEc: Research Papers in Economics (submittedVersion)
- DOAJ (DOAJ: Directory of Open Access Journals) (submittedVersion, cc-by-sa)
- DOAJ (DOAJ: Directory of Open Access Journals) (submittedVersion)
- Funders
- Ministry of Education, Culture, Sports, Science and Technology
- Japan Society for the Promotion of Science (16K07022, 19K06897)
- Topics
- Life Sciences › Biochemistry, Genetics and Molecular Biology › Cell Biology › Zebrafish Biomedical Research Applications
- Life Sciences › Neuroscience › Cellular and Molecular Neuroscience › Neuroscience and Neuropharmacology Research
- Life Sciences › Neuroscience › Cognitive Neuroscience › Motor Control and Adaptation
- Keywords
- V1 neurons, swimming, slow motor units, neuronal silencing, zebrafish larvae, motor neuron inhibition
- MeSH terms
- Animals, Anterior Horn Cells, Embryo, Nonmammalian, Larva, Swimming, Zebrafish, Models, Animal, Animals, Genetically Modified, Renshaw Cells
About these checks
Registry, retraction, Cites and statistics results are computed, not judged, with one exception: a printed reference that no index lists is read once by a model before it counts as a citation error. Claims are extracted by a model and kept only when their quote appears verbatim in the text; each cited source is then checked, with a model’s help, for whether it says what the claim relies on. Those verdicts can be wrong — read the claim’s quote and the cited source before relying on one.
Statistics and arithmetic are recomputed, not judged.
Confidence bands are shown only for fields calibrated on our annotated test set. None is calibrated yet, so no band is shown.
What counts as a claim ›How we measure confidence ›How we check this ›
Are you an author, or do you see a problem with this page? Request a review
