CoChat

Microclot array elastometry for integrated measurement of thrombus formation and clot biomechanics under fluid shear

Open access

The DOI matches its Crossref record; 51 of the 52 references it cites were found in a registry or an index.

Abstract

Blood clotting at the vascular injury site is a complex process that involves platelet adhesion and clot stiffening/contraction in the milieu of fluid flow. An integrated understanding of the hemodynamics and tissue mechanics regulating this process is currently lacking due to the absence of an experimental system that can simultaneously model clot formation and measure clot mechanics under shear flow. Here we develop a microfluidic-integrated microclot-array-elastometry system (clotMAT) that recapitulates dynamic changes in clot mechanics under physiological shear. Treatments with procoagulants and platelet antagonists and studies with diseased patient plasma demonstrate the ability of the system to assay clot biomechanics associated with common antiplatelet treatments and bleeding disorders. The changes of clot mechanics under biochemical treatments and shear flow demonstrate independent yet equally strong effects of these two stimulants on clot stiffening. This microtissue force sensing system may have future research and diagnostic potential for various bleeding disorders.

Overview

The claims and statistics of this paper haven’t been checked yet.

Free: it reads the open-access text and checks the first 5 claims that cite a source we can check. Create a free account to check every claim.

A few free checks a day · papers already verified open instantly · results are public

Integrity signals

Registry

Crossref · 10.1038/s41467-019-10067-6

Cites

51 of 51 references verified0 citation errors · 0 not checkable

Statistics

Figures

Fig. 1 clotMAT system setup and microclot array formation under platelet flow. a clotMAT system contains a top microfluidic channel layer, a middle PDMS substrate containing the microtissue array and a bottom stretchable membrane. An array of exposed collagen microtissues capture flowing platelets to form individual microclots. b Schematic diagram shows microclot formation process and the principles of mechanical property measurement. Microclot contractile force is measured by micropillar deflection and stiffness is measured by substrate stretching-enabled tensile testing. A region of the microtissue array shown by bright field image (c), and immunofluorescence staining of the collagen (d) and adhered platelets (e) in the same region. Scale bar is 800 µm. Note that the platelet flow ran through the middle row of the collagen microtissue array, resulting in the adhesion of fluorescent-labeled platelets (green) only in this row. f SEM image of a microclot formed between the heads of a pair of micropillars. Obvious micropillar deflection is noticeable. Scale bar is 200 µm. g Zoom-in view of the microclot surface shows numerous platelets trapped in a fibrin meshwork. Scale bar is 10 µm. Inset shows activated single platelets. Scale bar is 2 µm. PDMS poly(dimethylsiloxane), SEM scanning electron microscopy
Fig. 1 clotMAT system setup and microclot array formation under platelet flow. a clotMAT system contains a top microfluidic channel layer, a middle PDMS substrate containing the microtissue array and a bottom stretchable membrane. An array of exposed collagen microtissues capture flowing platelets to form individual microclots. b Schematic diagram shows microclot formation process and the principles of mechanical property measurement. Microclot contractile force is measured by micropillar deflection and stiffness is measured by substrate stretching-enabled tensile testing. A region of the microtissue array shown by bright field image (c), and immunofluorescence staining of the collagen (d) and adhered platelets (e) in the same region. Scale bar is 800 µm. Note that the platelet flow ran through the middle row of the collagen microtissue array, resulting in the adhesion of fluorescent-labeled platelets (green) only in this row. f SEM image of a microclot formed between the heads of a pair of micropillars. Obvious micropillar deflection is noticeable. Scale bar is 200 µm. g Zoom-in view of the microclot surface shows numerous platelets trapped in a fibrin meshwork. Scale bar is 10 µm. Inset shows activated single platelets. Scale bar is 2 µm. PDMS poly(dimethylsiloxane), SEM scanning electron microscopyCC BY · PubMed Central
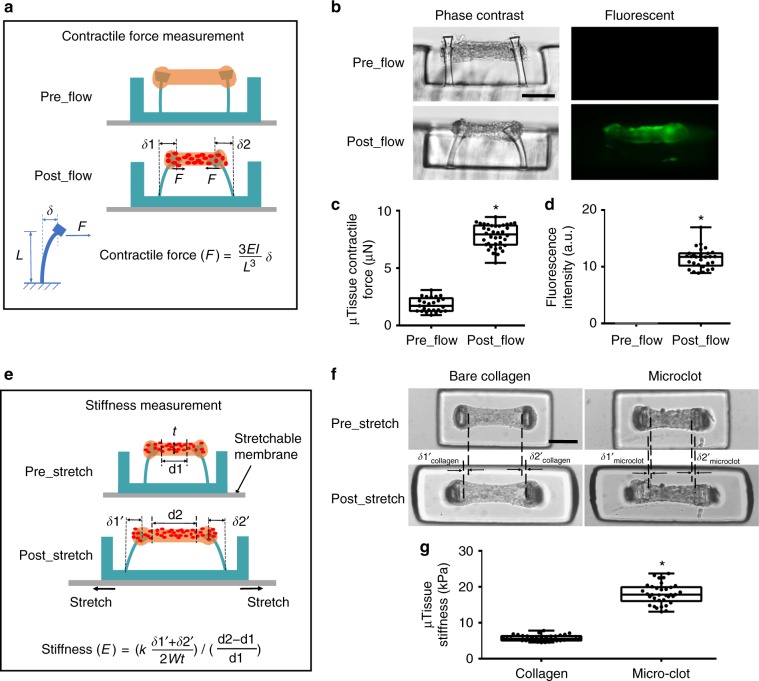
Fig. 2 Measurement of clot contraction and stiffening in the microclot array. Schematic diagram (a) and phase contrast and fluorescence (b) sideview images of a microtissue before and after platelet-mediated contraction. Micropillar deflection (δ1 and δ2) can be easily detected after platelet adhesion and activation (postflow), which was used to calculate microclot-generated contractile force. Comparison of microtissue contractile force (c) and fluorescence intensity (d) before and after platelet flow. e Schematic diagram of microtissues before and after externally applied stretching. Mechanical stretching caused microtissue elongation (d2–d1), which was used to calculate tensile strain; the force needed to develop such elongation was reported by micropillar deflection as F = k(δ1′ + δ2′)/2 which was used to calculate the tensile stress. Microtissue stiffness was determined based on stress−strain relationship. f Comparison of tissue elongation between a microclot and a bare collagen microtissue under the same amount of substrate stretch. g Comparison of the stiffness between microclots and bare collagen microtissues. *P < 0.001, n > 10, each dot in box plot represents an independent experiment. All box plots with whiskers represent the data distribution based on five number summary (maximum, third quartile, median, first quartile, minimum). Statistical significance was determined by unpaired t test with Welch’s correction method. Scale bar is 200 µm
Fig. 2 Measurement of clot contraction and stiffening in the microclot array. Schematic diagram (a) and phase contrast and fluorescence (b) sideview images of a microtissue before and after platelet-mediated contraction. Micropillar deflection (δ1 and δ2) can be easily detected after platelet adhesion and activation (postflow), which was used to calculate microclot-generated contractile force. Comparison of microtissue contractile force (c) and fluorescence intensity (d) before and after platelet flow. e Schematic diagram of microtissues before and after externally applied stretching. Mechanical stretching caused microtissue elongation (d2–d1), which was used to calculate tensile strain; the force needed to develop such elongation was reported by micropillar deflection as F = k(δ1′ + δ2′)/2 which was used to calculate the tensile stress. Microtissue stiffness was determined based on stress−strain relationship. f Comparison of tissue elongation between a microclot and a bare collagen microtissue under the same amount of substrate stretch. g Comparison of the stiffness between microclots and bare collagen microtissues. *P < 0.001, n > 10, each dot in box plot represents an independent experiment. All box plots with whiskers represent the data distribution based on five number summary (maximum, third quartile, median, first quartile, minimum). Statistical significance was determined by unpaired t test with Welch’s correction method. Scale bar is 200 µmCC BY · PubMed Central
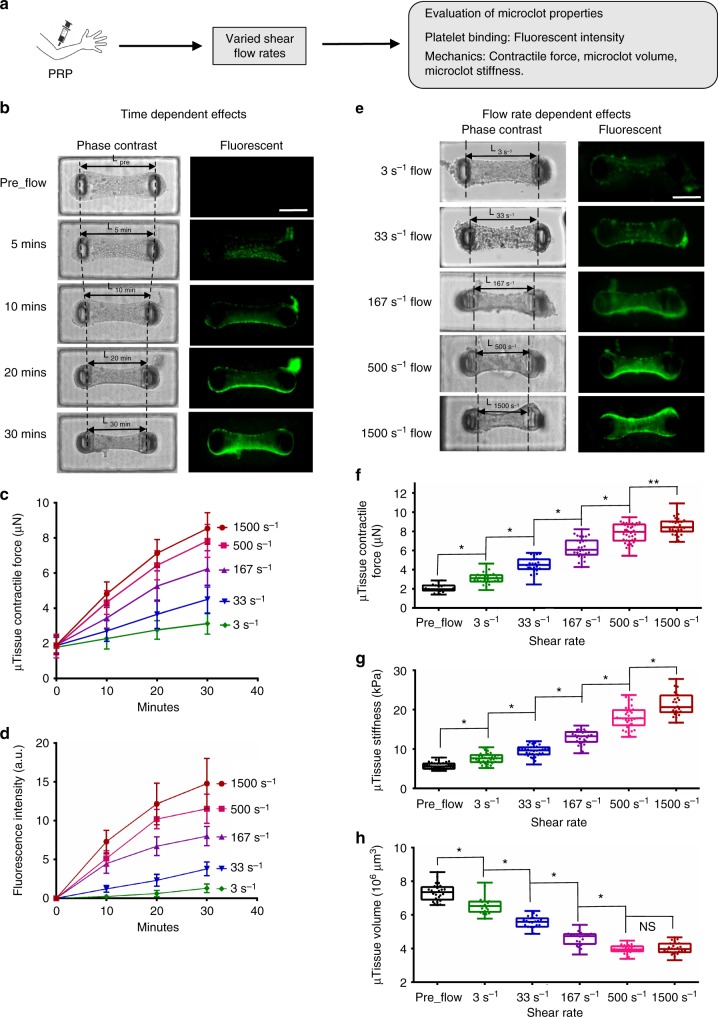
Fig. 3 Microclot mechanics under various shear flow conditions. a Overview of the approach for evaluating microclot mechanics under various shear flow conditions. b Time-lapsed phase contrast and fluorescence images of a microclot formed under 167 s−1 shear rate. The number of adhered platelets and microclot contraction gradually increased over a 30-min period, as demonstrated by gradually increased microtissue fluorescence intensity and decreased micropillar distance (L). Measured microclot contractile force (c), fluorescence intensity (d) over the 30-min time period for 3, 33, 167, 500 and 1500 s−1 shear rates. e Phase contrast and fluorescence images of microclots formed after 30 min flow under different shear rates. Increased shear rate leads to increased level of platelet adhesion and microclot contraction, as demonstrated by increased microtissue fluorescence intensity and decreased micropillar distance (L) from shear rate 3 to 1500 s−1. Measured contractile force (f), stiffness (g) and volume (h) of microclots formed at 30 min under different shear rates. Data are presented as mean ± standard deviation for (c), (d). *P < 0.005, **P < 0.05, n > 10, each dot in box plot represents an independent experiment. All box plots with whiskers represent the data distribution based on five number summary (maximum, third quartile, median, first quartile, minimum). Statistical significance was determined by one-way analysis of variance (ANOVA). Scale bar is 200 µm
Fig. 3 Microclot mechanics under various shear flow conditions. a Overview of the approach for evaluating microclot mechanics under various shear flow conditions. b Time-lapsed phase contrast and fluorescence images of a microclot formed under 167 s−1 shear rate. The number of adhered platelets and microclot contraction gradually increased over a 30-min period, as demonstrated by gradually increased microtissue fluorescence intensity and decreased micropillar distance (L). Measured microclot contractile force (c), fluorescence intensity (d) over the 30-min time period for 3, 33, 167, 500 and 1500 s−1 shear rates. e Phase contrast and fluorescence images of microclots formed after 30 min flow under different shear rates. Increased shear rate leads to increased level of platelet adhesion and microclot contraction, as demonstrated by increased microtissue fluorescence intensity and decreased micropillar distance (L) from shear rate 3 to 1500 s−1. Measured contractile force (f), stiffness (g) and volume (h) of microclots formed at 30 min under different shear rates. Data are presented as mean ± standard deviation for (c), (d). *P < 0.005, **P < 0.05, n > 10, each dot in box plot represents an independent experiment. All box plots with whiskers represent the data distribution based on five number summary (maximum, third quartile, median, first quartile, minimum). Statistical significance was determined by one-way analysis of variance (ANOVA). Scale bar is 200 µmCC BY · PubMed Central
Fig. 4 Microclot mechanics under platelet agonist and antagonist treatments. a Overview of the approaches. b Phase contrast and fluorescence images of microclots after 10 μM ADP or 5 U mL−1 thrombin treatment under flow. These microclots were first formed over 30 min of 500 s−1 platelet flow prior to agonist introduction for an additional 10 min. Measured contractile force (c), stiffness (d) and volume (e) of microclots after various procoagulation treatments. f Phase contrast and fluorescence images of microtissues formed after 30 min of 500 or 1500 s−1 platelet flow treated with blebbistatin, acetylsalicyclic acid (ASA), abciximab (anti GPIIb/IIIa) or HIP1 (anti-GpIbα) antibody. Measured fluorescence intensity (g), contractile force (h), stiffness (i) and volume (j) of microtissues formed under above anticoagulation treatments. **P < 0.05, *P < 0.005, n > 10, each dot in box plot represents an independent experiment. All box plots with whiskers represent the data distribution based on five number summary (maximum, third quartile, median, first quartile, minimum). Statistical significance was determined by one-way analysis of variance (ANOVA). Scale bar is 200 µm
Fig. 4 Microclot mechanics under platelet agonist and antagonist treatments. a Overview of the approaches. b Phase contrast and fluorescence images of microclots after 10 μM ADP or 5 U mL−1 thrombin treatment under flow. These microclots were first formed over 30 min of 500 s−1 platelet flow prior to agonist introduction for an additional 10 min. Measured contractile force (c), stiffness (d) and volume (e) of microclots after various procoagulation treatments. f Phase contrast and fluorescence images of microtissues formed after 30 min of 500 or 1500 s−1 platelet flow treated with blebbistatin, acetylsalicyclic acid (ASA), abciximab (anti GPIIb/IIIa) or HIP1 (anti-GpIbα) antibody. Measured fluorescence intensity (g), contractile force (h), stiffness (i) and volume (j) of microtissues formed under above anticoagulation treatments. **P < 0.05, *P < 0.005, n > 10, each dot in box plot represents an independent experiment. All box plots with whiskers represent the data distribution based on five number summary (maximum, third quartile, median, first quartile, minimum). Statistical significance was determined by one-way analysis of variance (ANOVA). Scale bar is 200 µmCC BY · PubMed Central
Fig. 5 VWD patient sample results in mechanically weak microclots. a Overview of the strategy for comparing microclot mechanics between VWD sample and healthy donor sample. Healthy human washed platelets were added to VWD patient plasma and healthy donor plasma to form reconstituted VWD PRP (rVWD PRP) and reconstituted healthy PRP (rHealthy PRP). The mechanical properties of microclots formed using these reconstituted systems was compared with “Healthy PRP”, normal PRP isolated from healthy volunteer. b Phase contrast and fluorescence images of microclots formed using VWD patient sample and healthy donor sample. Measured fluorescence intensity (c), contractile force (d), stiffness (e) and volume (f) of the above two microclot groups. *P < 0.05, n > 10, each dot in box plot represents an independent experiment. All box plots with whiskers represent the data distribution based on five number summary (maximum, third quartile, median, first quartile, minimum). Statistical significance was determined by one-way analysis of variance (ANOVA)
Fig. 5 VWD patient sample results in mechanically weak microclots. a Overview of the strategy for comparing microclot mechanics between VWD sample and healthy donor sample. Healthy human washed platelets were added to VWD patient plasma and healthy donor plasma to form reconstituted VWD PRP (rVWD PRP) and reconstituted healthy PRP (rHealthy PRP). The mechanical properties of microclots formed using these reconstituted systems was compared with “Healthy PRP”, normal PRP isolated from healthy volunteer. b Phase contrast and fluorescence images of microclots formed using VWD patient sample and healthy donor sample. Measured fluorescence intensity (c), contractile force (d), stiffness (e) and volume (f) of the above two microclot groups. *P < 0.05, n > 10, each dot in box plot represents an independent experiment. All box plots with whiskers represent the data distribution based on five number summary (maximum, third quartile, median, first quartile, minimum). Statistical significance was determined by one-way analysis of variance (ANOVA)CC BY · PubMed Central
Fig. 6 Effects of biochemical treatment and shear flow on clot stiffening. Strong correlation between microclot stiffness and microclot contractile force (a) and between microclot volume and microclot contractile force (b) exists for various coagulation conditions under biochemical treatments. Abciximab (Abci.), Blebbistatin (Bleb.), VWD (VWD patient sample), acetylsalicyclic acid (ASA), anti-GpIbα antibody (HIP1). c, d Comparison of linear regressions between biochemical treatment condition and shear flow condition. Strong correlation between microclot mechanical properties also exists under varied shear flow (solid, black line). No significant difference was found for the regression slopes between biochemical treatment condition and shear flow condition. The significant difference of slopes and intercepts for two linear regressions was measured using a method equivalent to analysis of covariance (ANCOVA). Correlation between groups was analyzed using Pearson correlation coefficients. e Finite element model of the microclot before and under platelet-generated contraction. Simulated effective stress contour is plotted over undeformed and deformed model geometry. Active contraction of platelet population is represented by the contractility of every single element. Due to the geometrical restriction by two micropillars at both ends, microclot contraction causes volume shrinkage and the development of necking in the middle section, mimicking the microclot retraction process observed in the experiment. Color scale indicates normalized effective stress level. f Simulated decrease in microclot volume almost linearly correlates with increased contractile stress, recapitulating the experimental correlation between these two measurements. Data are presented as mean ± standard deviation
Fig. 6 Effects of biochemical treatment and shear flow on clot stiffening. Strong correlation between microclot stiffness and microclot contractile force (a) and between microclot volume and microclot contractile force (b) exists for various coagulation conditions under biochemical treatments. Abciximab (Abci.), Blebbistatin (Bleb.), VWD (VWD patient sample), acetylsalicyclic acid (ASA), anti-GpIbα antibody (HIP1). c, d Comparison of linear regressions between biochemical treatment condition and shear flow condition. Strong correlation between microclot mechanical properties also exists under varied shear flow (solid, black line). No significant difference was found for the regression slopes between biochemical treatment condition and shear flow condition. The significant difference of slopes and intercepts for two linear regressions was measured using a method equivalent to analysis of covariance (ANCOVA). Correlation between groups was analyzed using Pearson correlation coefficients. e Finite element model of the microclot before and under platelet-generated contraction. Simulated effective stress contour is plotted over undeformed and deformed model geometry. Active contraction of platelet population is represented by the contractility of every single element. Due to the geometrical restriction by two micropillars at both ends, microclot contraction causes volume shrinkage and the development of necking in the middle section, mimicking the microclot retraction process observed in the experiment. Color scale indicates normalized effective stress level. f Simulated decrease in microclot volume almost linearly correlates with increased contractile stress, recapitulating the experimental correlation between these two measurements. Data are presented as mean ± standard deviationCC BY · PubMed Central

Verification

Claims the paper makes

The claims and statistics of this paper haven’t been checked yet.

Free: it reads the open-access text and checks the first 5 claims that cite a source we can check. Create a free account to check every claim.

A few free checks a day · papers already verified open instantly · results are public

Claims other papers make about this one

Each is checked against this paper’s own text: does it say what the citing paper says it does?

Self-check

Percentages, sums and reported differences re-computed from the paper’s own numbers.

The self-check needs the paper’s full text.

Citations

Cites

Show all 51 references

Cited by

See all 64

Metadata

Authors
Chen, Z., Lu, J., Zhang, C., Hsia, I., Yu, X., Marecki, L., Marecki, E., Asmani, M., Jain, S., Neelamegham, S., & Zhao, R.
Affiliations
  • University at Buffalo, State University of New York (US)
  • Women & Children's Hospital of Buffalo (US)
Corresponding author
  • Neelamegham, Sriram
  • Zhao, Ruogang
Venue
Nature Communications
Published
2019-05-03
Volume
10
Issue
1
Pages
2051-2051
ISSN
2041-1723 (ISSN-L)
OpenAlex
W2943462406
Cited by
64
References
52
Citations by year
2026: 3 · 2025: 9 · 2024: 8 · 2023: 10 · 2022: 9 · 2021: 10 · 2020: 13 · 2019: 2
FWCI
6.25
Type
journal article
Language
en
Open access
Licence
Locations
  • Nature Communications (publishedVersion, cc-by)
  • PubMed Central (publishedVersion, cc-by)
  • PubMed (publishedVersion)
  • RePEc: Research Papers in Economics (submittedVersion)
  • DOAJ (DOAJ: Directory of Open Access Journals) (submittedVersion)
  • DOAJ (DOAJ: Directory of Open Access Journals) (submittedVersion, cc-by-sa)
Funders
U.S. Department of Health & Human Services | NIH | National Institute of Biomedical Imaging and Bioengineering (R01EB019411)
Topics
  • Health Sciences › Medicine › Hematology › Blood properties and coagulation
  • Health Sciences › Medicine › Hematology › Blood Coagulation and Thrombosis Mechanisms
  • Health Sciences › Medicine › Hematology › Platelet Disorders and Treatments
Keywords
coagulation, thrombus formation, elastometry, microfluidics, platelet adhesion, antiplatelet therapy, bleeding disorders, procoagulants, antiplatelet agents, patient plasma
MeSH terms
Blood Coagulation, Blood Platelets, Female, Hemorrhage, Humans, Male, Platelet Aggregation Inhibitors, Stress, Mechanical, Thrombelastography, Microfluidics, Tissue Array Analysis, von Willebrand Disease, Type 2, Human Umbilical Vein Endothelial Cells, Healthy Volunteers

About these checks

Registry, retraction, Cites and statistics results are computed, not judged, with one exception: a printed reference that no index lists is read once by a model before it counts as a citation error. Claims are extracted by a model and kept only when their quote appears verbatim in the text; each cited source is then checked, with a model’s help, for whether it says what the claim relies on. Those verdicts can be wrong — read the claim’s quote and the cited source before relying on one.

Statistics and arithmetic are recomputed, not judged.

Confidence bands are shown only for fields calibrated on our annotated test set. None is calibrated yet, so no band is shown.

What counts as a claim ›How we measure confidence ›How we check this ›

Are you an author, or do you see a problem with this page? Request a review

How to cite

Cite CoChat for the checks on this page, and the paper for its own findings.

This page
CoChat. (2026). Citation check: Microclot array elastometry for integrated measurement of thrombus formation and clot biomechanics under fluid shear. https://app.cochat.ai/papers/10.1038/s41467-019-10067-6
The paper
Chen, Z., Lu, J., Zhang, C., Hsia, I., Yu, X., Marecki, L., Marecki, E., Asmani, M., Jain, S., Neelamegham, S., & Zhao, R. (2019). Microclot array elastometry for integrated measurement of thrombus formation and clot biomechanics under fluid shear. Nature Communications. https://doi.org/10.1038/s41467-019-10067-6

Data sources

Bibliographic data: Semantic Scholar, OpenAlex, Crossref.

Contains information from the Semantic Scholar Academic Graph Datasets, made available under the ODC Attribution License (ODC-BY 1.0).

Semantic Scholar’s data is described in: Kinney, R., et al. (2023). The Semantic Scholar Open Data Platform. arXiv:2301.10140.