

The DOI matches its Crossref record; 71 of the 71 references it cites were found in a registry or an index; 3 of the 50 sources its claims cite were checked for support.
Sustained microglial depletion with CSF1R inhibitor impairs parenchymal plaque development in an Alzheimer’s disease model
Open accessAbstract
Many risk genes for the development of Alzheimer’s disease (AD) are exclusively or highly expressed in myeloid cells. Microglia are dependent on colony-stimulating factor 1 receptor (CSF1R) signaling for their survival. We designed and synthesized a highly selective brain-penetrant CSF1R inhibitor (PLX5622) allowing for extended and specific microglial elimination, preceding and during pathology development. We find that in the 5xFAD mouse model of AD, plaques fail to form in the parenchymal space following microglial depletion, except in areas containing surviving microglia. Instead, Aβ deposits in cortical blood vessels reminiscent of cerebral amyloid angiopathy. Altered gene expression in the 5xFAD hippocampus is also reversed by the absence of microglia. Transcriptional analyses of the residual plaque-forming microglia show they exhibit a disease-associated microglia profile. Collectively, we describe the structure, formulation, and efficacy of PLX5622, which allows for sustained microglial depletion and identify roles of microglia in initiating plaque pathogenesis.
Overview
AI snapshot
Written from the paper’s full text.
TL;DR
PLX5622, a selective brain-penetrant CSF1R inhibitor, allowed sustained microglial depletion in 5xFAD mice and prevented parenchymal plaque formation, shifting Aβ deposition to cortical blood vessels. Residual plaque-forming microglia showed a disease-associated profile, and microglial repopulation restored plaque pathology.
Key findings
- PLX5622 showed >20-fold selectivity over KIT and FLT3, ~20% brain penetrance, and 1200 ppm chow reduced microglia by 90% within 5 days; treatment achieved 97–100% microglial reduction over 24 weeks and >99% cortical elimination.
- In 5xFAD mice, microglial depletion prevented dense-core parenchymal plaques except near surviving microglia in thalamus, retrosplenial cortex, and subiculum; cortical Aβ instead deposited in blood vessels as cerebral amyloid angiopathy. Plaque volumes were ~30–40% smaller, subicular plaque number was reduced by 33%, and plaque-core ApoE was reduced ~50–70%.
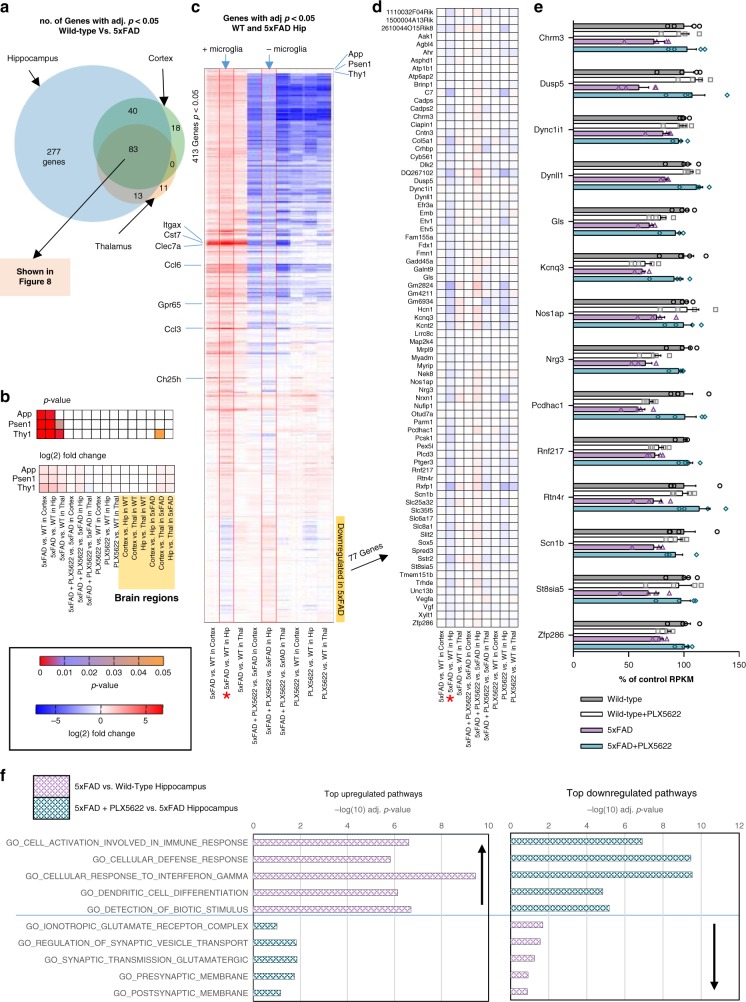
- Aβ38/40/42 levels and APP processing were unchanged, but hippocampal RNA-seq showed 413 differentially expressed genes in 5xFAD vs wild-type, including 77 downregulated synaptic/neuronal genes that were not downregulated when microglia were absent. Residual plaque-forming microglia expressed DAM markers such as Ccl6, Clec7a, Cst7, Ctsd, Ctsz, and Itgax.
- After PLX5622 withdrawal and microglial repopulation, plaque numbers in 5xFAD mice equaled untreated 5xFAD mice, though average plaque volumes remained smaller; vascular pathology persisted.
Methods
- Structure-guided design and synthesis of PLX5622 from PLX3397, with crystallography, kinase profiling, PK across mouse/rat/dog/monkey, and chow formulation.
- 5xFAD and 3xTg-AD mice; 5xFAD treatment began at 1.5 months for 10–24 weeks with groups Wild-type, PLX5622, 5xFAD, and 5xFAD + PLX5622 (n = 12/group, sex-balanced), plus behavioral, flow cytometry, histology, ELISA, immunoblot, and RNA-seq analyses (n = 4/group for RNA-seq).
- Human postmortem tissue from non-demented, high-pathology non-demented, and Alzheimer’s disease subjects was examined from middle frontal gyrus cortex.
Limitations
- The paper states no formal limitations section; it notes that no statistical methods were used to predetermine sample sizes and that data distribution was assumed normal but not formally tested.
- Evident from the text: findings rely on transgenic mouse models, and surviving microglia in thalamus, retrosplenial cortex, and subiculum complicate interpretation of region-specific plaque formation.
- Evident from the text: CAA and microbleeds appeared in microglia-depleted 5xFAD mice, and the long-term consequences of vascular Aβ deposition were not fully resolved.
Model-written summary. Check it against the paper before relying on it.
Integrity signals
Registry
Cites
Statistics
Figures
Verification
Claims the paper makes
91 Own result · 28 Own interpretation · 27 Not checked yet · 5 No basis given · 1 Supported
A result the paper reports from its own data — it cites no other source for it, so there is none to check. The quote shows it is in the paper.
In the paper
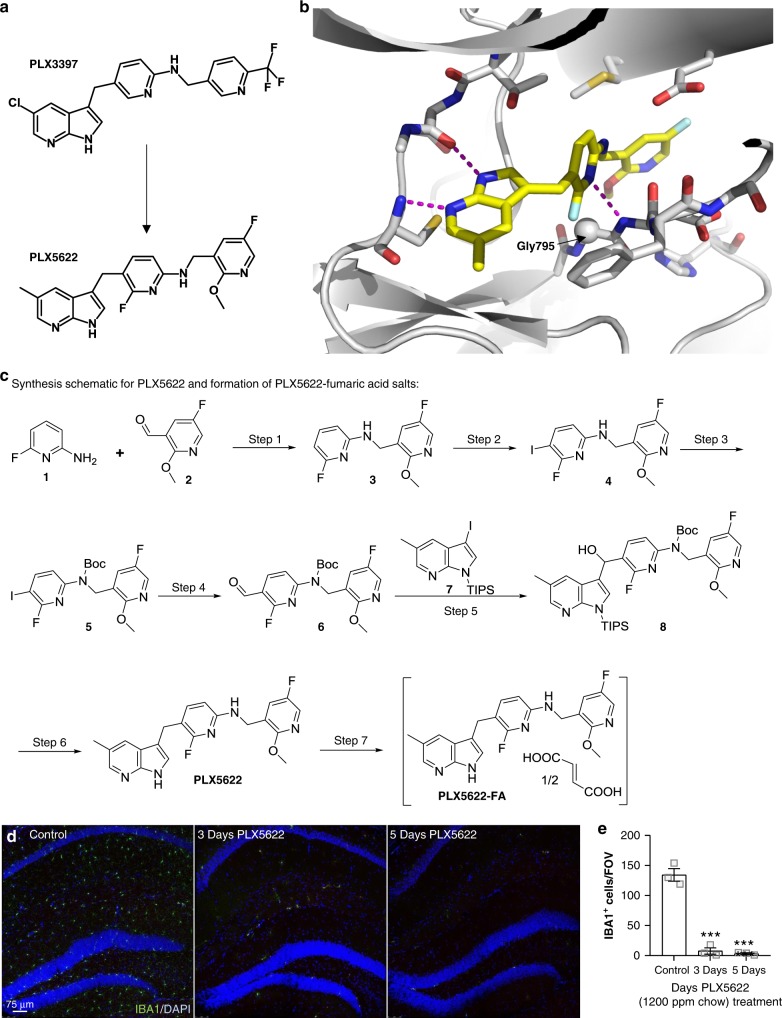
“PLX5622 was formulated in rodent chow, and administration to mice showed highly effective, causing a 90% reduction with 1200 ppm chow within 5 days of treatment (Fig. 2d, e).”
§ Sustained microglial depletion with CSF1R inhibitor impairs parenchymal plaque development in an Alzheimer’s disease model > Results > Development of a CSF1R inhibitor for microglial elimination
boosteddirect- Asserted: passes — The authors put it forward as true.
- Checkable: passes — It can be checked against evidence.
- Load-bearing: passes — The paper’s conclusions depend on it.
- Based: passes — The paper gives a reason why it holds.
A result the paper reports from its own data — it cites no other source for it, so there is none to check. The quote shows it is in the paper.
In the paper
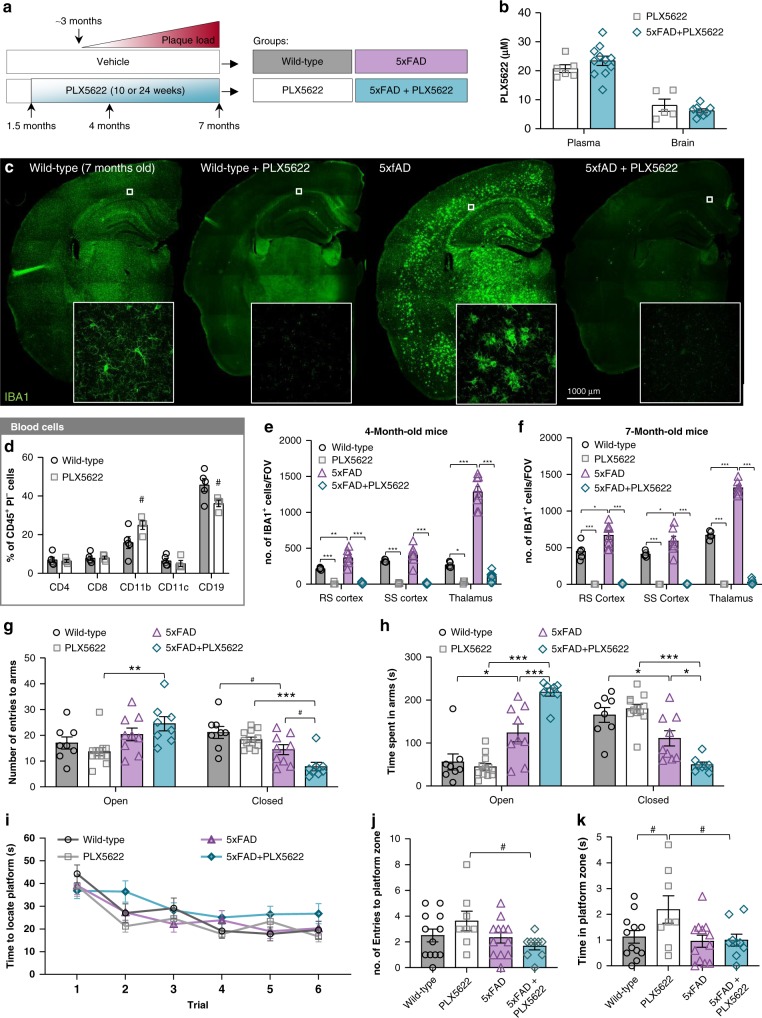
“Oral PLX5622 treatment led to almost complete microglial elimination (97–100% reduction; Fig. 3c and quantified in e and f), even with 24 weeks of treatment, showing that PLX5622 allows for extended elimination of microglia.”
§ Sustained microglial depletion with CSF1R inhibitor impairs parenchymal plaque development in an Alzheimer’s disease model > Results > Absence of abnormalities with microglial elimination
plaindirect- Asserted: passes — The authors put it forward as true.
- Checkable: passes — It can be checked against evidence.
- Load-bearing: passes — The paper’s conclusions depend on it.
- Based: passes — The paper gives a reason why it holds.
A result the paper reports from its own data — it cites no other source for it, so there is none to check. The quote shows it is in the paper.
In the paper
“Transcriptional analyses of the residual plaque-forming microglia show they exhibit a disease-associated microglia profile.”
§ Sustained microglial depletion with CSF1R inhibitor impairs parenchymal plaque development in an Alzheimer’s disease model > Abstract
plaincorrelational- Asserted: passes — The authors put it forward as true.
- Checkable: passes — It can be checked against evidence.
- Load-bearing: unclear — It is unclear whether the paper’s conclusions depend on it.
- Based: passes — The paper gives a reason why it holds.
A result the paper reports from its own data — it cites no other source for it, so there is none to check. The quote shows it is in the paper.
In the paper
“Cell free kinase inhibitor profiling revealed that PLX5622 is highly specific for the CSF1R, showing > 20-fold selectivity over KIT and FLT3, the two most homologous receptors (Supplementary Table 2, 3).”
§ Sustained microglial depletion with CSF1R inhibitor impairs parenchymal plaque development in an Alzheimer’s disease model > Results > Development of a CSF1R inhibitor for microglial elimination
plain- Asserted: passes — The authors put it forward as true.
- Checkable: passes — It can be checked against evidence.
- Load-bearing: passes — The paper’s conclusions depend on it.
- Based: passes — The paper gives a reason why it holds.
A result the paper reports from its own data — it cites no other source for it, so there is none to check. The quote shows it is in the paper.
In the paper
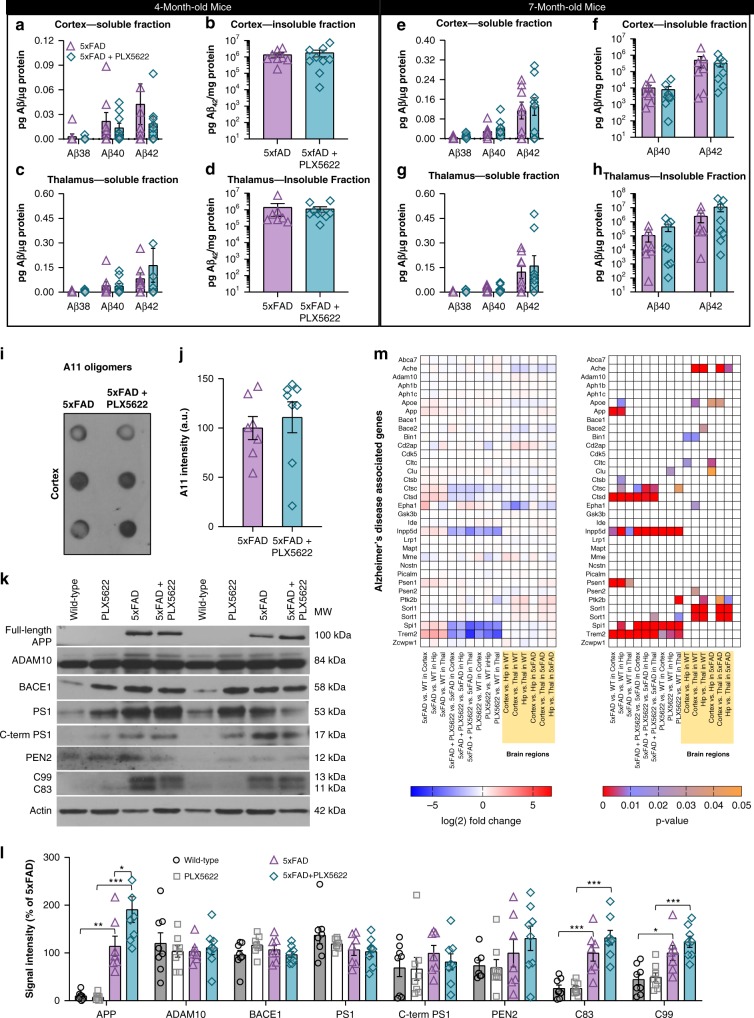
“We found significant elevations in full-length (fl) APP and Carboxy-terminal fragments of APP (C99 and C83) in 5xFAD mice relative to wild-type (Fig. 5k, l), but observed no reductions in protein levels with PLX5622 treatment in 5xFAD animals.”
§ Sustained microglial depletion with CSF1R inhibitor impairs parenchymal plaque development in an Alzheimer’s disease model > Results > Microglial elimination impairs plaque formation
plaincorrelational- Asserted: passes — The authors put it forward as true.
- Checkable: passes — It can be checked against evidence.
- Load-bearing: unclear — It is unclear whether the paper’s conclusions depend on it.
- Based: passes — The paper gives a reason why it holds.
A result the paper reports from its own data — it cites no other source for it, so there is none to check. The quote shows it is in the paper.
In the paper
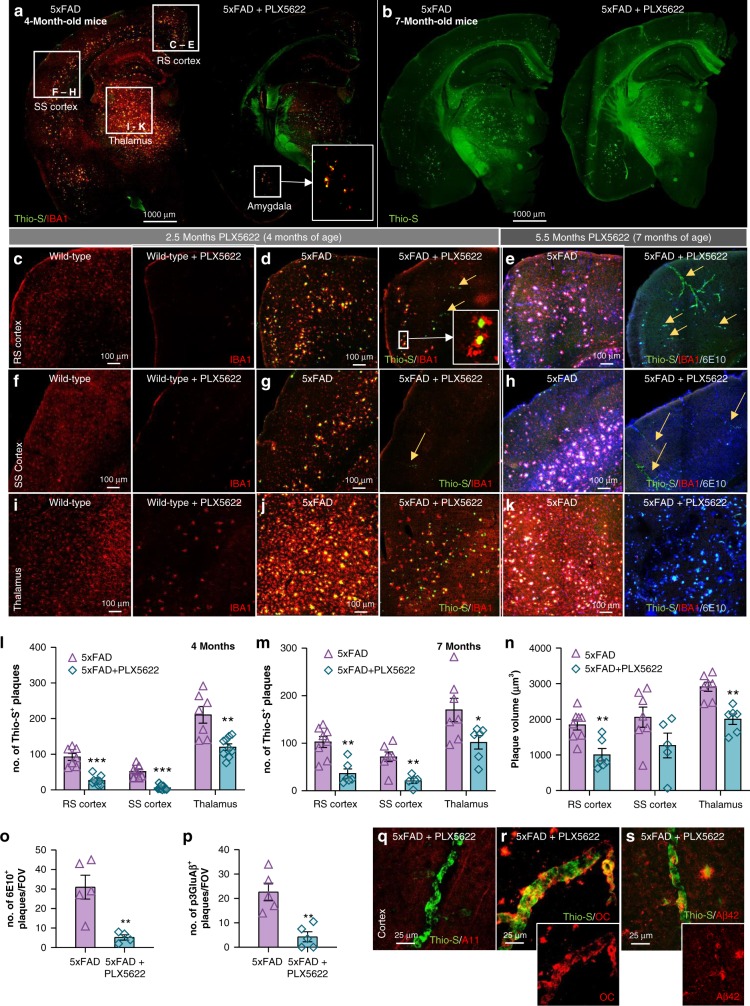
“Notably, a band of plaques were found in the RS cortex, but these were primarily associated with microglia that had survived treatment (Fig. 4d). Plaques were also formed within the thalamus but were again predominantly associated with surviving microglia (Fig. 4j).”
§ Sustained microglial depletion with CSF1R inhibitor impairs parenchymal plaque development in an Alzheimer’s disease model > Results > Microglial elimination impairs plaque formation
plaincorrelational- Asserted: passes — The authors put it forward as true.
- Checkable: passes — It can be checked against evidence.
- Load-bearing: passes — The paper’s conclusions depend on it.
- Based: passes — The paper gives a reason why it holds.
A result the paper reports from its own data — it cites no other source for it, so there is none to check. The quote shows it is in the paper.
In the paper
“Investigations into oligomeric species of Aβ (via A11 immunoblotting) found no significant changes in protein levels with microglia elimination in 5xFAD mice (Fig. 5i, j).”
§ Sustained microglial depletion with CSF1R inhibitor impairs parenchymal plaque development in an Alzheimer’s disease model > Results > Microglial elimination impairs plaque formation
plain- Asserted: passes — The authors put it forward as true.
- Checkable: passes — It can be checked against evidence.
- Load-bearing: unclear — It is unclear whether the paper’s conclusions depend on it.
- Based: passes — The paper gives a reason why it holds.
A result the paper reports from its own data — it cites no other source for it, so there is none to check. The quote shows it is in the paper.
In the paper
“Additionally, gene expression analyses of AD-related genes were performed (Fig. 5m; methods described in greater detail for Figs 8, 9) and we found minimal changes with microglia depletion, other than in microglial expressed genes (i.e., Trem2, Spi1, Inpp5d, and Ctsd).”
§ Sustained microglial depletion with CSF1R inhibitor impairs parenchymal plaque development in an Alzheimer’s disease model > Results > Microglial elimination impairs plaque formation
plain- Asserted: passes — The authors put it forward as true.
- Checkable: passes — It can be checked against evidence.
- Load-bearing: unclear — It is unclear whether the paper’s conclusions depend on it.
- Based: passes — The paper gives a reason why it holds.
In the paper
“Immunolabeling for the endothelial tight junction marker, Claudin-5, revealed an increase in Thio-S positive blood vessel diameter (Supplementary Figure 7I–K), consistent with prior data26, and reduced intensity of Claudin-5 staining in Aβ-associated blood vessels (Supplementary Figure 7L), suggesting impaired vascular integrity in the presence of Aβ pathology.”
§ Sustained microglial depletion with CSF1R inhibitor impairs parenchymal plaque development in an Alzheimer’s disease model > Results > Microglial elimination impairs plaque formation
What the sources say
- Not checked yetcites [26] Tian, J., Shi, J., Smallman, R., Iwatsubo, T. & Mann, D. M. Relationships in Alzheimer’s disease between the extent of Abeta deposition in cerebral blood vessel walls, as cerebral amyloid angiopathy, and the amount of cerebrovascular smooth muscle cells and collagen. Neuropathol. Appl Neurobiol. 32, 332–340 (2006). source
plaindirect- Asserted: passes — The authors put it forward as true.
- Checkable: passes — It can be checked against evidence.
- Load-bearing: unclear — It is unclear whether the paper’s conclusions depend on it.
- Based: passes — The paper gives a reason why it holds.
A result the paper reports from its own data — it cites no other source for it, so there is none to check. The quote shows it is in the paper.
In the paper
“Staining for pyroglutamate-3 Aβ, which forms the plaque cores23, revealed a sharp reduction in immunoreactivity in PLX5622-treated 5xFAD mice in the cortex (Fig. 4p; Supplementary Figure 6G–H), along with reductions in 6E10+ diffuse plaques (Fig. 4o; Supplementary Figure 6G–H).”
§ Sustained microglial depletion with CSF1R inhibitor impairs parenchymal plaque development in an Alzheimer’s disease model > Results > Microglial elimination impairs plaque formation
plaindirect- Asserted: passes — The authors put it forward as true.
- Checkable: passes — It can be checked against evidence.
- Load-bearing: passes — The paper’s conclusions depend on it.
- Based: passes — The paper gives a reason why it holds.
- Probably not a substantial claim. 10
- It may state two separate claims as one. 54
Every source the paper cites for this claim was checked and supports it.
In the paper
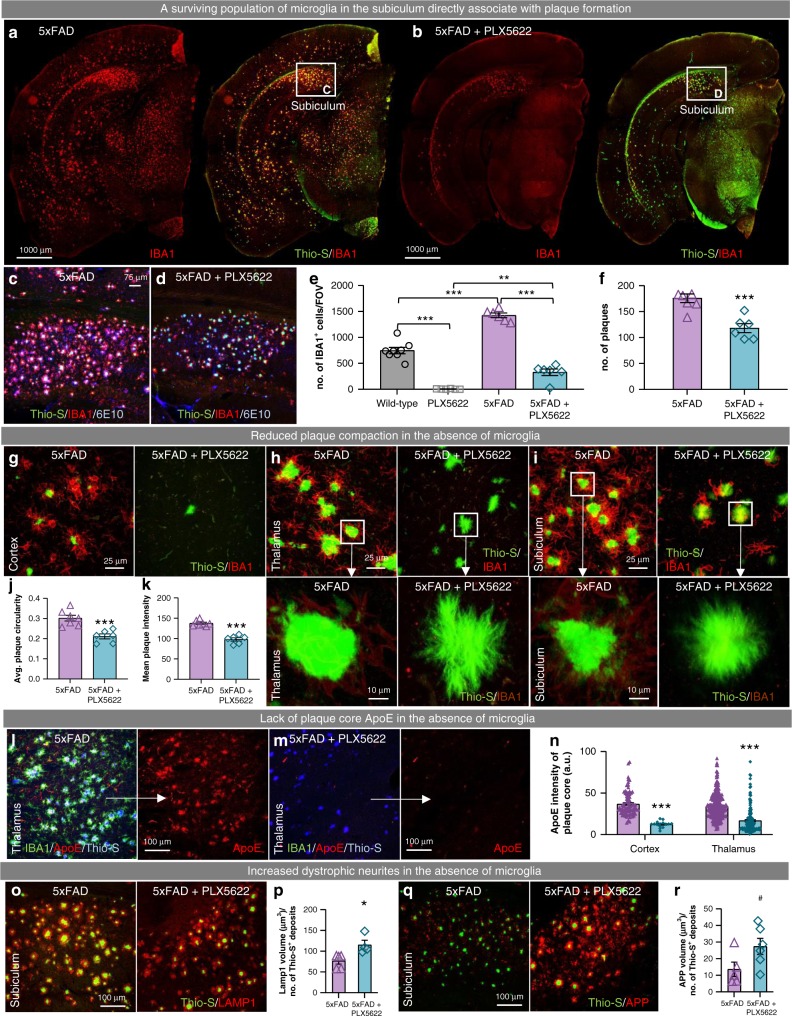
“These results are consistent with prior studies showing that microglia form a physical barrier around plaques and compact Aβ into dense deposits, protecting against local neurite damage35–37.”
§ Sustained microglial depletion with CSF1R inhibitor impairs parenchymal plaque development in an Alzheimer’s disease model > Results > Microglial plaque compaction ameliorates neuritic dystrophy
What the sources say
- Supportedcites [35] Condello, C., Yuan, P., Schain, A. & Grutzendler, J. Microglia constitute a barrier that prevents neurotoxic protofibrillar Abeta42 hotspots around plaques. Nat. Commun. 6, 6176 (2015). source
The Discussion describes microglial envelopment as a physical barrier that promotes plaque compaction and associates greater coverage with fewer dystrophic neurites. The Results also report that increased microglial coverage reduced local neurotoxicity, chiefly around smaller plaques. (LLM, conf=0.92)
- Supportedcites [36] Wang, Y. et al. TREM2-mediated early microglial response limits diffusion and toxicity of amyloid plaques. J. Exp. Med 213, 667–675 (2016). source
The Concluding remarks report that microglia form a physical barrier around Aβ plaques, creating compact regions, and that uncovered, less compact regions are associated with more severe axonal dystrophy. The paper’s own findings also link less dense plaques in TREM2-deficient mice with increased neuritic dystrophy. (LLM, conf=0.93)
- Supportedcites [37] Yuan, P. et al. TREM2 Haplodeficiency in Mice and Humans Impairs the Microglia Barrier Function Leading to Decreased Amyloid Compaction and Severe Axonal Dystrophy. Neuron 90, 724–739 (2016). source
The Introduction describes microglial processes wrapping around plaques to form a physical barrier, promoting compact plaque regions; adjacent axons show less dystrophy where microglia cover the plaque. The Discussion reports that microglial envelopment may induce fibril compaction and reduce exposure of surrounding neural structures to potentially neurotoxic fibrils. No page numbers are available in our copy. (LLM, conf=0.93)
plaindirect- Asserted: passes — The authors put it forward as true.
- Checkable: passes — It can be checked against evidence.
- Load-bearing: passes — The paper’s conclusions depend on it.
- Based: passes — The paper gives a reason why it holds.
Probably not a substantial claim. It may state two separate claims as one.
- Supported
A result the paper reports from its own data — it cites no other source for it, so there is none to check. The quote shows it is in the paper.
In the paper
“The appearance of CAA occurred only in microglia-depleted 5xFAD mice, as CAA was not observed in untreated 5xFAD mice or in treated wild-type mice.”
§ Sustained microglial depletion with CSF1R inhibitor impairs parenchymal plaque development in an Alzheimer’s disease model > Results > Microglial elimination impairs plaque formation
plain- Asserted: passes — The authors put it forward as true.
- Checkable: passes — It can be checked against evidence.
- Load-bearing: unclear — It is unclear whether the paper’s conclusions depend on it.
- Based: passes — The paper gives a reason why it holds.
It may state two separate claims as one.
A result the paper reports from its own data — it cites no other source for it, so there is none to check. The quote shows it is in the paper.
In the paper
“Treatment of 5xFAD mice with PLX5622 again reduced > 99% of microglia in the cortex (Fig. 4d, g), but as noted in wild-type mice, a fraction of cells remained in the thalamus (Fig. 4j).”
§ Sustained microglial depletion with CSF1R inhibitor impairs parenchymal plaque development in an Alzheimer’s disease model > Results > Microglial elimination impairs plaque formation
plaindirect- Asserted: passes — The authors put it forward as true.
- Checkable: passes — It can be checked against evidence.
- Load-bearing: passes — The paper’s conclusions depend on it.
- Based: passes — The paper gives a reason why it holds.
It may state two separate claims as one.
A result the paper reports from its own data — it cites no other source for it, so there is none to check. The quote shows it is in the paper.
In the paper
“Absolute numbers of astrocytes were not highly affected by pathology or microglial depletion, as measured by S100β+ cells (quantified in Supplementary Figure 5D), except for a small increase in the RS cortex in 5xFAD mice.”
§ Sustained microglial depletion with CSF1R inhibitor impairs parenchymal plaque development in an Alzheimer’s disease model > Results > Microglial elimination impairs plaque formation
plain- Asserted: passes — The authors put it forward as true.
- Checkable: passes — It can be checked against evidence.
- Load-bearing: unclear — It is unclear whether the paper’s conclusions depend on it.
- Based: passes — The paper gives a reason why it holds.
It may state two separate claims as one.
A result the paper reports from its own data — it cites no other source for it, so there is none to check. The quote shows it is in the paper.
In the paper
“With an additional 14 weeks of treatment (i.e., 24 weeks treated animals), microglia were eliminated brain wide (Fig. 4e, k), but Thio-S plaques persisted in these areas (i.e., the thalamus and RS cortex).”
§ Sustained microglial depletion with CSF1R inhibitor impairs parenchymal plaque development in an Alzheimer’s disease model > Results > Microglial elimination impairs plaque formation
plain- Asserted: passes — The authors put it forward as true.
- Checkable: passes — It can be checked against evidence.
- Load-bearing: passes — The paper’s conclusions depend on it.
- Based: passes — The paper gives a reason why it holds.
It may state two separate claims as one.
None of the sources cited for this claim have been checked yet.
In the paper
“In addition to Thio-S, CAA and plaques stained postiviely for Aβ fibrils, via the conformation specific antibody OC21 (Fig. 4r; Supplementary Figure 6C–D) and Aβ42 (Fig. 4s; Supplementary Figure 6E–F), but were negative for Aβ oligomers via A11 antibody22 (Fig. 4q; Supplementary Figure 6A–B).”
§ Sustained microglial depletion with CSF1R inhibitor impairs parenchymal plaque development in an Alzheimer’s disease model > Results > Microglial elimination impairs plaque formation
What the sources say
- Not checked yetcites [21] Kayed, R. et al. Fibril specific, conformation dependent antibodies recognize a generic epitope common to amyloid fibrils and fibrillar oligomers that is absent in prefibrillar oligomers. Mol. Neurodegener. 2, 18 (2007). source
- Not checked yetcites [22] Kayed, R. et al. Common structure of soluble amyloid oligomers implies common mechanism of pathogenesis. Science 300, 486–489 (2003). source
plain- Asserted: passes — The authors put it forward as true.
- Checkable: passes — It can be checked against evidence.
- Load-bearing: unclear — It is unclear whether the paper’s conclusions depend on it.
- Based: passes — The paper gives a reason why it holds.
It may state two separate claims as one.
A result the paper reports from its own data — it cites no other source for it, so there is none to check. The quote shows it is in the paper.
In the paper
“Of note, pyroglutamate-3 immunoreactivity was found in areas of treated 5xFAD mice that exhibited plaque pathology (i.e., thalamus; Supplementary Figure 6I–J).”
§ Sustained microglial depletion with CSF1R inhibitor impairs parenchymal plaque development in an Alzheimer’s disease model > Results > Microglial elimination impairs plaque formation
plaincorrelational- Asserted: passes — The authors put it forward as true.
- Checkable: passes — It can be checked against evidence.
- Load-bearing: fails — The paper’s conclusions may not depend on it.
- Based: passes — The paper gives a reason why it holds.
Probably not a substantial claim. The paper’s conclusions may not depend on it.
A result the paper reports from its own data — it cites no other source for it, so there is none to check. The quote shows it is in the paper.
In the paper
“To assess hippocampal-dependent memory, mice underwent testing using Y-Maze, Morris water maze (MWM), and Contextual fear conditioning (CFC) and 5xFAD animals did not show impairments in any of these tasks (Supplementary Figure 3E–G; Fig. 3i–k).”
§ Sustained microglial depletion with CSF1R inhibitor impairs parenchymal plaque development in an Alzheimer’s disease model > Results > Absence of abnormalities with microglial elimination
plain- Asserted: passes — The authors put it forward as true.
- Checkable: passes — It can be checked against evidence.
- Load-bearing: unclear — It is unclear whether the paper’s conclusions depend on it.
- Based: passes — The paper gives a reason why it holds.
It may state two separate claims as one.
A result the paper reports from its own data — it cites no other source for it, so there is none to check. The quote shows it is in the paper.
In the paper
“In wild-type mice, CSF1R inhibitor treatment for 10 weeks eliminated > 99% of microglia in the cortex (Fig. 4a–f), but a fraction of cells remained in the thalamus (Fig. 4i; enlarged in Supplementary Figure 4).”
§ Sustained microglial depletion with CSF1R inhibitor impairs parenchymal plaque development in an Alzheimer’s disease model > Results > Microglial elimination impairs plaque formation
plaindirect- Asserted: passes — The authors put it forward as true.
- Checkable: passes — It can be checked against evidence.
- Load-bearing: passes — The paper’s conclusions depend on it.
- Based: passes — The paper gives a reason why it holds.
It may state two separate claims as one.
A result the paper reports from its own data — it cites no other source for it, so there is none to check. The quote shows it is in the paper.
In the paper
“In fact, plaques were predominantly observed in the immediate vicinity of surviving IBA1+ cells – within the subiculum and associated white matter tract – while the cortex contained only vascular Thio-S+ deposits, in stark contrast to untreated 5xFAD mice (Fig. 6a vs. b).”
§ Sustained microglial depletion with CSF1R inhibitor impairs parenchymal plaque development in an Alzheimer’s disease model > Results > Microglial plaque compaction ameliorates neuritic dystrophy
plaincorrelational- Asserted: passes — The authors put it forward as true.
- Checkable: passes — It can be checked against evidence.
- Load-bearing: passes — The paper’s conclusions depend on it.
- Based: passes — The paper gives a reason why it holds.
It may state two separate claims as one.
The paper states this without a source or data behind it here, so there is nothing to check it against. The quote shows it is in the paper.
In the paper
“PLX5622 has lower molecular weight, higher lipophilicity and better cell permeability, all factors known to influence the ability of a compound to cross the BBB.”
§ Sustained microglial depletion with CSF1R inhibitor impairs parenchymal plaque development in an Alzheimer’s disease model > Results > Development of a CSF1R inhibitor for microglial elimination
plain- Asserted: passes — The authors put it forward as true.
- Checkable: passes — It can be checked against evidence.
- Load-bearing: passes — The paper’s conclusions depend on it.
- Based: passes — The paper gives a reason why it holds.
It may state two separate claims as one.
A result the paper reports from its own data — it cites no other source for it, so there is none to check. The quote shows it is in the paper.
In the paper
“While some plaques form in specific brain areas with treatment, we find that these few remaining plaques are associated with a small subset of microglia initially resistant to CSF1R-inhibition.”
§ Sustained microglial depletion with CSF1R inhibitor impairs parenchymal plaque development in an Alzheimer’s disease model > Discussion
plaincorrelational- Asserted: passes — The authors put it forward as true.
- Checkable: passes — It can be checked against evidence.
- Load-bearing: unclear — It is unclear whether the paper’s conclusions depend on it.
- Based: passes — The paper gives a reason why it holds.
It may state two separate claims as one.
A result the paper reports from its own data — it cites no other source for it, so there is none to check. The quote shows it is in the paper.
In the paper
“These features were common to all areas explored, including in the subiculum, where some IBA1+ cells were still present, suggesting that some threshold density of microglial cells may be required for full plaque compaction/restructuring.”
§ Sustained microglial depletion with CSF1R inhibitor impairs parenchymal plaque development in an Alzheimer’s disease model > Results > Microglial plaque compaction ameliorates neuritic dystrophy
hedged- Asserted: passes — The authors put it forward as true.
- Checkable: passes — It can be checked against evidence.
- Load-bearing: unclear — It is unclear whether the paper’s conclusions depend on it.
- Based: passes — The paper gives a reason why it holds.
It may state two separate claims as one.
A result the paper reports from its own data — it cites no other source for it, so there is none to check. The quote shows it is in the paper.
In the paper
“These plaques displayed an irregular shape with structured filaments radiating out from a central fissure/point and lacked the homogenous staining intensity of plaques in microglia-intact 5xFAD mice.”
§ Sustained microglial depletion with CSF1R inhibitor impairs parenchymal plaque development in an Alzheimer’s disease model > Results > Microglial plaque compaction ameliorates neuritic dystrophy
plain- Asserted: passes — The authors put it forward as true.
- Checkable: passes — It can be checked against evidence.
- Load-bearing: passes — The paper’s conclusions depend on it.
- Based: passes — The paper gives a reason why it holds.
It may state two separate claims as one.
A result the paper reports from its own data — it cites no other source for it, so there is none to check. The quote shows it is in the paper.
In the paper
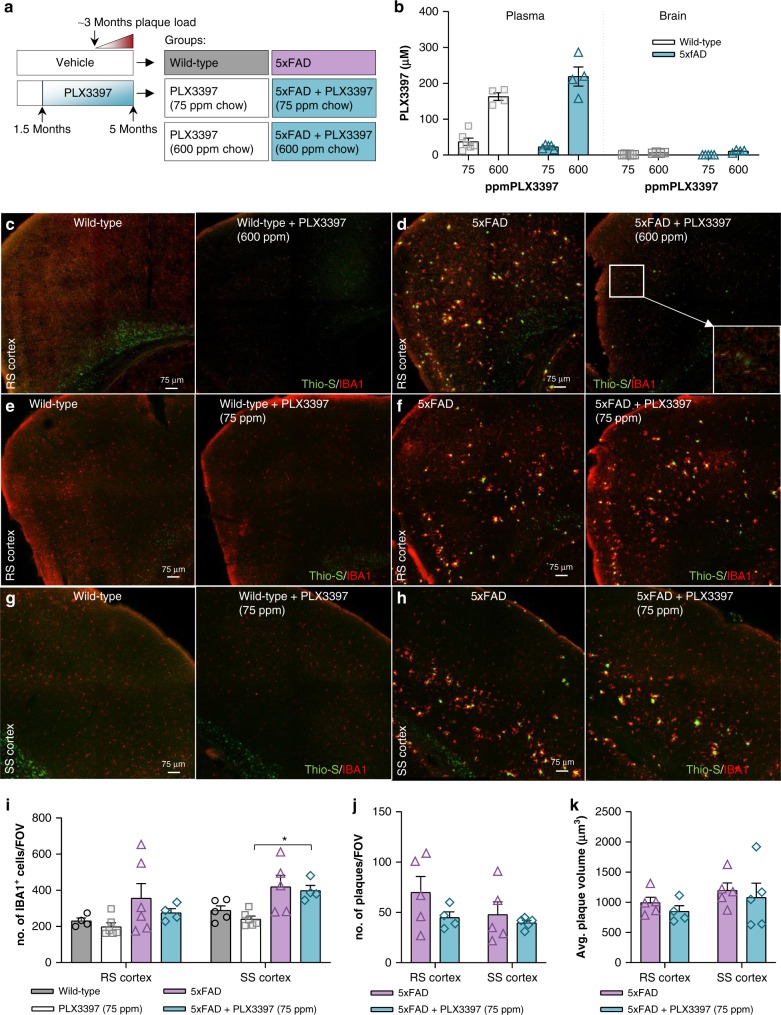
“Again, examination of the brains of these treated mice showed minimal plaque pathology and the appearance of CAA (Fig. 7c, d – zoomed image of CAA in D).”
§ Sustained microglial depletion with CSF1R inhibitor impairs parenchymal plaque development in an Alzheimer’s disease model > Results > Alternative CSF1R inhibitor confirms diminished plaque load
plaindirect- Asserted: passes — The authors put it forward as true.
- Checkable: passes — It can be checked against evidence.
- Load-bearing: passes — The paper’s conclusions depend on it.
- Based: passes — The paper gives a reason why it holds.
It may state two separate claims as one.
A result the paper reports from its own data — it cites no other source for it, so there is none to check. The quote shows it is in the paper.
In the paper
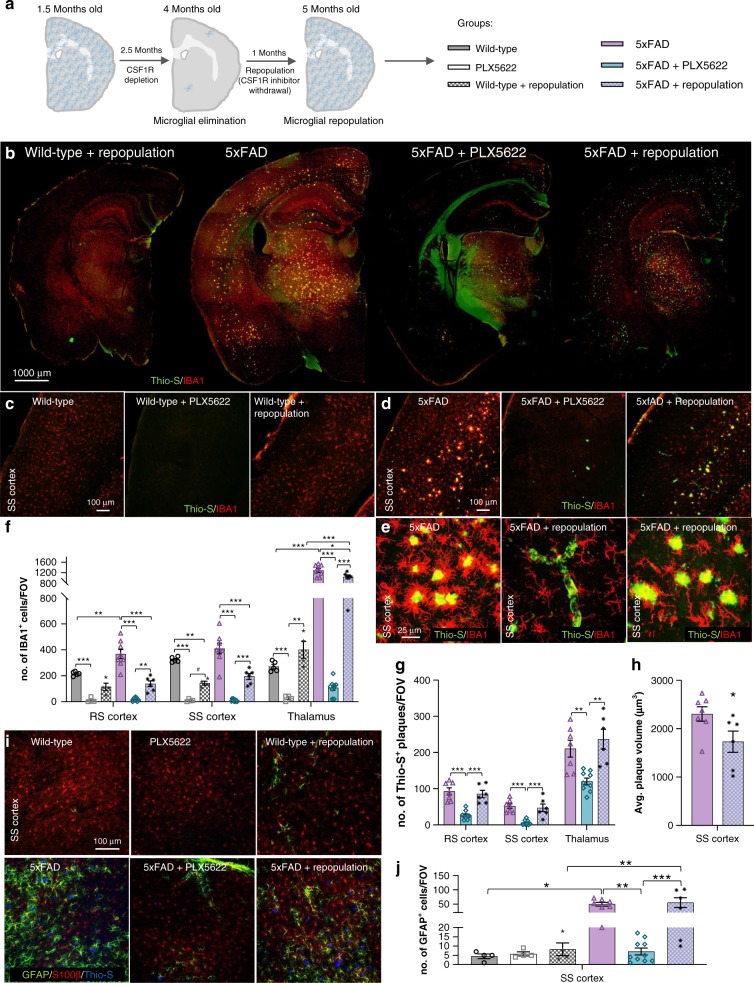
“As demonstrated previously, untreated 5xFAD mice exhibit cortical plaques at 4 months of age, but 5xFAD mice devoid of microglia show reduced plaque formation (Fig. 4d, g, l).”
§ Sustained microglial depletion with CSF1R inhibitor impairs parenchymal plaque development in an Alzheimer’s disease model > Results > Microglial repopulation seeds plaques
boosteddirect- Asserted: passes — The authors put it forward as true.
- Checkable: passes — It can be checked against evidence.
- Load-bearing: passes — The paper’s conclusions depend on it.
- Based: passes — The paper gives a reason why it holds.
It may state two separate claims as one.
A result the paper reports from its own data — it cites no other source for it, so there is none to check. The quote shows it is in the paper.
In the paper
“Transgene expression in 5xFAD mice (consisting of App, Psen1, and Thy1) was increased by ~2-fold over endogenous expression across brain regions (Fig. 9b) and was not impacted by treatment, consistent with the protein expression data (Fig. 5k, l).”
§ Sustained microglial depletion with CSF1R inhibitor impairs parenchymal plaque development in an Alzheimer’s disease model > Results > Gene expression analyses across three brain regions
plain- Asserted: passes — The authors put it forward as true.
- Checkable: passes — It can be checked against evidence.
- Load-bearing: fails — The paper’s conclusions may not depend on it.
- Based: passes — The paper gives a reason why it holds.
Probably not a substantial claim. The paper’s conclusions may not depend on it. It may state two separate claims as one.
A result the paper reports from its own data — it cites no other source for it, so there is none to check. The quote shows it is in the paper.
In the paper
“As such, both plaque circularity (Fig. 6j) and mean Thio-S intensities (Fig. 6k) were reduced in the 5xFAD mice devoid of microglia.”
§ Sustained microglial depletion with CSF1R inhibitor impairs parenchymal plaque development in an Alzheimer’s disease model > Results > Microglial plaque compaction ameliorates neuritic dystrophy
plaindirect- Asserted: passes — The authors put it forward as true.
- Checkable: passes — It can be checked against evidence.
- Load-bearing: passes — The paper’s conclusions depend on it.
- Based: passes — The paper gives a reason why it holds.
It may state two separate claims as one.
A result the paper reports from its own data — it cites no other source for it, so there is none to check. The quote shows it is in the paper.
In the paper
“Enrichment analyses of the hippocampus revealed an upregulation in immune function-associated pathways in 5xFAD vs. wild-type, and accordingly, these pathways were all highly significantly downregulated with PLX5622 treatment (Fig. 9f).”
§ Sustained microglial depletion with CSF1R inhibitor impairs parenchymal plaque development in an Alzheimer’s disease model > Results > Gene expression analyses across three brain regions
plaindirect- Asserted: passes — The authors put it forward as true.
- Checkable: passes — It can be checked against evidence.
- Load-bearing: passes — The paper’s conclusions depend on it.
- Based: passes — The paper gives a reason why it holds.
It may state two separate claims as one.
A result the paper reports from its own data — it cites no other source for it, so there is none to check. The quote shows it is in the paper.
In the paper
“Microglia repopulated all areas of the brain in both wild-type and 5xFAD mice (Fig. 10b), although overall densities were lower than the untreated mice in cortical regions (Fig. 10c, d; quantified in F).”
§ Sustained microglial depletion with CSF1R inhibitor impairs parenchymal plaque development in an Alzheimer’s disease model > Results > Microglial repopulation seeds plaques
plain- Asserted: passes — The authors put it forward as true.
- Checkable: passes — It can be checked against evidence.
- Load-bearing: passes — The paper’s conclusions depend on it.
- Based: passes — The paper gives a reason why it holds.
It may state two separate claims as one.
A result the paper reports from its own data — it cites no other source for it, so there is none to check. The quote shows it is in the paper.
In the paper
“Consistent with this, ApoE immunoreactivity was apparent within dense core plaques, but also in cellular processes surrounding the cores (Fig. 6l).”
§ Sustained microglial depletion with CSF1R inhibitor impairs parenchymal plaque development in an Alzheimer’s disease model > Results > Microglial plaque compaction ameliorates neuritic dystrophy
plain- Asserted: passes — The authors put it forward as true.
- Checkable: passes — It can be checked against evidence.
- Load-bearing: passes — The paper’s conclusions depend on it.
- Based: passes — The paper gives a reason why it holds.
It may state two separate claims as one.
A result the paper reports from its own data — it cites no other source for it, so there is none to check. The quote shows it is in the paper.
In the paper
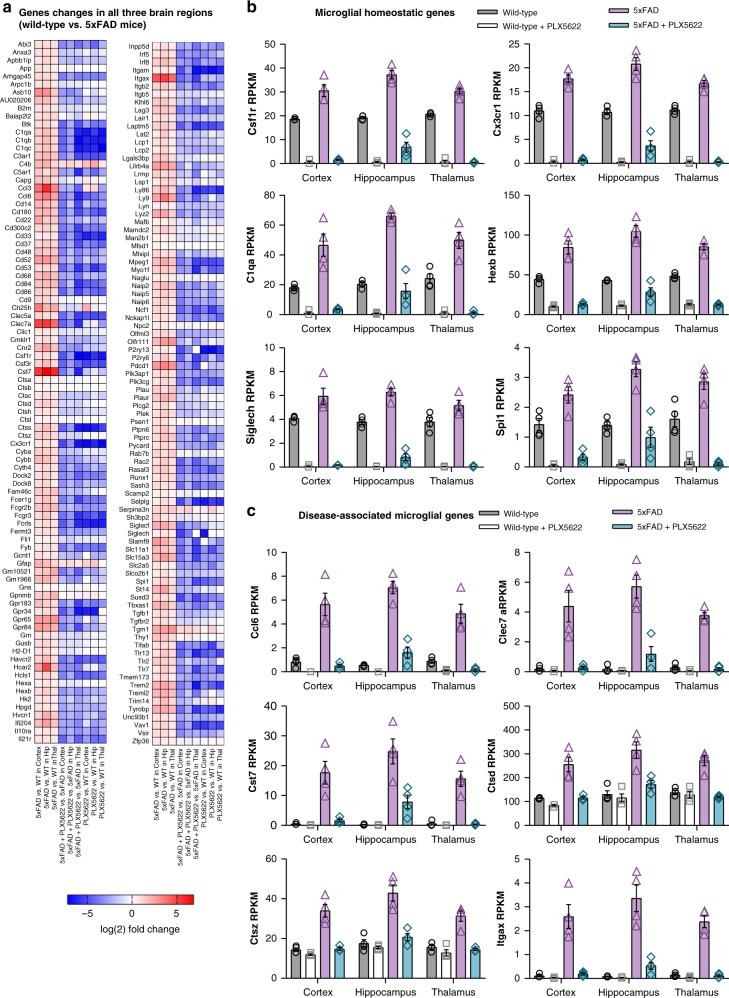
“We compared the number of differentially expressed genes (adjusted p-values < 0.05) induced by AD pathology in each of the three microdissected brain regions (i.e., wild-type vs. 5xFAD) and found that the hippocampus was most impacted (413 genes), while both cortex and thalamus exhibited fewer changes in gene expression (141 and 107 genes respectively; Fig. 9a).”
§ Sustained microglial depletion with CSF1R inhibitor impairs parenchymal plaque development in an Alzheimer’s disease model > Results > Gene expression analyses across three brain regions
plaincorrelational- Asserted: passes — The authors put it forward as true.
- Checkable: passes — It can be checked against evidence.
- Load-bearing: unclear — It is unclear whether the paper’s conclusions depend on it.
- Based: passes — The paper gives a reason why it holds.
It may state two separate claims as one.
A result the paper reports from its own data — it cites no other source for it, so there is none to check. The quote shows it is in the paper.
In the paper
“This lower dose achieved brain levels of ~1 μM, compared to ~10 μM with the higher dose (Fig. 7b), and accordingly, microglia numbers were unchanged relative to untreated animals (Fig. 7e–i).”
§ Sustained microglial depletion with CSF1R inhibitor impairs parenchymal plaque development in an Alzheimer’s disease model > Results > Alternative CSF1R inhibitor confirms diminished plaque load
plain- Asserted: passes — The authors put it forward as true.
- Checkable: passes — It can be checked against evidence.
- Load-bearing: passes — The paper’s conclusions depend on it.
- Based: passes — The paper gives a reason why it holds.
It may state two separate claims as one.
A result the paper reports from its own data — it cites no other source for it, so there is none to check. The quote shows it is in the paper.
In the paper
“However, examination of microglia-repopulated 5xFAD brains revealed the appearance of robust plaque pathology (Fig. 10d) with plaque numbers being equal to the untreated 5xFAD mice (Fig. 10g), although average plaque volumes were smaller (Fig. 10h).”
§ Sustained microglial depletion with CSF1R inhibitor impairs parenchymal plaque development in an Alzheimer’s disease model > Results > Microglial repopulation seeds plaques
plain- Asserted: passes — The authors put it forward as true.
- Checkable: passes — It can be checked against evidence.
- Load-bearing: passes — The paper’s conclusions depend on it.
- Based: passes — The paper gives a reason why it holds.
It may state two separate claims as one.
A result the paper reports from its own data — it cites no other source for it, so there is none to check. The quote shows it is in the paper.
In the paper
“All common genes were upregulated and the vast majority are microglia-associated, reflecting the microgliosis occurring in 5xFAD mice.”
§ Sustained microglial depletion with CSF1R inhibitor impairs parenchymal plaque development in an Alzheimer’s disease model > Results > Gene expression analyses across three brain regions
plaincorrelational- Asserted: passes — The authors put it forward as true.
- Checkable: passes — It can be checked against evidence.
- Load-bearing: unclear — It is unclear whether the paper’s conclusions depend on it.
- Based: passes — The paper gives a reason why it holds.
It may state two separate claims as one.
A result the paper reports from its own data — it cites no other source for it, so there is none to check. The quote shows it is in the paper.
In the paper
“The only significant changes in gene expression in 5xFAD mice compared to wild-type were the upregulation of the transgenes (App and Psen1; as expected due to overexpression), and Apoe, all of which were not altered by the absence of microglia, and the downregulation of myeloid-expressed Trem2, Ctsb, Ctsc, and Ctsd in the absence of microglia, as expected.”
§ Sustained microglial depletion with CSF1R inhibitor impairs parenchymal plaque development in an Alzheimer’s disease model > Results > Gene expression analyses across three brain regions
plain- Asserted: passes — The authors put it forward as true.
- Checkable: passes — It can be checked against evidence.
- Load-bearing: passes — The paper’s conclusions depend on it.
- Based: passes — The paper gives a reason why it holds.
It may state two separate claims as one.
A result the paper reports from its own data — it cites no other source for it, so there is none to check. The quote shows it is in the paper.
In the paper
“Repopulating microglia associate with the new plaques but do not appear to react to the vascular deposits (Fig. 10e).”
§ Sustained microglial depletion with CSF1R inhibitor impairs parenchymal plaque development in an Alzheimer’s disease model > Results > Microglial repopulation seeds plaques
hedgedcorrelational- Asserted: passes — The authors put it forward as true.
- Checkable: passes — It can be checked against evidence.
- Load-bearing: unclear — It is unclear whether the paper’s conclusions depend on it.
- Based: passes — The paper gives a reason why it holds.
It may state two separate claims as one.
A result the paper reports from its own data — it cites no other source for it, so there is none to check. The quote shows it is in the paper.
In the paper
“Accordingly, overlapping microglia genes were increased and neuronal genes decreased in 5xFAD mice compared to wild-type mice, which did not occur with PLX5622 treatment (Supplementary Figure 9).”
§ Sustained microglial depletion with CSF1R inhibitor impairs parenchymal plaque development in an Alzheimer’s disease model > Results > Gene expression analyses across three brain regions
plaincorrelational- Asserted: passes — The authors put it forward as true.
- Checkable: passes — It can be checked against evidence.
- Load-bearing: unclear — It is unclear whether the paper’s conclusions depend on it.
- Based: passes — The paper gives a reason why it holds.
It may state two separate claims as one.
A result the paper reports from its own data — it cites no other source for it, so there is none to check. The quote shows it is in the paper.
In the paper
“Consistent with our expectations, we detected expression of many of these genes (i.e., Ccl6, Clec7a, and Cst7) in PLX5622-treated 5xFAD hippocampi (but not cortex or thalamus), reflecting the population of surviving microglia in this region (see images of subicula in Fig. 6c–d, which are included in microdissected hippocampi) and providing a gene expression signature of plaque-forming/associated”
§ Sustained microglial depletion with CSF1R inhibitor impairs parenchymal plaque development in an Alzheimer’s disease model > Results > Gene expression analyses across three brain regions
plaincorrelational- Asserted: passes — The authors put it forward as true.
- Checkable: passes — It can be checked against evidence.
- Load-bearing: passes — The paper’s conclusions depend on it.
- Based: passes — The paper gives a reason why it holds.
It may state two separate claims as one.
A result the paper reports from its own data — it cites no other source for it, so there is none to check. The quote shows it is in the paper.
In the paper
“Moreover, GFAP+ astrocytes associated with plaques in both control and repopulated 5xFAD brains (Fig. 10i, j), but were absent in 5xFAD brains devoid of microglia.”
§ Sustained microglial depletion with CSF1R inhibitor impairs parenchymal plaque development in an Alzheimer’s disease model > Results > Microglial repopulation seeds plaques
plaincorrelational- Asserted: passes — The authors put it forward as true.
- Checkable: passes — It can be checked against evidence.
- Load-bearing: passes — The paper’s conclusions depend on it.
- Based: passes — The paper gives a reason why it holds.
It may state two separate claims as one.
None of the sources cited for this claim have been checked yet.
In the paper
“To that end, we designed and created PLX5622, which shows high selectivity for the CSF1R (Supplementary Table 2), desirable PK characteristics across species (mouse, rat, dog, monkey; Supplementary Table 5) including oral bioavailability, a > 20% brain penetrance (Supplementary Table 6), and rapid/sustained elimination of microglia (Figs 2, 3).”
§ Sustained microglial depletion with CSF1R inhibitor impairs parenchymal plaque development in an Alzheimer’s disease model > Discussion
What the sources say
- Not checked yetcites Supplementary Table 2
- Not checked yetcites Supplementary Table 5
- Not checked yetcites Supplementary Table 6
plain- Asserted: passes — The authors put it forward as true.
- Checkable: passes — It can be checked against evidence.
- Load-bearing: passes — The paper’s conclusions depend on it.
- Based: passes — The paper gives a reason why it holds.
It may state two separate claims as one.
A result the paper reports from its own data — it cites no other source for it, so there is none to check. The quote shows it is in the paper.
In the paper
“The hippocampus displayed a unique gene expression profile relative to the cortex and thalamus and included a unique subset of downregulated genes.”
§ Sustained microglial depletion with CSF1R inhibitor impairs parenchymal plaque development in an Alzheimer’s disease model > Results > Gene expression analyses across three brain regions
plaincorrelational- Asserted: passes — The authors put it forward as true.
- Checkable: passes — It can be checked against evidence.
- Load-bearing: unclear — It is unclear whether the paper’s conclusions depend on it.
- Based: passes — The paper gives a reason why it holds.
It may state two separate claims as one.
A result the paper reports from its own data — it cites no other source for it, so there is none to check. The quote shows it is in the paper.
In the paper
“Comparisons of changes in expression between brain regions showed regional differences in Ache, Apoe, Ptk2b, Sorl1, and Sort1.”
§ Sustained microglial depletion with CSF1R inhibitor impairs parenchymal plaque development in an Alzheimer’s disease model > Results > Gene expression analyses across three brain regions
plaincorrelational- Asserted: passes — The authors put it forward as true.
- Checkable: passes — It can be checked against evidence.
- Load-bearing: fails — The paper’s conclusions may not depend on it.
- Based: passes — The paper gives a reason why it holds.
Probably not a substantial claim. The paper’s conclusions may not depend on it.
A result the paper reports from its own data — it cites no other source for it, so there is none to check. The quote shows it is in the paper.
In the paper
“Examination of ApoE immunoreactivity in microglia-devoid 5xFAD mice showed that the ApoE+ microglial processes surrounding dense core plaques were absent, as expected, but also the plaque cores themselves lacked ApoE staining (Fig. 6m).”
§ Sustained microglial depletion with CSF1R inhibitor impairs parenchymal plaque development in an Alzheimer’s disease model > Results > Microglial plaque compaction ameliorates neuritic dystrophy
plain- Asserted: passes — The authors put it forward as true.
- Checkable: passes — It can be checked against evidence.
- Load-bearing: passes — The paper’s conclusions depend on it.
- Based: passes — The paper gives a reason why it holds.
It may state two separate claims as one.
A result the paper reports from its own data — it cites no other source for it, so there is none to check. The quote shows it is in the paper.
In the paper
“With 75 ppm PLX3397, no reductions in plaque load or appearance of CAA were detected in treated 5xFAD animals compared to controls (Fig. 7f, h, j–k).”
§ Sustained microglial depletion with CSF1R inhibitor impairs parenchymal plaque development in an Alzheimer’s disease model > Results > Alternative CSF1R inhibitor confirms diminished plaque load
plain- Asserted: passes — The authors put it forward as true.
- Checkable: passes — It can be checked against evidence.
- Load-bearing: passes — The paper’s conclusions depend on it.
- Based: passes — The paper gives a reason why it holds.
It may state two separate claims as one.
A result the paper reports from its own data — it cites no other source for it, so there is none to check. The quote shows it is in the paper.
In the paper
“Of note, only 1 downregulated gene was identified in the cortex and none were detected in the thalamus.”
§ Sustained microglial depletion with CSF1R inhibitor impairs parenchymal plaque development in an Alzheimer’s disease model > Results > Gene expression analyses across three brain regions
plain- Asserted: passes — The authors put it forward as true.
- Checkable: passes — It can be checked against evidence.
- Load-bearing: unclear — It is unclear whether the paper’s conclusions depend on it.
- Based: passes — The paper gives a reason why it holds.
It may state two separate claims as one.
A result the paper reports from its own data — it cites no other source for it, so there is none to check. The quote shows it is in the paper.
In the paper
“Of the 413 identified genes, 77 were downregulated in the 5xFAD hippocampus (Fig. 9c, and individual genes plotted in D). Notably, these transcripts were primarily synaptic and neuronal in nature, including genes such as Dlk2, Dync1l1, Gls, Kcnq3, Nrg3, and Scn1b.”
§ Sustained microglial depletion with CSF1R inhibitor impairs parenchymal plaque development in an Alzheimer’s disease model > Results > Gene expression analyses across three brain regions
plain- Asserted: passes — The authors put it forward as true.
- Checkable: passes — It can be checked against evidence.
- Load-bearing: passes — The paper’s conclusions depend on it.
- Based: passes — The paper gives a reason why it holds.
It may state two separate claims as one.
A result the paper reports from its own data — it cites no other source for it, so there is none to check. The quote shows it is in the paper.
In the paper
“Ultimately, these data demonstrate that microglial elimination is associated with the prevention of plaque formation and the downregulation of hippocampal neuronal genes that occur in a preclinical model of AD progression.”
§ Sustained microglial depletion with CSF1R inhibitor impairs parenchymal plaque development in an Alzheimer’s disease model > Discussion
boostedcorrelational- Asserted: passes — The authors put it forward as true.
- Checkable: passes — It can be checked against evidence.
- Load-bearing: passes — The paper’s conclusions depend on it.
- Based: passes — The paper gives a reason why it holds.
It may state two separate claims as one.
None of the sources cited for this claim have been checked yet.
In the paper
“indicating that the long-term absence of microglia is not detrimental to murine cognitive function and may be beneficial, at least in this assay, which is consistent with our prior findings17,18.”
§ Sustained microglial depletion with CSF1R inhibitor impairs parenchymal plaque development in an Alzheimer’s disease model > Results > Absence of abnormalities with microglial elimination
What the sources say
- Not checked yetcites [17] Elmore, M. R. et al. Colony-stimulating factor 1 receptor signaling is necessary for microglia viability, unmasking a microglia progenitor cell in the adult brain. Neuron 82, 380–397 (2014). source
- Not checked yetcites [18] Rice, R. A. et al. Elimination of Microglia Improves Functional Outcomes Following Extensive Neuronal Loss in the Hippocampus. J. Neurosci. 35, 9977–9989 (2015). source
hedgedconditional- Asserted: passes — The authors put it forward as true.
- Checkable: passes — It can be checked against evidence.
- Load-bearing: passes — The paper’s conclusions depend on it.
- Based: passes — The paper gives a reason why it holds.
It may state two separate claims as one.
A conclusion the paper draws from its own results — it cites no other source for it, so there is none to check. The quote shows it is in the paper.
In the paper
“Importantly, these results highlight a clear relationship between microglia/myeloid cells and the appearance of plaques, suggesting a role of microglia/myeloid cells in facilitating plaque formation, and emphasizes that few cells are required for this process to occur.”
§ Sustained microglial depletion with CSF1R inhibitor impairs parenchymal plaque development in an Alzheimer’s disease model > Results > Microglial plaque compaction ameliorates neuritic dystrophy
hedgeddirect- Asserted: passes — The authors put it forward as true.
- Checkable: passes — It can be checked against evidence.
- Load-bearing: passes — The paper’s conclusions depend on it.
- Based: passes — The paper gives a reason why it holds.
It may state two separate claims as one.
A conclusion the paper draws from its own results — it cites no other source for it, so there is none to check. The quote shows it is in the paper.
In the paper
“Thus, the absence of microglia modulates the location of Aβ accumulation (i.e., parenchyma vs. vasculature) but does not alter the net amounts present.”
§ Sustained microglial depletion with CSF1R inhibitor impairs parenchymal plaque development in an Alzheimer’s disease model > Results > Microglial elimination impairs plaque formation
plaindirect- Asserted: passes — The authors put it forward as true.
- Checkable: passes — It can be checked against evidence.
- Load-bearing: passes — The paper’s conclusions depend on it.
- Based: passes — The paper gives a reason why it holds.
It may state two separate claims as one.
A conclusion the paper draws from its own results — it cites no other source for it, so there is none to check. The quote shows it is in the paper.
In the paper
“These results suggest that microglia may be critical regulators of plaque formation and that few surviving microglial cells are sufficient to facilitate some degree of plaque formation (i.e., as seen in the thalamus).”
§ Sustained microglial depletion with CSF1R inhibitor impairs parenchymal plaque development in an Alzheimer’s disease model > Results > Microglial elimination impairs plaque formation
hedgedconditional- Asserted: passes — The authors put it forward as true.
- Checkable: passes — It can be checked against evidence.
- Load-bearing: passes — The paper’s conclusions depend on it.
- Based: passes — The paper gives a reason why it holds.
It may state two separate claims as one.
A conclusion the paper draws from its own results — it cites no other source for it, so there is none to check. The quote shows it is in the paper.
In the paper
“These results implicate microglia as critical and causative in the development and progression of multiple facets of AD pathology.”
§ Sustained microglial depletion with CSF1R inhibitor impairs parenchymal plaque development in an Alzheimer’s disease model > Introduction
plaindirect- Asserted: passes — The authors put it forward as true.
- Checkable: passes — It can be checked against evidence.
- Load-bearing: passes — The paper’s conclusions depend on it.
- Based: passes — The paper gives a reason why it holds.
It may state two separate claims as one.
In the paper
“yet the removal of the microglia at advanced stages of pathology protects against synaptic and neuronal loss10.”
§ Sustained microglial depletion with CSF1R inhibitor impairs parenchymal plaque development in an Alzheimer’s disease model > Introduction
What the sources say
- Not checked yetcites [10] Spangenberg, E. E. et al. Eliminating microglia in Alzheimer’s mice prevents neuronal loss without modulating amyloid-beta pathology. Brain 139, 1265–1281 (2016). source
plaindirect- Asserted: passes — The authors put it forward as true.
- Checkable: passes — It can be checked against evidence.
- Load-bearing: passes — The paper’s conclusions depend on it.
- Based: passes — The paper gives a reason why it holds.
Probably not a substantial claim.
None of the sources cited for this claim have been checked yet.
In the paper
“The aggregation of Aβ is an initial step in the formation of plaques, requiring an acidic pH13 and micromolar concentrations of Aβ monomers14.”
§ Sustained microglial depletion with CSF1R inhibitor impairs parenchymal plaque development in an Alzheimer’s disease model > Results > Microglia contain Aβ aggregates in AD mouse models and humans
What the sources say
- Not checked yetcites [13] Su, Y. & Chang, P. T. Acidic pH promotes the formation of toxic fibrils from beta-amyloid peptide. Brain Res 893, 287–291 (2001). source
- Not checked yetcites [14] Tseng, B. P. et al. Deposition of monomeric, not oligomeric, Abeta mediates growth of Alzheimer’s disease amyloid plaques in human brain preparations. Biochemistry 38, 10424–10431 (1999). source
plaindirect- Asserted: passes — The authors put it forward as true.
- Checkable: passes — It can be checked against evidence.
- Load-bearing: passes — The paper’s conclusions depend on it.
- Based: passes — The paper gives a reason why it holds.
It may state two separate claims as one.
A conclusion the paper draws from its own results — it cites no other source for it, so there is none to check. The quote shows it is in the paper.
In the paper
“The extracellular space does not meet these requisite conditions, suggesting that Aβ aggregation originates elsewhere.”
§ Sustained microglial depletion with CSF1R inhibitor impairs parenchymal plaque development in an Alzheimer’s disease model > Results > Microglia contain Aβ aggregates in AD mouse models and humans
hedged- Asserted: passes — The authors put it forward as true.
- Checkable: passes — It can be checked against evidence.
- Load-bearing: passes — The paper’s conclusions depend on it.
- Based: passes — The paper gives a reason why it holds.
It may state two separate claims as one.
A conclusion the paper draws from its own results — it cites no other source for it, so there is none to check. The quote shows it is in the paper.
In the paper
“The expression of these genes was nearly undetectable from PLX5622-treated mice, highlighting their specific expression by microglia and the specificity of PLX5622 on microglial survival.”
§ Sustained microglial depletion with CSF1R inhibitor impairs parenchymal plaque development in an Alzheimer’s disease model > Results > Gene expression analyses across three brain regions
plaindirect- Asserted: passes — The authors put it forward as true.
- Checkable: passes — It can be checked against evidence.
- Load-bearing: passes — The paper’s conclusions depend on it.
- Based: passes — The paper gives a reason why it holds.
It may state two separate claims as one.
A conclusion the paper draws from its own results — it cites no other source for it, so there is none to check. The quote shows it is in the paper.
In the paper
“Data presented here show that long-term PLX5622-mediated microglial depletion is highly robust, sustainable, and specific to the microglial compartment.”
§ Sustained microglial depletion with CSF1R inhibitor impairs parenchymal plaque development in an Alzheimer’s disease model > Discussion
boosted- Asserted: passes — The authors put it forward as true.
- Checkable: passes — It can be checked against evidence.
- Load-bearing: passes — The paper’s conclusions depend on it.
- Based: passes — The paper gives a reason why it holds.
It may state two separate claims as one.
None of the sources cited for this claim have been checked yet.
In the paper
“Dystrophic neurites are found in a halo around fibrillar plaques and are characterized by the accumulation of LAMP1 and APP32–34.”
§ Sustained microglial depletion with CSF1R inhibitor impairs parenchymal plaque development in an Alzheimer’s disease model > Results > Microglial plaque compaction ameliorates neuritic dystrophy
What the sources say
- Not checked yetcites [32] Andrew, R. J. et al. Lack of BACE1 S-palmitoylation reduces amyloid burden and mitigates memory deficits in transgenic mouse models of Alzheimer’s disease. Proc. Natl. Acad. Sci. USA 114, E9665–e9674 (2017). source
- Not checked yetcites [33] Cummings, B. J. et al. Aggregation of the amyloid precursor protein within degenerating neurons and dystrophic neurites in Alzheimer’s disease. Neuroscience 48, 763–777 (1992). source
- Not checked yetcites [34] Gowrishankar, S. et al. Massive accumulation of luminal protease-deficient axonal lysosomes at Alzheimer’s disease amyloid plaques. Proc. Natl. Acad. Sci. USA 112, E3699–E3708 (2015). source
plaincorrelational- Asserted: passes — The authors put it forward as true.
- Checkable: passes — It can be checked against evidence.
- Load-bearing: passes — The paper’s conclusions depend on it.
- Based: passes — The paper gives a reason why it holds.
It may state two separate claims as one.
None of the sources cited for this claim have been checked yet.
In the paper
“While microglia can be indefinitely depleted via the continued administration of CSF1R inhibitors, the microglial compartment can also be repopulated upon CSF1R inhibitor withdrawal17,40,41.”
§ Sustained microglial depletion with CSF1R inhibitor impairs parenchymal plaque development in an Alzheimer’s disease model > Results > Microglial repopulation seeds plaques
What the sources say
- Not checked yetcites [17] Elmore, M. R. et al. Colony-stimulating factor 1 receptor signaling is necessary for microglia viability, unmasking a microglia progenitor cell in the adult brain. Neuron 82, 380–397 (2014). source
- Not checked yetcites [40] Elmore, M. R. P. et al. Replacement of microglia in the aged brain reverses cognitive, synaptic, and neuronal deficits in mice. Aging Cell 17, e12832 (2018). source
- Not checked yetcites [41] Rice, R. A. et al. Microglial repopulation resolves inflammation and promotes brain recovery after injury. Glia 65, 931–944 (2017). source
plaindirect- Asserted: passes — The authors put it forward as true.
- Checkable: passes — It can be checked against evidence.
- Load-bearing: passes — The paper’s conclusions depend on it.
- Based: passes — The paper gives a reason why it holds.
It may state two separate claims as one.
In the paper
“Notably, several of these genes are known markers of disease-associated microglia39 (DAM).”
§ Sustained microglial depletion with CSF1R inhibitor impairs parenchymal plaque development in an Alzheimer’s disease model > Results > Gene expression analyses across three brain regions
What the sources say
- Not checked yetcites [39] Keren-Shaul, H. et al. A unique microglia type associated with restricting development of Alzheimer’s disease. Cell 169, 1276–1290 e17 (2017). source
boostedcorrelational- Asserted: passes — The authors put it forward as true.
- Checkable: passes — It can be checked against evidence.
- Load-bearing: fails — The paper’s conclusions may not depend on it.
- Based: passes — The paper gives a reason why it holds.
Probably not a substantial claim. The paper’s conclusions may not depend on it.
In the paper
“We further examined the role of peripheral CSF1R inhibition on AD pathology by treating 1.5-month-old 5xFAD mice until 5 months of age with PLX3397 (75 ppm) chow (Fig. 7a) – a formulation that provides robust peripheral CSF1R inhibition without microglial elimination17.”
§ Sustained microglial depletion with CSF1R inhibitor impairs parenchymal plaque development in an Alzheimer’s disease model > Results > Alternative CSF1R inhibitor confirms diminished plaque load
What the sources say
- Not checked yetcites [17] Elmore, M. R. et al. Colony-stimulating factor 1 receptor signaling is necessary for microglia viability, unmasking a microglia progenitor cell in the adult brain. Neuron 82, 380–397 (2014). source
plaindirect- Asserted: passes — The authors put it forward as true.
- Checkable: passes — It can be checked against evidence.
- Load-bearing: passes — The paper’s conclusions depend on it.
- Based: passes — The paper gives a reason why it holds.
It may state two separate claims as one.
A conclusion the paper draws from its own results — it cites no other source for it, so there is none to check. The quote shows it is in the paper.
In the paper
“Thus, both AD pathology and the absence of microglia have minimal effects on AD-related genes, and importantly, we observe no alterations in gene expression or protein production in the absence of microglia that could account for reduced plaque formation.”
§ Sustained microglial depletion with CSF1R inhibitor impairs parenchymal plaque development in an Alzheimer’s disease model > Results > Gene expression analyses across three brain regions
plain- Asserted: passes — The authors put it forward as true.
- Checkable: passes — It can be checked against evidence.
- Load-bearing: passes — The paper’s conclusions depend on it.
- Based: passes — The paper gives a reason why it holds.
It may state two separate claims as one.
The paper states this without a source or data behind it here, so there is nothing to check it against. The quote shows it is in the paper.
In the paper
“Most importantly, CSF1R inhibition is the only currently available method capable of achieving sustained long-term microglial elimination.”
§ Sustained microglial depletion with CSF1R inhibitor impairs parenchymal plaque development in an Alzheimer’s disease model > Discussion
plaindirect- Asserted: passes — The authors put it forward as true.
- Checkable: passes — It can be checked against evidence.
- Load-bearing: passes — The paper’s conclusions depend on it.
- Based: fails — The paper may give no reason why it holds.
Probably not a substantial claim. The paper may give no reason why it holds.
A conclusion the paper draws from its own results — it cites no other source for it, so there is none to check. The quote shows it is in the paper.
In the paper
“Thus, peripheral CSF1R inhibition or simply the presence of CSF1R inhibitor within the CNS do not attribute to the reductions in plaque pathology and more complete microglial elimination is necessary to perturb plaque formation processes.”
§ Sustained microglial depletion with CSF1R inhibitor impairs parenchymal plaque development in an Alzheimer’s disease model > Results > Alternative CSF1R inhibitor confirms diminished plaque load
plain- Asserted: passes — The authors put it forward as true.
- Checkable: passes — It can be checked against evidence.
- Load-bearing: passes — The paper’s conclusions depend on it.
- Based: passes — The paper gives a reason why it holds.
It may state two separate claims as one.
None of the sources cited for this claim have been checked yet.
In the paper
“Focusing on plaque structure, we next evaluated the presence of ApoE within plaque cores – previous reports describe the coaggregation of ApoE with Aβ fibrils in both plaques and vascular pathology29,30.”
§ Sustained microglial depletion with CSF1R inhibitor impairs parenchymal plaque development in an Alzheimer’s disease model > Results > Microglial plaque compaction ameliorates neuritic dystrophy
What the sources say
- Not checked yetcites [29] Liao, F. et al. Murine versus human apolipoprotein E4: differential facilitation of and co-localization in cerebral amyloid angiopathy and amyloid plaques in APP transgenic mouse models. Acta Neuropathol. Commun. 3, 70 (2015). source
- Not checked yetcites [30] Parhizkar, S. et al. Loss of TREM2 function increases amyloid seeding but reduces plaque-associated ApoE. Nat Neurosci (2019). source
plaincorrelational- Asserted: passes — The authors put it forward as true.
- Checkable: passes — It can be checked against evidence.
- Load-bearing: fails — The paper’s conclusions may not depend on it.
- Based: passes — The paper gives a reason why it holds.
Probably not a substantial claim. The paper’s conclusions may not depend on it.
In the paper
“Therefore, microglia appear to have complex and contrasting roles within AD61, namely their facilitation of plaque formation, plaque growth, plaque compaction, and neuronal damage.”
§ Sustained microglial depletion with CSF1R inhibitor impairs parenchymal plaque development in an Alzheimer’s disease model > Discussion
What the sources say
- Not checked yetcites [61] Moore, Z., Taylor, J. M. & Crack, P. J. The involvement of microglia in Alzheimer’s disease: a new dog in the fight. Br. J. Pharmacol. (2018). source
hedgeddirect- Asserted: passes — The authors put it forward as true.
- Checkable: passes — It can be checked against evidence.
- Load-bearing: fails — The paper’s conclusions may not depend on it.
- Based: passes — The paper gives a reason why it holds.
Probably not a substantial claim. The paper’s conclusions may not depend on it. It may state two separate claims as one.
A conclusion the paper draws from its own results — it cites no other source for it, so there is none to check. The quote shows it is in the paper.
In the paper
“These results indicate that microglia appear to contribute to multiple facets of AD etiology – microglia appear crucial to the initial appearance and structure of plaques, and following plaque formation, promote a chronic inflammatory state modulating neuronal gene expression changes in response to Aβ/AD pathology.”
§ Sustained microglial depletion with CSF1R inhibitor impairs parenchymal plaque development in an Alzheimer’s disease model > Discussion
hedgeddirect- Asserted: passes — The authors put it forward as true.
- Checkable: passes — It can be checked against evidence.
- Load-bearing: passes — The paper’s conclusions depend on it.
- Based: passes — The paper gives a reason why it holds.
It may state two separate claims as one.
None of the sources cited for this claim have been checked yet.
In the paper
“No statistical methods were used to predetermine sample sizes; however, our sample sizes are similar to those reported in recently published similar studies10,28.”
§ Sustained microglial depletion with CSF1R inhibitor impairs parenchymal plaque development in an Alzheimer’s disease model > Methods > Statistics
What the sources say
- Not checked yetcites [10] Spangenberg, E. E. et al. Eliminating microglia in Alzheimer’s mice prevents neuronal loss without modulating amyloid-beta pathology. Brain 139, 1265–1281 (2016). source
- Not checked yetcites [28] Olmos-Alonso, A. et al. Pharmacological targeting of CSF1R inhibits microglial proliferation and prevents the progression of Alzheimer’s-like pathology. Brain 139, 891–907 (2016). source
plain- Asserted: passes — The authors put it forward as true.
- Checkable: passes — It can be checked against evidence.
- Load-bearing: fails — The paper’s conclusions may not depend on it.
- Based: passes — The paper gives a reason why it holds.
Probably not a substantial claim. The paper’s conclusions may not depend on it. It may state two separate claims as one.
A conclusion the paper draws from its own results — it cites no other source for it, so there is none to check. The quote shows it is in the paper.
In the paper
“Therefore, microglia appear to have detrimental and beneficial roles in a preclinical model of AD.”
§ Sustained microglial depletion with CSF1R inhibitor impairs parenchymal plaque development in an Alzheimer’s disease model > Discussion
hedgedconditional- Asserted: passes — The authors put it forward as true.
- Checkable: passes — It can be checked against evidence.
- Load-bearing: passes — The paper’s conclusions depend on it.
- Based: passes — The paper gives a reason why it holds.
It may state two separate claims as one.
- Rests on an assumption: Plaque-associated microglia may protect against local neurite damage.
The paper relies on this without support.
5xFAD mice exhibit plaque pathology from 3 months of age.
“To that end, 5xFAD animals, which exhibit plaque pathology from 3 months of age, underwent treatment at 1.5 months of age with PLX5622-formulated chow (1200 ppm) or control diet continuously for either 10–24 weeks.”
The paper relies on this without support.
The 5xFAD mouse model is a valid model of Alzheimer's disease pathology relevant to human AD.
“We find that in the 5xFAD mouse model of AD, plaques fail to form in the parenchymal space following microglial depletion, except in areas containing surviving microglia.”
The paper relies on this without support.
Plaque-associated microglia may protect against local neurite damage.
“Although plaque-associated microglia may protect against local neurite damage, the presence of microglia is also required for the reduction in expression of synaptic and neuronal genes in the hippocampus associated with AD.”
The authors state this as an assumption.
Data distribution is normal.
“Data distribution was assumed to be normal, but this was not formally tested.”
Claims other papers make about this one
Each is checked against this paper’s own text: does it say what the citing paper says it does?
The source backs part of the claim, not all of it — or backs it for a different population, condition or comparison.
In the citing paper
“Our results are in line with studies showing that reduced microglial colocalization with β-amyloid is associated with a reduced β-amyloid burden (D’Errico et al., 2022; Spangenberg et al., 2019).”
From A novel molecular class that recruits HDAC/MECP2 complexes to PU.1 motifs reduces neuroinflammation (2023) · cites this paper as Spangenberg et al., 2019
Experimental — accuracy not yet measuredThe source backs part of the claim, not all of it — or backs it for a different population, condition or comparison.
In the citing paper
“In support of this interpretation, previous studies have shown that microglial depletion can have beneficial effects in transgenic mice that model AD hallmarks, including reduction in brain accumulation of both amyloid-β and tau (Sosna et al., 2018; Spangenberg et al., 2019).”
From A novel molecular class that recruits HDAC/MECP2 complexes to PU.1 motifs reduces neuroinflammation (2023) · cites this paper as Spangenberg et al., 2019
Experimental — accuracy not yet measuredThe source backs part of the claim, not all of it — or backs it for a different population, condition or comparison.
In the citing paper
“It enables sustained microglial depletion without breaching the BBB, without toxicity and without initiating an inflammatory response, as seen with other microglial depletion methods [295, 299, 331].”
From Microglia and monocytes in inflammatory CNS disease: integrating phenotype and function (2022) · cites this paper as [295]
Experimental — accuracy not yet measuredThe source backs part of the claim, not all of it — or backs it for a different population, condition or comparison.
In the citing paper
“microglia depletion before or after the formation of Aβ pathology in mouse models of AD resulted in improved contextual memory”
From Microglia and monocytes in inflammatory CNS disease: integrating phenotype and function (2022) · cites this paper as [295]
Experimental — accuracy not yet measuredThe source backs part of the claim, not all of it — or backs it for a different population, condition or comparison.
In the citing paper
“TREM2, a receptor expressed by DAM/MGnD, which exerts its protective function in AD via ligation of ApoE (apolipoprotein E), which binds to loose Aβ aggregates, or direct ligation of Aβ oligomers [286, 295, 338, 357, 366]”
From Microglia and monocytes in inflammatory CNS disease: integrating phenotype and function (2022) · cites this paper as [295]
Experimental — accuracy not yet measured
The cited source says what the claim attributes to it.
In the citing paper
“Aβ aggregates were found within the lysosomes of microglia in brain regions where plaques were not yet formed in non-PLX5622-treated 5xFAD mice [295]”
From Microglia and monocytes in inflammatory CNS disease: integrating phenotype and function (2022) · cites this paper as [295]
The cited source says what the claim attributes to it.
In the citing paper
“a fraction of microglia in the thalamus were resistant to 10 weeks of PLX5622 treatment and were associated with the few plaques that had formed [295]”
From Microglia and monocytes in inflammatory CNS disease: integrating phenotype and function (2022) · cites this paper as [295]
The cited source says what the claim attributes to it.
In the citing paper
“Microglial ablation using PLX3397 in two-month-old 5xFAD mice [294] or PLX5622 in 1.5-month-old 5xFAD [295] mice prevented intraneuronal amyloid and neuritic plaque formation [294] and significantly reduced plaque formation [295], respectively”
From Microglia and monocytes in inflammatory CNS disease: integrating phenotype and function (2022) · cites this paper as [295]
The cited source says what the claim attributes to it.
In the citing paper
“Thus, even a small number of microglial cells are sufficient to initiate plaque pathology.”
From Microglia and monocytes in inflammatory CNS disease: integrating phenotype and function (2022) · cites this paper as [295]
The cited source says what the claim attributes to it.
In the citing paper
“gene expression analysis showed that pathways related to neuronal function (i.e., glutamate receptors, synaptic vesicles, and neuronal membranes), were downregulated in the hippocampus of 5xFAD mice [295]”
From Microglia and monocytes in inflammatory CNS disease: integrating phenotype and function (2022) · cites this paper as [295]
The cited source says what the claim attributes to it.
In the citing paper
“further implicating microglia in neuronal and/or synaptic loss [294–296]”
From Microglia and monocytes in inflammatory CNS disease: integrating phenotype and function (2022) · cites this paper as [295]
The cited source says what the claim attributes to it.
In the citing paper
“This pattern was reversed in the absence of microglia”
From Microglia and monocytes in inflammatory CNS disease: integrating phenotype and function (2022) · cites this paper as [295]
The cited source says what the claim attributes to it.
In the citing paper
“suggesting that these cells restrict gene expression pathways crucial to neuronal function in AD [295]”
From Microglia and monocytes in inflammatory CNS disease: integrating phenotype and function (2022) · cites this paper as [295]
The cited source says what the claim attributes to it.
In the citing paper
“In this context, microglia appear crucial to the initial appearance and structure of plaques and, following plaque formation, promote a chronic inflammatory state modulating neuronal gene expression changes in response to Aβ during AD pathology [84].”
From Enhanced microglial dynamics and a paucity of tau seeding in the amyloid plaque microenvironment contribute to cognitive resilience in Alzheimer’s disease (2024) · cites this paper as [84]
The cited source says what the claim attributes to it.
In the citing paper
“Similarly, Spangenberg et al. observed a reduction in dense-core plaques in the cortex of the same mouse model following chronic administration of an inhibitor of microglial proliferation [84].”
From Enhanced microglial dynamics and a paucity of tau seeding in the amyloid plaque microenvironment contribute to cognitive resilience in Alzheimer’s disease (2024) · cites this paper as [84]
In the citing paper
“the microglial response to amyloid plaques and/or tau pathology is increasingly thought to cause or contribute heavily to disease-related neurodegeneration [10], [11], [12], [13].”
From Microglia facilitate loss of perineuronal nets in the Alzheimer's disease brain (2020) · cites this paper as [12]
In the citing paper
“Microglia from these mice have been extensively characterized, revealing the canonical upregulation of disease-associated microglial markers (e.g. Cst7, Axl, Trem2, Apoe, Ctss) and loss of homoestatic markers (P2ry12, Tmem119) that reflect disease-related changes in form and function [12, 50, 51].”
From Microglia facilitate loss of perineuronal nets in the Alzheimer's disease brain (2020) · cites this paper as [12]
In the citing paper
“Microglial depletion also enhances performance in certain memory tasks [12, 14, 16] and prevents the forgetting of remote memories, and in association, the dissociation of memory engram cells in healthy adult mice [18].”
From Microglia facilitate loss of perineuronal nets in the Alzheimer's disease brain (2020) · cites this paper as [12]
In the citing paper
“We previously reported that neuronal and synaptic genes (e.g. Dlk2, Kcnq3, Nrg3, Scn1b) and related functional pathways (e.g. synaptic vesicles, glutamate receptors, neuronal membranes) were extensively and uniquely downregulated in the 7mo 5xFAD hippocampus compared to WT hippocampus and other 5xFAD brain regions [12], respectively, in addition to a loss of subiculum neurons and dendritic spines”
From Microglia facilitate loss of perineuronal nets in the Alzheimer's disease brain (2020) · cites this paper as [12]
Self-check
Percentages, sums and reported differences re-computed from the paper’s own numbers.
Each contradiction between two passages listed here was confirmed by an independent check.
Rated minor: it would not touch a result — a value no result rests on, a p-value that stays on the same side of the significance level, or a conflict that is clerical, resolved elsewhere in the paper, or outside its own findings.
In the paper
§ Sustained microglial depletion with CSF1R inhibitor impairs parenchymal plaque development in an Alzheimer’s disease model > Results > Microglial plaque compaction ameliorates neuritic dystrophy
“while the cortex contained only vascular Thio-S+ deposits, in stark contrast to untreated 5xFAD mice (Fig. 6a vs. b).”
§ Sustained microglial depletion with CSF1R inhibitor impairs parenchymal plaque development in an Alzheimer’s disease model > Results > Microglial elimination impairs plaque formation
“With an additional 14 weeks of treatment (i.e., 24 weeks treated animals), microglia were eliminated brain wide (Fig. 4e, k), but Thio-S plaques persisted in these areas (i.e., the thalamus and RS cortex).”
Rated minor: it would not touch a result — a value no result rests on, a p-value that stays on the same side of the significance level, or a conflict that is clerical, resolved elsewhere in the paper, or outside its own findings.
In the paper
§ Sustained microglial depletion with CSF1R inhibitor impairs parenchymal plaque development in an Alzheimer’s disease model > Results > Microglial elimination impairs plaque formation
“With an additional 14 weeks of treatment (i.e., 24 weeks treated animals), microglia were eliminated brain wide (Fig. 4e, k)”
§ Sustained microglial depletion with CSF1R inhibitor impairs parenchymal plaque development in an Alzheimer’s disease model > Results > Microglial plaque compaction ameliorates neuritic dystrophy
“Upon examining caudal brain regions, we found some IBA1+ cells present within the subiculum and associated white matter tracts in the otherwise microglia-devoid 5xFAD animals (mice treated through 1.5–7 months of age; Fig. 6a, b).”
Citations
Cites
R: A Language and Environment for Statistical Computing
R Core Team (2000) · doi:10.32614/r.manuals · Cited by 355,893
STAR: ultrafast universal RNA-seq aligner
Dobin, A., Davis, C. A., Schlesinger, F., Drenkow, J., Zaleski, C., Jha, S., Batut, P., Chaisson, M., & Gingeras, T. R. (2013) · Bioinformatics · doi:10.1093/bioinformatics/bts635 · Cited by 51,709
Robinson, M. D., McCarthy, D. J., & Smyth, G. K. (2010) · Bioinformatics · doi:10.1093/bioinformatics/btp616 · Cited by 41,364
limma powers differential expression analyses for RNA-sequencing and microarray studies
Ritchie, M. E., Phipson, B., Wu, D., Hu, Y., Law, C. W., Shi, W., & Smyth, G. K. (2015) · Nucleic Acids Research · doi:10.1093/nar/gkv007 · Cited by 40,458
Neurotoxic reactive astrocytes are induced by activated microglia
Liddelow, S. A., Guttenplan, K. A., Clarke, L. E., Bennett, F. C., Bohlen, C. J., Schirmer, L., Bennett, M. L., Münch, A. E., Chung, W.-S., Peterson, T. C., et al. (2017) · Nature · doi:10.1038/nature21029 · Cited by 7,971
A Unique Microglia Type Associated with Restricting Development of Alzheimer’s Disease
Keren-Shaul, H., Spinrad, A., Weiner, A., Matcovitch-Natan, O., Dvir-Szternfeld, R., Ulland, T. K., David, E., Baruch, K., Lara-Astaiso, D., Toth, B., et al. (2017) · Cell · doi:10.1016/j.cell.2017.05.018 · Cited by 5,493
Jack, C. R., Knopman, D. S., Jagust, W. J., Petersen, R. C., Weiner, M. W., Aisen, P. S., Shaw, L. M., Vemuri, P., Wiste, H. J., Weigand, S. D., et al. (2013) · The Lancet Neurology · doi:10.1016/s1474-4422(12)70291-0 · Cited by 4,396
Triple-Transgenic Model of Alzheimer’s Disease with Plaques and Tangles
Oddo, S., Caccamo, A., Shepherd, J. D., Murphy, M. P., Golde, T. E., Kayed, R., Metherate, R., Mattson, M. P., Akbari, Y., & LaFerla, F. M. (2003) · Neuron · doi:10.1016/s0896-6273(03)00434-3 · Cited by 4,126
Common structure of soluble amyloid oligomers implies common mechanism of pathogenesis
Kayed, R., Head, E., Thompson, J. L., McIntire, T. M., Milton, S. C., Cotman, C. W., & Glabe, C. G. (2003) · Science · doi:10.1126/science.1079469 · Cited by 4,064
Oakley, H., Cole, S. L., Logan, S., Maus, E., Shao, P., Craft, J., Guillozet-Bongaarts, A., Ohno, M., Disterhoft, J., Van Eldik, L., et al. (2006) · The Journal of Neuroscience · doi:10.1523/jneurosci.1202-06.2006 · Cited by 3,530
Cited by
Sorted by citations
Items 401–500 of 945
Recent advances in colony stimulating factor-1 receptor (CSF1R) inhibitors
Peng, L., Fang, Z., Zhang, W., Rao, G.-W., & Zheng, Q. (2025) · Biochemical Pharmacology · doi:10.1016/j.bcp.2025.117187 · Cited by 19
Zhu, B., Wangzhou, A., Yu, D., Li, T., Schmidt, R., Florencio, S. L. D., Chao, L., Thurber, A. L., Zhou, M., Msheik, Z., et al. (2024) · Neuron · doi:10.1016/j.neuron.2025.06.020 · Cited by 17
Faisal, M., Aid, J., o‘g‘li, N. B. H., Lee, B., & Hickey, M. A. (2023) · PLoS ONE · doi:10.1371/journal.pone.0281003 · Cited by 16
Ennerfelt, H. E., Holliday, C., Shapiro, D. A., Zengeler, K. E., Bolte, A. C., Ulland, T. K., & Lukens, J. R. (2023) · Proceedings of the National Academy of Sciences · doi:10.1073/pnas.2303760120 · Cited by 16
Rahman, M. T., Mostaert, B. J., Hunger, B., Saha, U., Claussen, A. D., Razu, I., Nasrin, F., Khan, N. A., Eckard, P., Coleman, S., et al. (2023) · Journal of Neuroinflammation · doi:10.1186/s12974-023-02955-y · Cited by 16
Jagadeesan, N., Roules, G. C., Chandrashekar, D. V., Yang, J., Kolluru, S., & Sumbria, R. K. (2024) · Journal of Translational Medicine · doi:10.1186/s12967-024-05008-x · Cited by 19
Mathematical models on Alzheimer's disease and its treatment: A review
Maji, M., & Khajanchi, S. (2025) · Physics of Life Reviews · doi:10.1016/j.plrev.2025.01.004 · Cited by 17
Oxidized cholesterol species as signaling molecules in the brain: diabetes and Alzheimer’s disease
Weigel, T. K., Kulas, J. A., & Ferris, H. A. (2019) · Neuronal Signaling · doi:10.1042/ns20190068 · Cited by 16
Braun, D. J., Dimayuga, E. R., Morganti, J. M., & Eldik, L. J. V. (2020) · Journal of Neuroinflammation · doi:10.1186/s12974-020-01938-7 · Cited by 16
A CRISPRi/a platform in iPSC-derived microglia uncovers regulators of disease statesPreprint
Dräger, N. M., Sattler, S. M., Huang, C. T.-L., Teter, O. M., Leng, K., Hashemi, S. H., Hong, J. Y., Aviles, G., Clelland, C. D., Zhan, L., et al. (2021) · bioRxiv (Cold Spring Harbor Laboratory) · doi:10.1101/2021.06.16.448639 · Cited by 16
de Sousa, D. M. B., Benedetti, A., Altendorfer, B., Mrowetz, H., Unger, M. S., Schallmoser, K., Aigner, L., & Kniewallner, K. M. (2023) · Aging · doi:10.18632/aging.204502 · Cited by 15
Liang, S.-Q., Li, P.-H., Hu, Y., Zhao, J., Shao, F.-Z., Kuang, F., Ren, K., Wei, T., Fan, F., Feng, L., et al. (2023) · Frontiers in Immunology · doi:10.3389/fimmu.2023.1193081 · Cited by 16
VEGF controls microglial phagocytic response to amyloid-β
Gea, P. D., Benkeder, S., Bouvet, P., Aimard, M., Chounlamountri, N., Honnorat, J., Do, L.-D., & Meissirel, C. (2023) · Frontiers in Cellular Neuroscience · doi:10.3389/fncel.2023.1264402 · Cited by 19
Ma, L., Zhu, X., Tang, C., Pan, P., Yadav, A., Liang, R., Press, K., Nelson, J., & Su, H. (2024) · Journal of Cerebral Blood Flow & Metabolism · doi:10.1177/0271678x241236008 · Cited by 16
RetractedStrategies to dissect microglia-synaptic interactions during aging and in Alzheimer's disease
Heuer, S. E., Bloss, E. B., & Howell, G. R. (2024) · Neuropharmacology · doi:10.1016/j.neuropharm.2024.109987 · Cited by 16
Loss of TREM2 diminishes CAA despite an overall increase of amyloid load in Tg‐SwDI mice
Zhong, R., Xu, Y., Williams, J. W., & Li, L. (2024) · Alzheimer s & Dementia · doi:10.1002/alz.14222 · Cited by 16
Monocyte Invasion into the Retina Restricts the Regeneration of Neurons from Müller Glia
Blasdel, N., Bhattacharya, S., Donaldson, P. C., Reh, T. A., & Todd, L. J. (2024) · Journal of Neuroscience · doi:10.1523/jneurosci.0938-24.2024 · Cited by 15
Neurodegeneration in a dish: advancing human stem-cell-based models of Alzheimer’s disease
Klimmt, J., Dannert, A., & Paquet, D. (2020) · Current Opinion in Neurobiology · doi:10.1016/j.conb.2020.01.008 · Cited by 16
Klein, H., Schäfer, M. K.-H., Bennett, D. A., Schwender, H. R., & Jager, P. L. D. (2020) · PLoS Computational Biology · doi:10.1371/journal.pcbi.1007771 · Cited by 17
Shin, J., Hwang, Y. S., Jung, B.-K., Seo, S., Ham, D.-W., & Shin, E. (2021) · International Journal of Molecular Sciences · doi:10.3390/ijms22052764 · Cited by 15
van der Wildt, B., Nezam, M., Kooijman, E. J. M., Reyes, S. T., Shen, B., Windhorst, A. D., & Chin, F. T. (2021) · Bioorganic & Medicinal Chemistry · doi:10.1016/j.bmc.2021.116245 · Cited by 15
Romero‐Molina, C., Navarro, V., Jiménez, S., Muñoz‐Castro, C., Sanchez-Mico, M. V., Gutiérrez, A., Vitórica, J., & Vizuete, M. (2021) · International Journal of Molecular Sciences · doi:10.3390/ijms22189734 · Cited by 14
Neurons undergo IFNγ-driven persistent epigenetic shifts and synaptopathy in encephalitis
Shammas, G., Piccinno, M., Égervári, K., Lemeille, S., Mariotte, A., Maltese, F., Panzeri, A., Wagner, I., Fonta, N., Furlan, T., et al. (2025) · Neuron · doi:10.1016/j.neuron.2025.11.006 · Cited by 13
Immunity in Alzheimer’s disease: From mechanisms to therapies
Chen, X., Holtzman, D. M., & Colonna, M. (2026) · Immunity · doi:10.1016/j.immuni.2026.02.004 · Cited by 18
Miller‐Rhodes, P., Li, H., Velagapudi, R., Chiang, W., Terrando, N., & Gelbard, H. A. (2022) · The FASEB Journal · doi:10.1096/fj.202200184rr · Cited by 12
Yousefizadeh, A., Piccioni, G., Saidi, A., Triaca, V., Mango, D., & Nisticò, R. (2022) · Pharmacological Research · doi:10.1016/j.phrs.2022.106404 · Cited by 15
Microglial morphology in the somatosensory cortex across lifespan. A quantitative study
Godeanu, S., Clarke, D., Stopper, L., Deftu, A., Popa‐Wagner, A., Bălşeanu, T. A., Scheller, A., & Cătălin, B. (2023) · Developmental Dynamics · doi:10.1002/dvdy.582 · Cited by 15
Structural basis and selectivity of sulfatinib binding to FGFR and CSF-1R
Lin, Q., Dai, S., Qu, L., Lin, H., Guo, M., Wei, H., Chen, Y., & Chen, X. (2024) · Communications Chemistry · doi:10.1038/s42004-023-01084-0 · Cited by 14
Henningfield, C. M., Soni, N., Lee, R. W., Sharma, R. B., Cleland, J. L., & Green, K. N. (2024) · Alzheimer s Research & Therapy · doi:10.1186/s13195-024-01470-3 · Cited by 14
Self-citationWickel, J., Chung, H., Ceangă, M., von Stackelberg, N., Hahn, N., Candemir, Ö., Baade‐Büttner, C., Mein, N., Tomasini, P., Woldeyesus, D. M., et al. (2024) · Glia · doi:10.1002/glia.24541 · Cited by 13
The microglial P2Y6 receptor as a therapeutic target for neurodegenerative diseases
Dundee, J. M., & Brown, G. C. (2024) · Translational Neurodegeneration · doi:10.1186/s40035-024-00438-5 · Cited by 16
The intricate interplay between microglia and adult neurogenesis in Alzheimer’s disease
Früholz, I., & Meyer‐Luehmann, M. (2024) · Frontiers in Cellular Neuroscience · doi:10.3389/fncel.2024.1456253 · Cited by 16
The multicellular interplay of microglia in health and disease: lessons from leukodystrophy
Berdowski, W. M., Sanderson, L. E., & van Ham, T. J. (2021) · Disease Models & Mechanisms · doi:10.1242/dmm.048925 · Cited by 15
Zhou, Z., Jing, Y., Niu, Y., Chang, T., Sun, J., Guo, C., Wang, Y., & Dou, G. (2022) · Life · doi:10.3390/life12101676 · Cited by 13
Plaque vicinity as a hotspot of microglial turnover in a mouse model of Alzheimer's disease
Olmedillas, M., Brawek, B., Li, K., Richter, C., & Garaschuk, O. (2023) · Glia · doi:10.1002/glia.24458 · Cited by 15
Aspects of the immune system that impact brain function
Bondy, S. C. (2020) · Journal of Neuroimmunology · doi:10.1016/j.jneuroim.2020.577167 · Cited by 14
Zheng, J., Pang, R.-K., Ye, J.-H., Su, S., Shi, J., Qiu, Y.-H., Pan, H., Zheng, R.-Y., Hu, X.-R., Deng, Q.-W., et al. (2024) · Phytomedicine · doi:10.1016/j.phymed.2024.156248 · Cited by 13
Wendt, S., Lin, A. J., Ebert, S. N., Brennan, D. J., Cai, W., Bai, Y., Kong, D. Y., Sorrentino, S., Groten, C. J., Lee, C., et al. (2025) · Journal of Neuroinflammation · doi:10.1186/s12974-025-03433-3 · Cited by 13
Exploring microglial replacement: From disease models to clinical translation
Zhou, K., Wang, Y., Xu, Y., Zhang, Y., & Zhu, C. (2025) · Brain Behavior and Immunity · doi:10.1016/j.bbi.2025.06.011 · Cited by 13
Self-citationPark, K. H. J., & Barrett, T. (2020) · Journal of Alzheimer s Disease Reports · doi:10.3233/adr-200170 · Cited by 12
Samuels, J. D., Lukens, J. R., & Price, R. J. (2023) · Journal of Neurochemistry · doi:10.1111/jnc.15981 · Cited by 13
Miyanishi, K., Hotta-Hirashima, N., Miyoshi, C., Hayakawa, S., Kakizaki, M., Kanno, S., Ikkyu, A., Funato, H., & Yanagisawa, M. (2023) · Neuroscience Research · doi:10.1016/j.neures.2023.11.010 · Cited by 13
Will cellular immunotherapies end neurodegenerative diseases?
Boskovic, P., Gao, W., & Kipnis, J. (2024) · Trends in Immunology · doi:10.1016/j.it.2024.03.006 · Cited by 15
Liu, J. A., Walker, W. H., Meléndez‐Fernández, O. H., Bumgarner, J. R., Zhang, N., Walton, J. C., Meares, G. P., DeVries, A. C., & Nelson, R. J. (2024) · Experimental Neurology · doi:10.1016/j.expneurol.2024.114796 · Cited by 12
Zhao, Y., Peng, Y., Wei, X., Wu, G., Li, B., Li, X., Long, L., Zeng, J., Luo, W., Tian, Y., et al. (2024) · ACS Chemical Neuroscience · doi:10.1021/acschemneuro.4c00060 · Cited by 13
Therapeutic Targets in Innate Immunity to Tackle Alzheimer’s Disease
Serradas, M. L., Ding, Y., Martorell, P., Kulińska, I., & Castro‐Gomez, S. (2024) · Cells · doi:10.3390/cells13171426 · Cited by 16
Brandão, W. N., Jain, N., Yin, Z., Kleemann, K. L., Carpenter, M., Bao, X., Serrano, J. R., Tycksen, E., Durão, A. C. C. D. S., Barry, J., et al. (2025) · Science Translational Medicine · doi:10.1126/scitranslmed.adk3690 · Cited by 13
Larson, K. C., Gergits, F. W., Renoux, A. J., Weisman, E. J., Dejanovic, B., Huang, L., Pandya, B. A., McLaren, D. G., Lynch, B. A., Fisher, R., et al. (2025) · Journal of Neuroinflammation · doi:10.1186/s12974-025-03346-1 · Cited by 14
Strackeljan, L., Baidoe‐Ansah, D., Mirzapourdelavar, H., Jia, S., Kaushik, R., Cangalaya, C., & Dityatev, A. E. (2025) · Experimental Neurology · doi:10.1016/j.expneurol.2025.115186 · Cited by 14
Decoding microglial functions in Alzheimer’s disease: insights from human models
Rao, C., Semrau, S., & Fossati, V. (2025) · Trends in Immunology · doi:10.1016/j.it.2025.02.011 · Cited by 14
Mizobuchi, H., Yamamoto, K., Yamashita, M., Nakata, Y., Inagawa, H., Kohchi, C., & Soma, G. (2021) · Frontiers in Immunology · doi:10.3389/fimmu.2021.650176 · Cited by 14
Membrane Cholesterol Is a Critical Determinant for Hippocampal Neuronal Polarity
Jose, M., Sivanand, A., & Channakeshava, C. (2021) · Frontiers in Molecular Neuroscience · doi:10.3389/fnmol.2021.746211 · Cited by 13
Shaikh, S., Willis, E. F., Dierich, M., Xu, Y., Stuart, S. J. S., Gobe, G. C., Bashaw, A. A., Rawashdeh, O., Kim, S. J., & Vukovic, J. (2023) · Journal of Neuroinflammation · doi:10.1186/s12974-023-02984-7 · Cited by 14
Cerebellar microglia: On the edge between neuroinflammation and neuroregulation
Dukhinova, M., Guo, J., Shen, E.-W., Liu, W., Huang, W., Shen, Y., & Wang, L. (2024) · Neural Regeneration Research · doi:10.4103/nrr.nrr-d-24-00550 · Cited by 15
Topalis, V., Voros, C., & Ziaka, M. (2025) · Journal of Geriatric Psychiatry and Neurology · doi:10.1177/08919887251361578 · Cited by 14
Immunosenescence of brain accelerates Alzheimer’s disease progression
Chen, H.-Y., Zhao, Y. G., & Xie, Y. (2022) · Reviews in the Neurosciences · doi:10.1515/revneuro-2022-0021 · Cited by 12
Cheng, Y., Javonillo, D. I., Pachow, C., Scarfone, V. M., Fernandez, K., Walsh, C. M., Green, K. N., & Lane, T. E. (2023) · Journal of Neuroimmunology · doi:10.1016/j.jneuroim.2023.578133 · Cited by 12
Self-citationShen, Z., Yang, X., Lan, Y., & Chen, G. (2024) · Journal of Alzheimer s Disease · doi:10.3233/jad-231159 · Cited by 13
Mohamed, S. H., Vanhoffelen, E., Fu, M. S., Lau, P. H., Hain, S., Seldeslachts, L., Cosway, E. J., Anderson, G., McCulloch, L. J., Velde, G. V., et al. (2024) · Mucosal Immunology · doi:10.1016/j.mucimm.2024.08.007 · Cited by 10
Le, L., Eliseeva, S. I., Plunk, E. C., Kara-Pabani, K., Li, H., Yarovinsky, F., & Majewska, A. K. (2025) · Cell Reports · doi:10.1016/j.celrep.2024.115176 · Cited by 13
Clec7a Signaling in Microglia Promotes Synapse Loss Associated with Tauopathy
Yang, S., Wang, J., Cao, Y., Zhang, Y., Sun, Z., Wan, P., Pi, M., Xiong, Q., Shu, X., Wang, X., et al. (2025) · International Journal of Molecular Sciences · doi:10.3390/ijms26072888 · Cited by 12
Self-citationGlial phagocytosis for synapse and toxic proteins in neurodegenerative diseases
Choi, Y., & Chung, W. (2025) · Molecular Neurodegeneration · doi:10.1186/s13024-025-00870-9 · Cited by 14
Don’t know what you got till it’s gone: microglial depletion and neurodegeneration
Graykowski, D. R., & Cudaback, E. (2021) · Neural Regeneration Research · doi:10.4103/1673-5374.308078 · Cited by 12
Zhang, C., Liu, Z., Zhang, L., Zhu, A., Liao, F., Wan, J., Zhou, J. E., & Tian, Y. (2020) · Angewandte Chemie · doi:10.1002/ange.202006318 · Cited by 12
Self-citationLi, L., Irie, T., Yoshii, D., Komohara, Y., Fujiwara, Y., Esumi, S., Kadohisa, M., Honda, M., Suzu, S., Matsuura, T., et al. (2022) · Medical Molecular Morphology · doi:10.1007/s00795-022-00323-y · Cited by 12
The Strategies for Treating “Alzheimer’s Disease”: Insulin Signaling May Be a Feasible Target
You, G., Yao, J., Liu, Q., & Li, N. (2022) · Current Issues in Molecular Biology · doi:10.3390/cimb44120421 · Cited by 12
Heuer, S. E., Keezer, K. J., Hewes, A. A., Onos, K. D., Graham, K., Howell, G. R., & Bloss, E. B. (2023) · Alzheimer s & Dementia · doi:10.1002/alz.13440 · Cited by 11
Gaunt, J. R., Zainolabidin, N., Yip, A. K. K., Tan, J. M., Low, A. Y. T., Chen, A. I., & Ch’ng, T. H. (2023) · Journal of Neuroinflammation · doi:10.1186/s12974-023-02913-8 · Cited by 12
CSF1R antagonism results in increased supraspinal infiltration in EAE
Wang, M., Caryotakis, S. E., Smith, G., Nguyen, A. V., Pleasure, D., & Soulika, A. M. (2024) · Journal of Neuroinflammation · doi:10.1186/s12974-024-03063-1 · Cited by 12
Down-regulation of Aquaporin-1 mediates a microglial phenotype switch affecting glioma growth
Hu, F., Huang, Y., Semtner, M., Zhao, K., Tan, Z., Dzaye, O. D. A., Kettenmann, H., Shu, K., & Lei, T. (2020) · Experimental Cell Research · doi:10.1016/j.yexcr.2020.112323 · Cited by 12
Synthesis of novel isoflavone/benzo-δ-sultam hybrids as potential anti-inflammatory drugs
Menghereş, G., Rice, C. R., Olajide, O. A., & Hemming, K. (2020) · Bioorganic & Medicinal Chemistry Letters · doi:10.1016/j.bmcl.2020.127761 · Cited by 12
Microglial cGAS deletion protects against amyloid-β induced Alzheimer’s disease pathogenesisPreprint
He, S., Li, X., Mittra, N., Bhattacharjee, A., Wang, H., Zhao, S., Liu, F., & Han, X. (2023) · bioRxiv (Cold Spring Harbor Laboratory) · doi:10.1101/2023.08.07.552300 · Cited by 12
Jiao, H., Ge, Y., Huang, L.-Y., Liu, Y., Wu, B., Lian, P., Hao, Y., Han, S., Li, Y., Wu, K., et al. (2025) · Molecular Neurodegeneration · doi:10.1186/s13024-025-00887-0 · Cited by 11
Kessels, S., Trippaers, C., Mertens, M., Hamad, I., Rombaut, B., Janssen, A., Ramanathan, K., Duwé, S., Gharghani, A. M., Theuwis, R., et al. (2025) · Science Advances · doi:10.1126/sciadv.adw0128 · Cited by 13
Acyloxyacyl hydrolase regulates microglia-mediated pelvic pain
Rahman-Enyart, A., Yaggie, R. E., Bollinger, J. L., Arvanitis, C., Winter, D. R., Schaeffer, A. J., & Klumpp, D. J. (2022) · PLoS ONE · doi:10.1371/journal.pone.0269140 · Cited by 13
Bhatia, T. N., Jamenis, A. S., Abbas, M., Clark, R. N., Miner, K. M., Chandwani, M. N., Kim, R. E., Hilinski, W. C., O’Donnell, L. A., Luk, K. C., et al. (2023) · Neurobiology of Disease · doi:10.1016/j.nbd.2023.106196 · Cited by 11
Wickstead, E. S. (2023) · Biomedicines · doi:10.3390/biomedicines11082240 · Cited by 11
Microglia-mediated endothelial protection: the role of SHPL-49 in ischemic stroke
Zhao, Y., Zhang, P., & Zhang, J. (2024) · Biomedicine & Pharmacotherapy · doi:10.1016/j.biopha.2024.117530 · Cited by 11
Self-citationLong‐term reprogramming of primed microglia after moderate inhibition of CSF1R signaling
León‐Rodríguez, A., Grondona, J. M., Marín‐Wong, S., López‐Aranda, M. F., & López-Ávalos, M. D. (2024) · Glia · doi:10.1002/glia.24627 · Cited by 13
Cocozza, G., Busdraghi, L. M., Chece, G., Menini, A., Ceccanti, M., Libonati, L., Cambieri, C., Fiorentino, F., Rotili, D., Scavizzi, F., et al. (2024) · Brain Behavior and Immunity · doi:10.1016/j.bbi.2024.12.010 · Cited by 12
Zhang, J., Zhang, Y., Liu, L., Zhang, M., Zhang, X., Deng, J., Zhao, F., Li, Q., Zheng, X., Fu, B., et al. (2025) · Journal of Neuroinflammation · doi:10.1186/s12974-024-03325-y · Cited by 12
Self-citationTranscription factors that define the epigenome structures and transcriptomes in microglia
Saeki, K., & Ozato, K. (2025) · Experimental Hematology · doi:10.1016/j.exphem.2025.104814 · Cited by 11
Klein, D., Yuan, X., Weiß, E. M., & Martini, R. (2021) · Experimental Neurology · doi:10.1016/j.expneurol.2021.113786 · Cited by 11
Battis, K., Florio, J. B., Mante, M., Lana, A. J., Naumann, I., Gauer, C., Lambrecht, V., Müller, S. J., Cobo, I., Fixsen, B. R., et al. (2022) · Journal of Neuroscience · doi:10.1523/jneurosci.0417-22.2022 · Cited by 13
Matuszewska, M., Cieślik, M., Wilkaniec, A., Strawski, M., & Czapski, G. A. (2022) · International Journal of Molecular Sciences · doi:10.3390/ijms24010013 · Cited by 13
Le, Y., Yang, Z.-S., Chen, Y., Chen, D., Yan, L., Wang, Z., & Ouyang, G. (2019) · RSC Advances · doi:10.1039/c9ra08742g · Cited by 11
Henry, R. J., & Loane, D. J. (2020) · Neural Regeneration Research · doi:10.4103/1673-5374.297068 · Cited by 11
Basic Microglial Functions and How They Go Awry in Neurodegenerative Disease
McKinney, J. E., Bennett, M. L., & Bennett, F. C. (2026) · Annual Review of Pathology Mechanisms of Disease · doi:10.1146/annurev-pathmechdis-042624-114332 · Cited by 13
Altomonte, S., & Pike, V. W. (2023) · ACS Pharmacology & Translational Science · doi:10.1021/acsptsci.3c00213 · Cited by 11
Microglia either promote or restrain TRAIL-mediated excitotoxicity caused by Aβ1−42 oligomers
Zou, J., McNair, E. M., DeCastro, S., Lyons, S. P., Mordant, A. L., Herring, L. E., Vetreno, R. P., & Coleman, L. G. (2024) · Journal of Neuroinflammation · doi:10.1186/s12974-024-03208-2 · Cited by 13
Lead Acetate Exposure and Cerebral Amyloid Accumulation: Mechanistic Evaluations in APP/PS1 Mice
Gu, H., Liu, L. L., Wu, A., Yu, Y., Emir, U. E., Sawiak, S. J., Territo, P. R., Farlow, M. R., Zheng, W., & Du, Y. (2024) · Environmental Health Perspectives · doi:10.1289/ehp14384 · Cited by 14
The role of microglia in the prion-like transmission of protein aggregates in neurodegeneration
Öztürk, M. M., Emgård, J., García‐Revilla, J., Fernández‐Calle, R., Yang, Y., Deierborg, T., & Roos, T. T. (2025) · Brain Communications · doi:10.1093/braincomms/fcaf087 · Cited by 14
Wang, Y., Wang, X., Abdullatif, S. A., Homma, S. T., Alekseyev, Y. O., & Zhou, L. (2025) · Proceedings of the National Academy of Sciences · doi:10.1073/pnas.2410095122 · Cited by 10
Dongre, P., Ramesh, M., Govindaraju, T., & Inamdar, M. S. (2025) · Journal of Neuroinflammation · doi:10.1186/s12974-025-03415-5 · Cited by 14
Roles of Microglia in AD Pathology
Gao, R., Wu, H., Li, Q., & Zhao, J. (2023) · Current Alzheimer Research · doi:10.2174/1567205020666230203112351 · Cited by 10
Ricciardi, N. R., Modarresi, F., Lohse, I., Andrade, N. S., Newman, I. A., Brown, J. M., Borja, C., Marples, B., Wahlestedt, C., & Volmar, C. (2023) · Molecular Neurobiology · doi:10.1007/s12035-023-03373-0 · Cited by 11
Anti-Aβ antibodies bound to neuritic plaques enhance microglia activity and mitigate tau pathology
Laversenne, V., Nazeeruddin, S., Källstig, E., Colin, P., Voize, C., & Schneider, B. L. (2020) · Acta Neuropathologica Communications · doi:10.1186/s40478-020-01069-3 · Cited by 11
Wickstead, E. S., Irving, M. A., Getting, S. J., & McArthur, S. (2021) · FEBS Journal · doi:10.1111/febs.15861 · Cited by 10
Hu, Y., Zhou, L., Wang, Z., Ye, Z., Liu, H., Lü, Y., Qi, Z., Yang, K., Zeng, J., Li, H., et al. (2024) · Advanced Functional Materials · doi:10.1002/adfm.202401383 · Cited by 9
Microglia replacement by peripheral delivery of CSF1R inhibitor-resistant hematopoietic cells
Lombroso, S. I., Church, E. I., Anderson, R. N., O’Brien, C. A., Zhu, Y., Dar, A. A., Purnell, F. S., Levitt, E. M., Temsamrit, B., Yaqoob, F., et al. (2025) · Molecular Therapy · doi:10.1016/j.ymthe.2025.10.050 · Cited by 10
Metadata
- Authors
- Spangenberg, E., Severson, P. L., Hohsfield, L. A., Crapser, J., Zhang, J., Burton, E. A., Zhang, Y., Spevak, W., Lin, J., Phan, N. Y., Habets, G., Rymar, A., Tsang, G., Walters, J., Nespi, M., Singh, P., Broome, S., Ibrahim, P., Zhang, C., Bollag, G., West, B. L., & Green, K. N.
- Affiliations
- University of California, Irvine (US)
- Plexxikon (United States) (US)
- Corresponding author
- Green, Kim N.
- ORCID
- Venue
- Nature Communications
- Published
- 2019-08-21
- Volume
- 10
- Issue
- 1
- Pages
- 3758-3758
- ISSN
- 2041-1723 (ISSN-L)
- PMC
- PMC6704256
- OpenAlex
- W2969940182
- Semantic Scholar
- 3e694fe2e99a78fdb9cd33e218acd99a93cc12a0
- Cited by
- 939
- References
- 71
- Citations by year
- 2026: 114 · 2025: 122 · 2024: 201 · 2023: 139 · 2022: 137 · 2021: 132 · 2020: 82 · 2019: 10
- FWCI
- 39.95
- Type
- journal article
- Language
- en
- Open access
- gold
- doi.org
- Locations
- Nature Communications (publishedVersion, cc-by)
- Europe PMC (PubMed Central) (publishedVersion, cc-by)
- PubMed Central (publishedVersion, cc-by)
- PubMed (publishedVersion)
- RePEc: Research Papers in Economics (submittedVersion)
- DOAJ (DOAJ: Directory of Open Access Journals) (submittedVersion)
- DOAJ (DOAJ: Directory of Open Access Journals) (submittedVersion, cc-by-sa)
- eScholarship (California Digital Library) (submittedVersion)
- eScholarship (California Digital Library) (submittedVersion, cc-by)
- OSTI OAI (U.S. Department of Energy Office of Scientific and Technical Information) (submittedVersion, cc-by)
- Funders
- U.S. Department of Energy (-AC02-05CH11231, 05CH11231, DE AC02 05CH11231, DE-AC02-)
- Alzheimer's Association (AARF-16-442762)
- National Institutes of Health (DE-AC02–05CH11231)
- Office of Science (DEAC02–05CH11231, AC02-05CH11231, DE-AC02)
- National Institute on Aging (R01 AG056768, T32 AG00096, P50AG016573, F31AG059367, RF1AG056768, T32AG000096)
- National Institute of Neurological Disorders and Stroke (R01NS083801, R01AG056768)
- Topics
- Life Sciences › Neuroscience › Neurology › Neuroinflammation and Neurodegeneration Mechanisms
- Life Sciences › Neuroscience › Cellular and Molecular Neuroscience › Alzheimer's disease research and treatments
- Life Sciences › Neuroscience › Neurology › Neurological Disease Mechanisms and Treatments
- Keywords
- Alzheimer's disease, microglia, CSF1R inhibition, PLX5622, microglial depletion, amyloid plaques, 5xFAD mice, cerebral amyloid angiopathy, amyloid-beta deposition, disease-associated microglia, hippocampus
- MeSH terms
- Alzheimer Disease, Animals, Behavior, Animal, Brain, Disease Models, Animal, Gene Expression Regulation, Hippocampus, Humans, Memory, Mice, Transgenic, Organic Chemicals, Receptors, Granulocyte-Macrophage Colony-Stimulating Factor, Microglia, Mice, Plaque, Amyloid, Transcriptome
About these checks
Registry, retraction, Cites and statistics results are computed, not judged, with one exception: a printed reference that no index lists is read once by a model before it counts as a citation error. Claims are extracted by a model and kept only when their quote appears verbatim in the text; each cited source is then checked, with a model’s help, for whether it says what the claim relies on. Those verdicts can be wrong — read the claim’s quote and the cited source before relying on one.
A language model drew the claims from the paper on 2026-10-06, under version 3 of the claim definition (model deepseek-v4.1-flash, prompt extract-v3).
A second model labelled each claim on 2026-10-06 (model jev-1.13-20260917, definition revision gold-guideline-v0.2).
Cited sources are checked with a language model’s help (gpt-6-sol).
Statistics and arithmetic are recomputed, not judged.
Confidence bands are shown only for fields calibrated on our annotated test set. None is calibrated yet, so no band is shown.
What counts as a claim ›How we measure confidence ›How we check this ›
Are you an author, or do you see a problem with this page? Request a review
