

The DOI matches its Crossref record; 49 of the 49 references it cites were found in a registry or an index.
Vegetation structural change since 1981 significantly enhanced the terrestrial carbon sink
Open accessAbstract
Abstract Satellite observations show that leaf area index (LAI) has increased globally since 1981, but the impact of this vegetation structural change on the global terrestrial carbon cycle has not been systematically evaluated. Through process-based diagnostic ecosystem modeling, we find that the increase in LAI alone was responsible for 12.4% of the accumulated terrestrial carbon sink (95 ± 5 Pg C) from 1981 to 2016, whereas other drivers of CO 2 fertilization, nitrogen deposition, and climate change (temperature, radiation, and precipitation) contributed to 47.0%, 1.1%, and −28.6% of the sink, respectively. The legacy effects of past changes in these drivers prior to 1981 are responsible for the remaining 65.5% of the accumulated sink from 1981 to 2016. These results refine the attribution of the land sink to the various drivers and would help constrain prognostic models that often have large uncertainties in simulating changes in vegetation and their impacts on the global carbon cycle.
Overview
The claims and statistics of this paper haven’t been checked yet.
Run the check — free, no account needed. It reads the open-access text and checks the sources it cites.
Integrity signals
Registry
Cites
Statistics
Figures
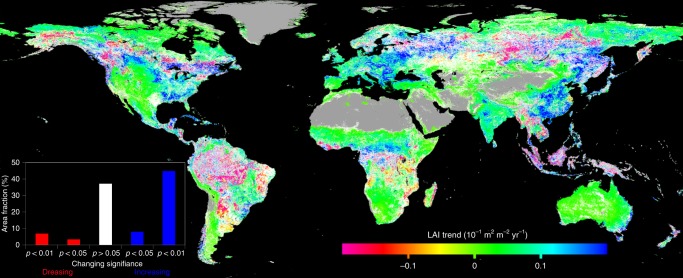
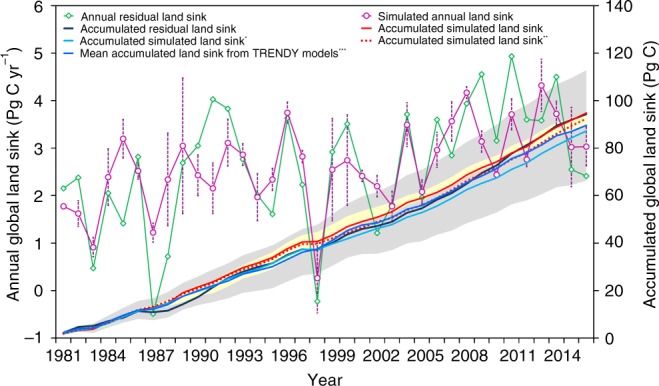
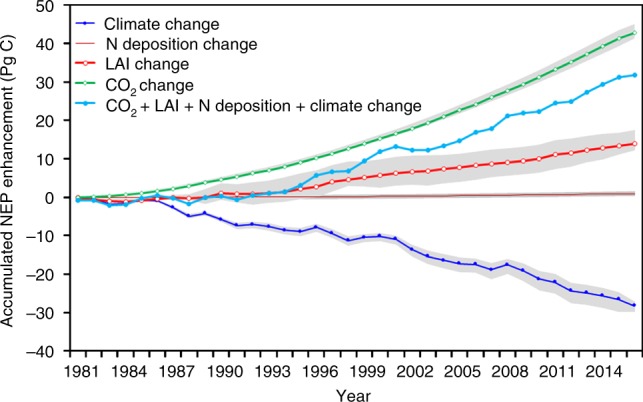
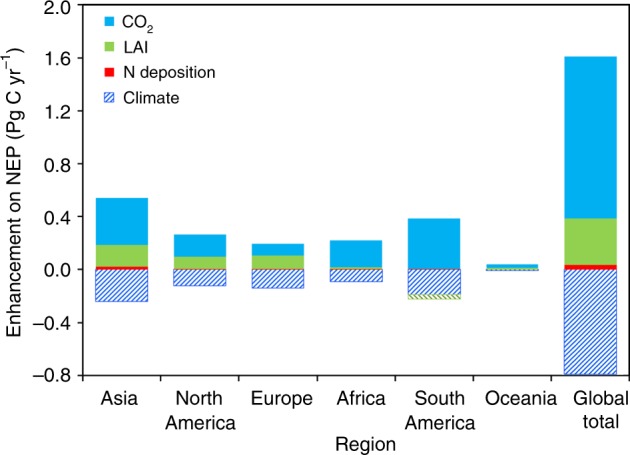
Verification
Claims the paper makes
The claims and statistics of this paper haven’t been checked yet.
Run the check — free, no account needed. It reads the open-access text and checks the sources it cites.
Claims other papers make about this one
Each is checked against this paper’s own text: does it say what the citing paper says it does?
In the citing paper
“Its estimation is complex, and results from many models differ considerably.346”
From Technologies and perspectives for achieving carbon neutrality (2021) · cites this paper as [346]
In the citing paper
“Many current models cannot effectively simulate these factors and estimate the C sink.”
From Technologies and perspectives for achieving carbon neutrality (2021) · cites this paper as [346]
Self-check
Percentages, sums and reported differences re-computed from the paper’s own numbers.
The self-check needs the paper’s full text.
Citations
Cites
A biochemical model of photosynthetic CO2 assimilation in leaves of C3 species
Farquhar, G. D., von Caemmerer, S., & Berry, J. A. (1980) · Planta · doi:10.1007/bf00386231 · Cited by 8,796
Terrestrial ecosystem production: A process model based on global satellite and surface data
Potter, C. S., Randerson, J. T., Field, C. B., Matson, P. A., Vitousek, P. M., Mooney, H. A., & Klooster, S. A. (1993) · Global Biogeochemical Cycles · doi:10.1029/93gb02725 · Cited by 3,023
Greening of the Earth and its drivers
Zhu, Z., Piao, S., Myneni, R. B., Huang, M., Zeng, Z., Canadell, J. G., Ciais, P., Sitch, S., Friedlingstein, P., Arneth, A., et al. (2016) · Nature Climate Change · doi:10.1038/nclimate3004 · Cited by 2,779
Self-citationAn extended AVHRR 8‐km NDVI dataset compatible with MODIS and SPOT vegetation NDVI data
Tucker, C. J., Pinzón, J. E. D., Brown, M. E., Slayback, D. A., Pak, E. W., Mahoney, R. L., Vermote, E. F., & Saleous, N. (2005) · International Journal of Remote Sensing · doi:10.1080/01431160500168686 · Cited by 2,310
Global land change from 1982 to 2016
Song, X.-P., Hansen, M. C., Stehman, S. V., Potapov, P. V., Tyukavina, A., Vermote, E. F., & Townshend, J. R. (2018) · Nature · doi:10.1038/s41586-018-0411-9 · Cited by 1,946
Defining leaf area index for non‐flat leaves
Chen, J., & Black, T. A. (1992) · Plant Cell & Environment · doi:10.1111/j.1365-3040.1992.tb00992.x · Cited by 1,485
Self-citationSitch, S. A., Huntingford, C., Gedney, N., Levy, P., Lomas, M., Piao, S. L., Betts, R., Ciais, P., Cox, P. M., Friedlingstein, P., et al. (2008) · Global Change Biology · doi:10.1111/j.1365-2486.2008.01626.x · Cited by 1,346
Self-citationParton, W. J., Scurlock, J. M. O., Ojima, D. S., Gilmanov, T. G., Scholes, R. J., Schimel, D. S., Kirchner, T., Menaut, J., Seastedt, T., Garcia Moya, E., et al. (1993) · Global Biogeochemical Cycles · doi:10.1029/93gb02042 · Cited by 1,319
Quéré, C. L., Andrew, R. M., Friedlingstein, P., Sitch, S. A., Pongratz, J., Manning, A. C., Korsbakken, J. I., Peters, G. P., Canadell, J. G., Jackson, R. B., et al. (2018) · Earth system science data · doi:10.5194/essd-10-405-2018 · Cited by 1,229
Self-citationUncertainties in CMIP5 Climate Projections due to Carbon Cycle Feedbacks
Friedlingstein, P., Meinshausen, M. A., Arora, V. K., JONES, C. D., Anav, A., Liddicoat, S. K., & Knutti, R. (2013) · Journal of Climate · doi:10.1175/jcli-d-12-00579.1 · Cited by 1,082
Research works printed but not linked: 1
- Chen, J. M. in Comprehensive Remote Sensing, Vol. 3 (ed. Liang, S.) Pages 53–77, ISBN 9780128032213, https://doi.org/10.1016/B978-0-12-409548-9.10540-82018 (Elsevier, Oxford, 2017). · DOI
Cited by
Sorted by citations
Items 501–504 of 504
Zhang, S., Adeli, A., Shi, H., Cao, H., Wang, Y., Chen, W., Weiwei, Z., Gang, C., Li, Q., & Makenova, S. K. (2026) · Applied Geography · doi:10.1016/j.apgeog.2026.104205
Enhanced subseasonal decoupling of greenness and photosynthesis under rapid drying
Liu, Z., & Huang, K. (2026) · Global and Planetary Change · doi:10.1016/j.gloplacha.2026.105760
Sang, Y., Wang, C., Zhang, L., He, M., Kim, Y., Qu, S., Zhao, Q., He, Y., & Wang, X. (2026) · Agricultural and Forest Meteorology · doi:10.1016/j.agrformet.2026.111508
Elevated CO 2 mitigated warming-enhanced carbon loss from northern peatland
Zhou, J., Quan, Q., Huang, W., Hanson, P. J., Ricciuto, D. M., Mayes, M. A., Griffiths, N. A., Salmon, V. G., Weber, S. E., Warren, J. M., et al. (2026) · Science Advances · doi:10.1126/sciadv.aek1491
Metadata
- Authors
- Chen, J. M., Ju, W., Ciais, P., Viovy, N., Liu, R., Liu, Y., & Lu, X.
- Affiliations
- University of Toronto (CA)
- Jiangsu Center for Collaborative Innovation in Geographical Information Resource Development and Application (CN)
- Centre National de la Recherche Scientifique (FR)
- Chinese Academy of Sciences (CN)
- Nanjing University (CN)
- Corresponding author
- Ju, Weimin
- Venue
- Nature Communications
- Published
- 2019-09-18
- Volume
- 10
- Issue
- 1
- Pages
- 4259-4259
- ISSN
- 2041-1723 (ISSN-L)
- PMC
- PMC6751163
- OpenAlex
- W2973497171
- Cited by
- 492
- References
- 49
- Citations by year
- 2026: 50 · 2025: 89 · 2024: 119 · 2023: 93 · 2022: 75 · 2021: 41 · 2020: 22 · 2019: 3
- FWCI
- 18.14
- Type
- journal article
- Language
- en
- Open access
- gold
- doi.org
- Locations
- Nature Communications (publishedVersion, cc-by)
- Europe PMC (PubMed Central) (publishedVersion, cc-by)
- PubMed Central (publishedVersion, cc-by)
- PubMed (publishedVersion)
- HAL (submittedVersion, other-oa)
- RePEc: Research Papers in Economics (submittedVersion)
- DOAJ (DOAJ: Directory of Open Access Journals) (submittedVersion, cc-by-sa)
- DOAJ (DOAJ: Directory of Open Access Journals) (submittedVersion)
- Funders
- National Key R&D Program of China
- Topics
- Physical Sciences › Environmental Science › Global and Planetary Change › Plant Water Relations and Carbon Dynamics
- Physical Sciences › Environmental Science › Ecology › Remote Sensing in Agriculture
- Physical Sciences › Environmental Science › Global and Planetary Change › Land Use and Ecosystem Services
- Keywords
- terrestrial carbon sink, leaf area index, CO2 fertilization, nitrogen deposition, legacy effects, carbon cycle, satellite remote sensing of vegetation, ecosystem modeling
About these checks
Registry, retraction, Cites and statistics results are computed, not judged, with one exception: a printed reference that no index lists is read once by a model before it counts as a citation error. Claims are extracted by a model and kept only when their quote appears verbatim in the text; each cited source is then checked, with a model’s help, for whether it says what the claim relies on. Those verdicts can be wrong — read the claim’s quote and the cited source before relying on one.
Statistics and arithmetic are recomputed, not judged.
Confidence bands are shown only for fields calibrated on our annotated test set. None is calibrated yet, so no band is shown.
What counts as a claim ›How we measure confidence ›How we check this ›
Are you an author, or do you see a problem with this page? Request a review
