Cited by 129Neural and Behavioral Psychology StudiesNeurotransmitter Receptor Influence on BehaviorMemory and Neural Mechanisms

The DOI matches its Crossref record; 126 of the 126 references it cites were found in a registry or an index.

A neural network for information seeking

Open access

Published version of a preprint

Abstract

Humans and other animals often show a strong desire to know the uncertain rewards their future has in store, even when they cannot use this information to influence the outcome. However, it is unknown how the brain predicts opportunities to gain information and motivates this information-seeking behavior. Here we show that neurons in a network of interconnected subregions of primate anterior cingulate cortex and basal ganglia predict the moment of gaining information about uncertain rewards. Spontaneous increases in their information prediction signals are followed by gaze shifts toward objects associated with resolving uncertainty, and pharmacologically disrupting this network reduces the motivation to seek information. These findings demonstrate a cortico-basal ganglia mechanism responsible for motivating actions to resolve uncertainty by seeking knowledge about the future.

Overview

The claims and statistics of this paper haven’t been checked yet.

Run the check — free, no account needed. It reads the open-access text and checks the sources it cites.

A few free checks a day · papers already verified open instantly · results are public

Integrity signals

Registry

Crossref · 10.1038/s41467-019-13135-z

Cites

126 of 126 references verified0 citation errors · 0 not checkable

Statistics

Figures

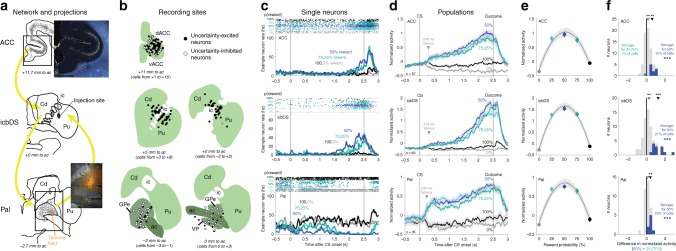
Fig. 1 A cortico-basal ganglia network signals reward uncertainty. a ACC–icbDS–Pal network. Lucifer yellow was injected in icbDS (middle, black area). Retrogradely labeled cell bodies (gray) were found in ACC (top; inset) and Pal (bottom). Anterogradely labeled fibers (orange area) were found in Pal (bottom; inset). ic: internal capsule, Cd: caudate nucleus, Pu: putamen, dACC: dorsal ACC, Pal: pallidum, vACC: ventral ACC, ac: anterior commissure, GPe: globus pallidus external segment, VP: ventral pallidum. Text indicates the plane’s anterior-posterior position relative to the midline anterior commissure. Scale bar: 2 mm. b Reconstruction of recording sites. Circles indicate locations of neurons that responded to uncertainty with significant excitation (black) or inhibition (white). Structures are shown in the coronal plane. Neurons are projected onto the nearest shown plane; text indicates the range of neuron locations. c Example neurons in each area. The neurons have excitatory or inhibitory ramping activity up to the time of uncertain reward: strongest for highly uncertain rewards (blue, 50%), strong for intermediately uncertain rewards (turquoise colors, 25 and 75%), and weak for certain outcomes (black, 100%; gray, 0%). Top: spike times (dots) on each trial (rows). Bottom: smoothed firing rates. d Population average normalized activity of uncertainty coding neurons in each area. Shaded areas are ± 1 SE. Arrow and text indicate latency of uncertainty coding. Gray area below x-axis is the pre-outcome analysis window. e Population average pre-outcome normalized activity is well fitted with a second-order polynomial function of reward probability (gray lines; shaded areas are ± 1 bootstrap SE) showing the inverted-U relationship with reward probability expected for uncertainty coding. f Graded coding of reward uncertainty. Histograms show each neuron’s difference in normalized activity between CSs with high (50%) vs. intermediate (25, 75%) uncertainty. Colored neurons have significantly differential activity: more normalized activity for high uncertainty (blue) or intermediate uncertainty (turquoise). *** indicates more neurons than expected by chance (p ≤ 0.001, binomial test). Arrows indicate means of all neurons (open arrow) and all neurons with significant differential activity (filled arrows); **, *** indicate the significance of their difference from zero, p < 0.01, 0.001 (signed-rank tests)
Fig. 1 A cortico-basal ganglia network signals reward uncertainty. a ACC–icbDS–Pal network. Lucifer yellow was injected in icbDS (middle, black area). Retrogradely labeled cell bodies (gray) were found in ACC (top; inset) and Pal (bottom). Anterogradely labeled fibers (orange area) were found in Pal (bottom; inset). ic: internal capsule, Cd: caudate nucleus, Pu: putamen, dACC: dorsal ACC, Pal: pallidum, vACC: ventral ACC, ac: anterior commissure, GPe: globus pallidus external segment, VP: ventral pallidum. Text indicates the plane’s anterior-posterior position relative to the midline anterior commissure. Scale bar: 2 mm. b Reconstruction of recording sites. Circles indicate locations of neurons that responded to uncertainty with significant excitation (black) or inhibition (white). Structures are shown in the coronal plane. Neurons are projected onto the nearest shown plane; text indicates the range of neuron locations. c Example neurons in each area. The neurons have excitatory or inhibitory ramping activity up to the time of uncertain reward: strongest for highly uncertain rewards (blue, 50%), strong for intermediately uncertain rewards (turquoise colors, 25 and 75%), and weak for certain outcomes (black, 100%; gray, 0%). Top: spike times (dots) on each trial (rows). Bottom: smoothed firing rates. d Population average normalized activity of uncertainty coding neurons in each area. Shaded areas are ± 1 SE. Arrow and text indicate latency of uncertainty coding. Gray area below x-axis is the pre-outcome analysis window. e Population average pre-outcome normalized activity is well fitted with a second-order polynomial function of reward probability (gray lines; shaded areas are ± 1 bootstrap SE) showing the inverted-U relationship with reward probability expected for uncertainty coding. f Graded coding of reward uncertainty. Histograms show each neuron’s difference in normalized activity between CSs with high (50%) vs. intermediate (25, 75%) uncertainty. Colored neurons have significantly differential activity: more normalized activity for high uncertainty (blue) or intermediate uncertainty (turquoise). *** indicates more neurons than expected by chance (p ≤ 0.001, binomial test). Arrows indicate means of all neurons (open arrow) and all neurons with significant differential activity (filled arrows); **, *** indicate the significance of their difference from zero, p < 0.01, 0.001 (signed-rank tests)CC BY · PubMed Central
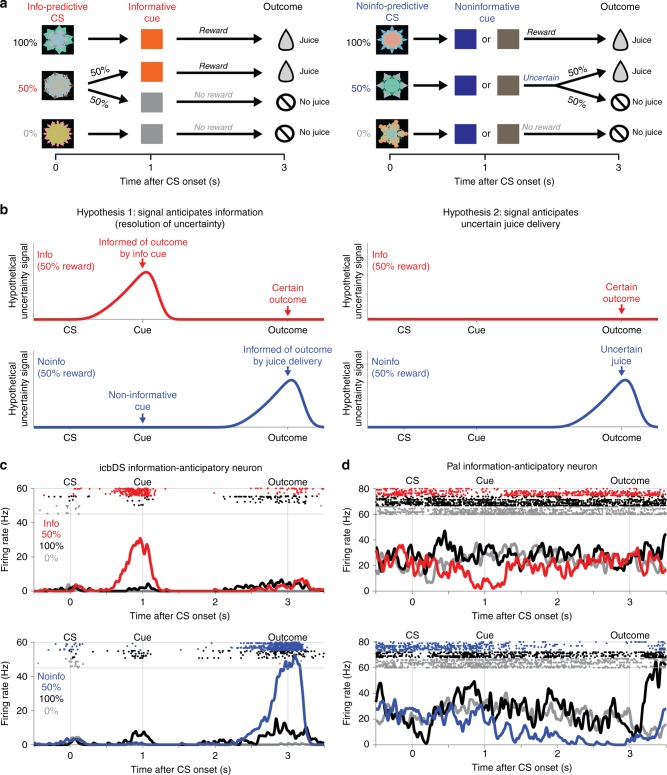
Fig. 2 Neuronal activity anticipating the moment of gaining information to resolve reward uncertainty. a Information task. On Info CS trials, CSs predict 100, 50, or 0% reward, and are followed by an informative cue that indicates the outcome with certainty. On Noinfo CS trials, analogous CSs are followed by one of two noninformative cues that are randomized, and hence leave the outcome uncertain until it is delivered at the end of the trial. b Testing two hypotheses about the origin of uncertainty-related activity. In Hypothesis 1 (left), activity on 50% reward trials anticipates the moment of gaining information about the uncertain outcome, and hence anticipates both informative cues (top, red, Info CS) and uncertain outcomes (bottom, blue, Noinfo CS). In Hypothesis 2 (right), activity simply anticipates uncertain outcome delivery, and hence has no differential activity during the CS period because it only anticipates uncertain outcomes (bottom, blue, Noinfo CS). c An icbDS neuron with information-anticipatory activity. This neuron has strong ramping activation on 50% reward trials that anticipates informative cues (top, red, Info CS) and uncertain outcomes (bottom, blue, Noinfo CS). Its activity is greatly reduced or absent when the outcome is certain (100% reward, black; 0% reward, gray). d An example Pal neuron with information-anticipatory activity. This neuron has a similar response pattern but with ramping inhibition rather than excitation
Fig. 2 Neuronal activity anticipating the moment of gaining information to resolve reward uncertainty. a Information task. On Info CS trials, CSs predict 100, 50, or 0% reward, and are followed by an informative cue that indicates the outcome with certainty. On Noinfo CS trials, analogous CSs are followed by one of two noninformative cues that are randomized, and hence leave the outcome uncertain until it is delivered at the end of the trial. b Testing two hypotheses about the origin of uncertainty-related activity. In Hypothesis 1 (left), activity on 50% reward trials anticipates the moment of gaining information about the uncertain outcome, and hence anticipates both informative cues (top, red, Info CS) and uncertain outcomes (bottom, blue, Noinfo CS). In Hypothesis 2 (right), activity simply anticipates uncertain outcome delivery, and hence has no differential activity during the CS period because it only anticipates uncertain outcomes (bottom, blue, Noinfo CS). c An icbDS neuron with information-anticipatory activity. This neuron has strong ramping activation on 50% reward trials that anticipates informative cues (top, red, Info CS) and uncertain outcomes (bottom, blue, Noinfo CS). Its activity is greatly reduced or absent when the outcome is certain (100% reward, black; 0% reward, gray). d An example Pal neuron with information-anticipatory activity. This neuron has a similar response pattern but with ramping inhibition rather than excitationCC BY · PubMed Central
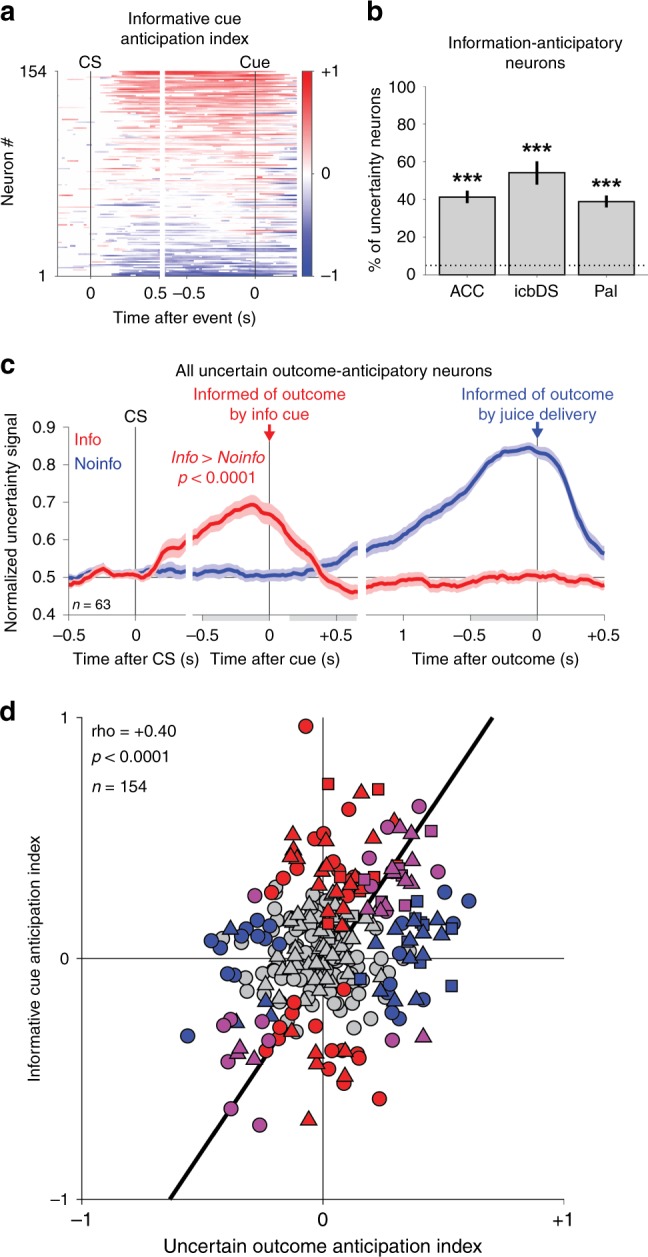
Fig. 3 Prevalence of information-anticipatory activity in the cortico-basal ganglia network. a Uncertainty-related activity emerges preferentially during the Info CS in anticipation of informative cues. Each row is a neuron, and colors indicate time points with a significant Informative Cue Anticipation Index (red: more positive uncertainty signal for Info, top; blue: more negative uncertainty signal for Info, bottom; color bar indicates scale). b Information-anticipatory activity was significantly present in many uncertainty-related neurons in each area (ACC, icbDS, and Pal: n = 26/63, 13/24, and 26/67). *** indicates significantly more neurons than expected by chance, (p < 0.001, binomial test). c Information-anticipatory activity was prevalent in neurons anticipating uncertain outcomes. Shown are the population average uncertainty signals on Info CS (red) and Noinfo CS (blue) trials from the subset of neurons with a significant Uncertain Outcome Anticipation Index (blue, index measured only using Noinfo CS trials). The population has clear activity on Info CS trials in anticipation of viewing informative cues (red, text indicates p-value, rank-sum test). Error bars are ± 1 SE. Gray-shaded areas are the time windows for calculating the indexes of cue anticipation (pre-cue window) and outcome anticipation (post-cue, pre-outcome windows). d Correlated anticipation of the two reward-informative task events. Many neurons have significant Informative Cue Anticipation Indexes (red, y-axis, p < 0.05, permutation test), Uncertain Outcome Anticipation Indexes (blue, x-axis), or both (purple). The two indexes are highly correlated; text indicates rank correlation and its p-value. ACC, icbDS, and Pal neurons are indicated by triangles, squares, and circles. Black line is a linear fit with type 2 regression
Fig. 3 Prevalence of information-anticipatory activity in the cortico-basal ganglia network. a Uncertainty-related activity emerges preferentially during the Info CS in anticipation of informative cues. Each row is a neuron, and colors indicate time points with a significant Informative Cue Anticipation Index (red: more positive uncertainty signal for Info, top; blue: more negative uncertainty signal for Info, bottom; color bar indicates scale). b Information-anticipatory activity was significantly present in many uncertainty-related neurons in each area (ACC, icbDS, and Pal: n = 26/63, 13/24, and 26/67). *** indicates significantly more neurons than expected by chance, (p < 0.001, binomial test). c Information-anticipatory activity was prevalent in neurons anticipating uncertain outcomes. Shown are the population average uncertainty signals on Info CS (red) and Noinfo CS (blue) trials from the subset of neurons with a significant Uncertain Outcome Anticipation Index (blue, index measured only using Noinfo CS trials). The population has clear activity on Info CS trials in anticipation of viewing informative cues (red, text indicates p-value, rank-sum test). Error bars are ± 1 SE. Gray-shaded areas are the time windows for calculating the indexes of cue anticipation (pre-cue window) and outcome anticipation (post-cue, pre-outcome windows). d Correlated anticipation of the two reward-informative task events. Many neurons have significant Informative Cue Anticipation Indexes (red, y-axis, p < 0.05, permutation test), Uncertain Outcome Anticipation Indexes (blue, x-axis), or both (purple). The two indexes are highly correlated; text indicates rank correlation and its p-value. ACC, icbDS, and Pal neurons are indicated by triangles, squares, and circles. Black line is a linear fit with type 2 regressionCC BY · PubMed Central
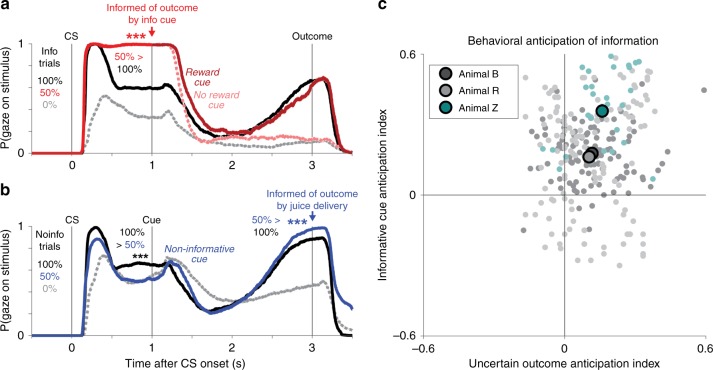
Fig. 4 Monkeys anticipate the moment of gaining information by gazing at objects associated with the uncertain outcome. a Monkeys’ gaze on Info trials is attracted to CSs in anticipation of receiving informative cues about uncertain rewards. Lines indicate the probability at each millisecond that the animal gazes at the stimulus. Shaded areas indicate ± 1 SE (most too small to see). Monkeys gazed more at the 100% CS (black) than the 0% CS (gray), but gazed most of all at the uncertain 50% CS (red) which could be followed by informative cues indicating either reward (dark red) or no reward (pink). Gaze at reward cues then ramped up to the time of reward delivery, while gaze at no-reward cues was minimal. The data are from all n = 68 sessions of the version of the information task with the displayed task timing parameters. *** indicates p < 0.001 (signed-rank test) of the difference indicated by the text at the moment of a task event. b Gaze on Noinfo trials is attracted to objects in anticipation of outcome delivery. Same format as (a). During the CS period, monkeys had roughly value-based gaze behavior (100% > 50% > 0%), but during the cue period their gaze on 50% reward trials ramped up in anticipation of the uncertain outcome until it became greater than all other conditions (50% > 100% > 0%). c Uncertainty-related gaze behavior in each animal significantly anticipated informative cues (y-axis) and uncertain outcomes (x-axis). The data are from n = 112, 151, 29 sessions from animals A, R, Z. Same format as Fig. 3d, but analyzing gaze instead of neural activity. Colors indicate animals; light dots are single sessions; dark circles are means in each animal, error bars are ± 1 SE (most too small to see)
Fig. 4 Monkeys anticipate the moment of gaining information by gazing at objects associated with the uncertain outcome. a Monkeys’ gaze on Info trials is attracted to CSs in anticipation of receiving informative cues about uncertain rewards. Lines indicate the probability at each millisecond that the animal gazes at the stimulus. Shaded areas indicate ± 1 SE (most too small to see). Monkeys gazed more at the 100% CS (black) than the 0% CS (gray), but gazed most of all at the uncertain 50% CS (red) which could be followed by informative cues indicating either reward (dark red) or no reward (pink). Gaze at reward cues then ramped up to the time of reward delivery, while gaze at no-reward cues was minimal. The data are from all n = 68 sessions of the version of the information task with the displayed task timing parameters. *** indicates p < 0.001 (signed-rank test) of the difference indicated by the text at the moment of a task event. b Gaze on Noinfo trials is attracted to objects in anticipation of outcome delivery. Same format as (a). During the CS period, monkeys had roughly value-based gaze behavior (100% > 50% > 0%), but during the cue period their gaze on 50% reward trials ramped up in anticipation of the uncertain outcome until it became greater than all other conditions (50% > 100% > 0%). c Uncertainty-related gaze behavior in each animal significantly anticipated informative cues (y-axis) and uncertain outcomes (x-axis). The data are from n = 112, 151, 29 sessions from animals A, R, Z. Same format as Fig. 3d, but analyzing gaze instead of neural activity. Colors indicate animals; light dots are single sessions; dark circles are means in each animal, error bars are ± 1 SE (most too small to see)CC BY · PubMed Central
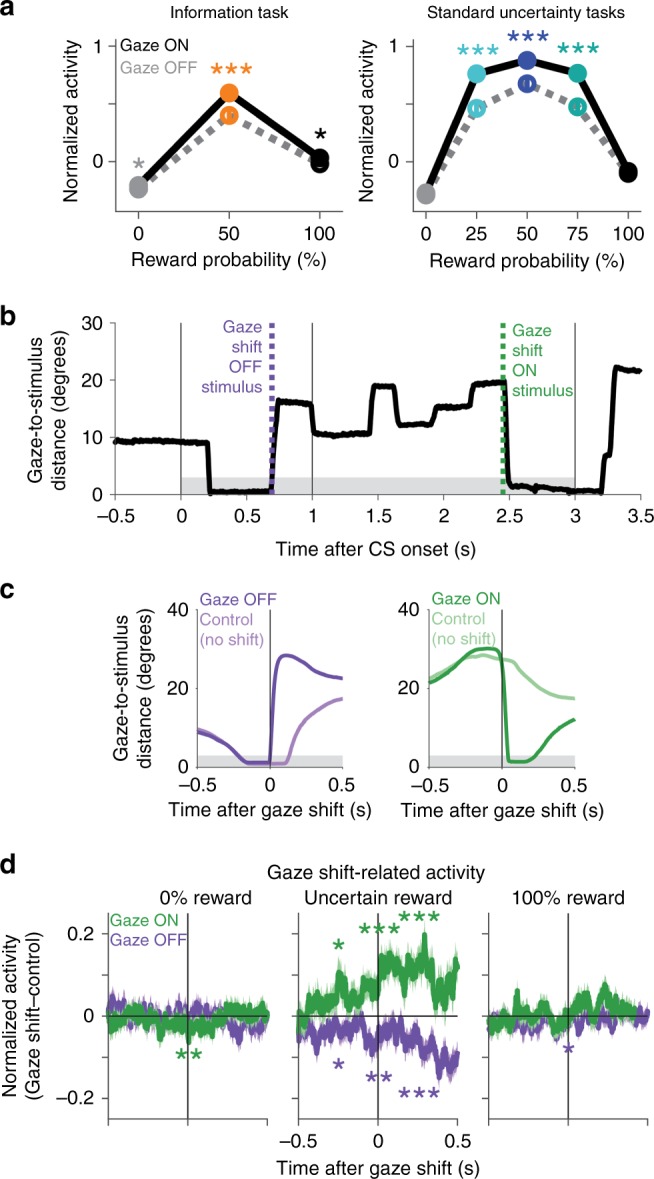
Fig. 5 Fluctuations in cortico-BG network signals predict immediate gaze shifts toward or away from objects associated with resolving uncertainty. a Mean normalized activity before information is enhanced when gaze is on the stimulus (dark dots/lines) compared with off the stimulus (light dots/lines), especially for intermediate reward probabilities when reward is uncertain. Data are from information tasks (left) and standard uncertainty tasks (right). This analysis was performed on all neurons where there was trial-to-trial variance in gaze behavior before receipt of information for all of the CSs (information tasks n = 117: ACC n = 62, icbDS n = 24, Pal = 31; standard uncertainty tasks n = 130: ACC n = 53, icbDS n = 53, Pal = 24). Error bars are ± 1 SE; *, *** indicate p < 0.05, 0.001 (signed-rank test). b Time course of gaze distance to the center of the stimulus (black) on an example trial with the Noinfo 50% reward CS. Gray area indicates the window for gaze to be on the stimulus. Green and purple lines indicate gaze shifts on and off the stimulus. c Mean time course of gaze distance to the stimulus aligned on gaze shifts off and on the stimulus (purple, green) and on control non-shift events (light colors), excluding blinks. Both gaze shift and control events have similar gaze trajectories until the moment of the gaze shift. d Mean time course of gaze shift-related normalized activity aligned on gaze shifts on the stimulus (green) and off the stimulus (purple). This analysis was performed on all neurons where there was at least one gaze shift on the stimulus and one gaze shift off the stimulus, as well as their matched control non-shift events, in each of three conditions: 0% reward (left), uncertain reward (middle), and 100% reward (right) (n = 300: ACC n = 156, icbDS n = 78, Pal n = 66). Shaded areas are ± 1 SE. *, **, *** indicate p < 0.05, 0.01, 0.001 (signed-rank test) before, during, and after the gaze shift. Uncertainty-related activity was enhanced before gaze shifts on the stimulus and reduced before gaze shifts off the stimulus, but primarily when animals were anticipating information about uncertain reward
Fig. 5 Fluctuations in cortico-BG network signals predict immediate gaze shifts toward or away from objects associated with resolving uncertainty. a Mean normalized activity before information is enhanced when gaze is on the stimulus (dark dots/lines) compared with off the stimulus (light dots/lines), especially for intermediate reward probabilities when reward is uncertain. Data are from information tasks (left) and standard uncertainty tasks (right). This analysis was performed on all neurons where there was trial-to-trial variance in gaze behavior before receipt of information for all of the CSs (information tasks n = 117: ACC n = 62, icbDS n = 24, Pal = 31; standard uncertainty tasks n = 130: ACC n = 53, icbDS n = 53, Pal = 24). Error bars are ± 1 SE; *, *** indicate p < 0.05, 0.001 (signed-rank test). b Time course of gaze distance to the center of the stimulus (black) on an example trial with the Noinfo 50% reward CS. Gray area indicates the window for gaze to be on the stimulus. Green and purple lines indicate gaze shifts on and off the stimulus. c Mean time course of gaze distance to the stimulus aligned on gaze shifts off and on the stimulus (purple, green) and on control non-shift events (light colors), excluding blinks. Both gaze shift and control events have similar gaze trajectories until the moment of the gaze shift. d Mean time course of gaze shift-related normalized activity aligned on gaze shifts on the stimulus (green) and off the stimulus (purple). This analysis was performed on all neurons where there was at least one gaze shift on the stimulus and one gaze shift off the stimulus, as well as their matched control non-shift events, in each of three conditions: 0% reward (left), uncertain reward (middle), and 100% reward (right) (n = 300: ACC n = 156, icbDS n = 78, Pal n = 66). Shaded areas are ± 1 SE. *, **, *** indicate p < 0.05, 0.01, 0.001 (signed-rank test) before, during, and after the gaze shift. Uncertainty-related activity was enhanced before gaze shifts on the stimulus and reduced before gaze shifts off the stimulus, but primarily when animals were anticipating information about uncertain rewardCC BY · PubMed Central
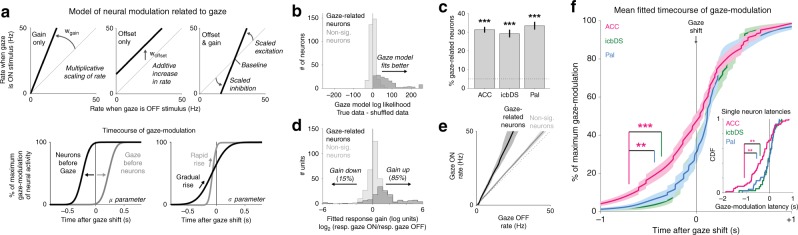
Fig. 6 Prevalence and dynamics of gaze shift-related activity in the cortico-basal ganglia network. a Model of gaze-related modulation in single neurons. Top: parameters fitting the effect of gaze on neural activity as multiplicative scaling (left), additive increase or decrease in firing rate (middle), or both (right). Bottom: parameters fitting the time course of gaze-modulation by setting the temporal offset between neural modulation and gaze shifts (left, neurons first vs. gaze first) and the rate that modulation builds up over time (right, gradual vs. rapid). b Model fits for each neuron evaluated by difference in log likelihood when fitting the real data vs. shuffled data. 31% of neurons were significantly modulated in relation to gaze (dark histogram, p < 0.05, permutation test); remaining neurons were not (light histogram). c Percentage of significantly gaze-related neurons (ACC n = 69/221, icbDS n = 37/127, Pal n = 43/129). Error bars are ± 1 SE. *** indicates p < 0.001 (binomial test). d Fitted gaze-related response gains in each neuron in log2 units (0 = no gain change; −1 = halved response; + 1 = doubled response). n = 2 outliers fitted with complete cessation of activity during gaze are plotted at −6. More neurons had gain increases than decreases, especially in gaze-related neurons (dark histogram, 127 increases vs. 22 decreases). e Fitted relationship between gaze state and firing rate in gaze-related neurons (black) and nonsignificant neurons (gray) resembles increased response gain rather than an additive offset. Lines are medians, shaded areas are bootstrap 95% confidence intervals. f Mean fitted time course of gaze-modulation around gaze shifts for neurons in each area with significant gaze-modulation (ACC, magenta; icbDS, green; Pal, blue). Asterisks indicate significance. The latency of gaze-modulation, defined at the time of 10% of maximal modulation, is significantly earlier in ACC than icbDS and Pal (gaze-modulated neurons, p = 0.001 and 0.003; all neurons, p = 0.001 and 0.003; permutation tests). Inset: cumulative distribution of gaze-modulation latencies for individual gaze-modulated neurons. Median latency is earlier in ACC than icbDS and Pal (gaze-modulated neurons, p = 0.002 and p = 0.006; all neurons, p < 0.001 and p = 0.035; rank-sum tests)
Fig. 6 Prevalence and dynamics of gaze shift-related activity in the cortico-basal ganglia network. a Model of gaze-related modulation in single neurons. Top: parameters fitting the effect of gaze on neural activity as multiplicative scaling (left), additive increase or decrease in firing rate (middle), or both (right). Bottom: parameters fitting the time course of gaze-modulation by setting the temporal offset between neural modulation and gaze shifts (left, neurons first vs. gaze first) and the rate that modulation builds up over time (right, gradual vs. rapid). b Model fits for each neuron evaluated by difference in log likelihood when fitting the real data vs. shuffled data. 31% of neurons were significantly modulated in relation to gaze (dark histogram, p < 0.05, permutation test); remaining neurons were not (light histogram). c Percentage of significantly gaze-related neurons (ACC n = 69/221, icbDS n = 37/127, Pal n = 43/129). Error bars are ± 1 SE. *** indicates p < 0.001 (binomial test). d Fitted gaze-related response gains in each neuron in log2 units (0 = no gain change; −1 = halved response; + 1 = doubled response). n = 2 outliers fitted with complete cessation of activity during gaze are plotted at −6. More neurons had gain increases than decreases, especially in gaze-related neurons (dark histogram, 127 increases vs. 22 decreases). e Fitted relationship between gaze state and firing rate in gaze-related neurons (black) and nonsignificant neurons (gray) resembles increased response gain rather than an additive offset. Lines are medians, shaded areas are bootstrap 95% confidence intervals. f Mean fitted time course of gaze-modulation around gaze shifts for neurons in each area with significant gaze-modulation (ACC, magenta; icbDS, green; Pal, blue). Asterisks indicate significance. The latency of gaze-modulation, defined at the time of 10% of maximal modulation, is significantly earlier in ACC than icbDS and Pal (gaze-modulated neurons, p = 0.001 and 0.003; all neurons, p = 0.001 and 0.003; permutation tests). Inset: cumulative distribution of gaze-modulation latencies for individual gaze-modulated neurons. Median latency is earlier in ACC than icbDS and Pal (gaze-modulated neurons, p = 0.002 and p = 0.006; all neurons, p < 0.001 and p = 0.035; rank-sum tests)CC BY · PubMed Central
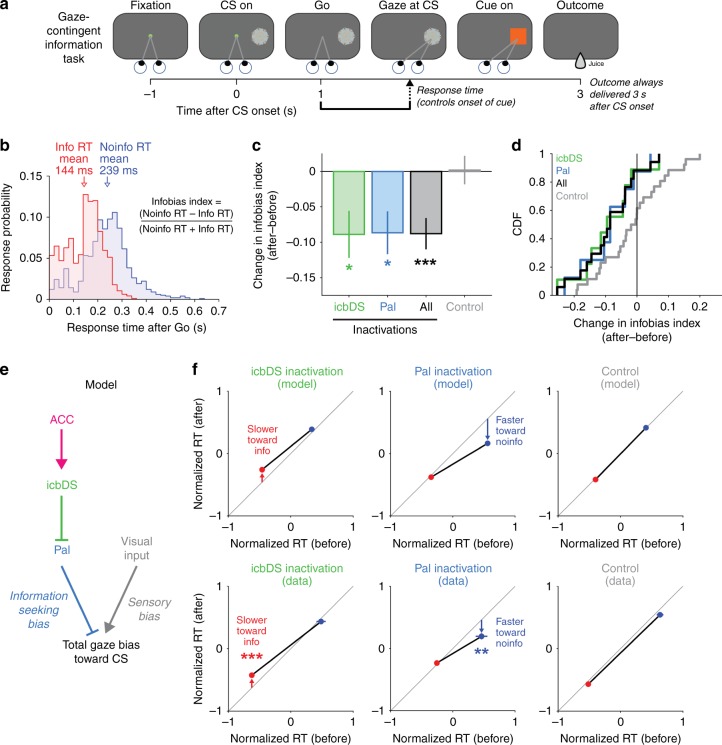
Fig. 7 Perturbation of network activity impairs information seeking. a Gaze-contingent information task. Monkeys were shown a CS, waited for a go signal, and then were allowed to gaze at it. Gazing at an Info or Noinfo CS caused it to be replaced with an informative or noninformative cue. Regardless of gaze, the outcome was always delivered a fixed time after CS onset. b RT distribution for animal B. The animal had much faster RTs for Info trials (red) than Noinfo trials (blue). The animal often anticipated the time that information would become available, as indicated by the prevalence of anticipatory saccades especially on Info trials. This histogram includes all RTs collected when inactivations were not being performed (n = 1966), excluding four outliers from Noinfo trials (RTs = 0.741, 0.748, 1.326, 1.335 s). c Muscimol inactivation effect on RTs to contralateral CSs, quantified as the change in Infobias Index (after–before). There are significant reductions in Infobias Index for icbDS inactivations (green), Pal inactivations (blue), and all inactivations (black), but not control sessions (gray). *, **, *** indicate p < 0.05, 0.01, 0.001 (permutation tests). Error bars are ± 1 SE. d Cumulative distributions showing each session’s inactivation effect on the Infobias Index for contralateral CSs. Inactivation sessions consistently reduce the information bias; control sessions do not. e Schematic model of a mechanism by which the cortico-BG network could motivate information-seeking gaze shifts. f Model predictions: the two BG areas should influence information seeking in distinct manners, such that icbDS inactivation slows RTs to obtain information (left, Info CS, red), Pal inactivation speeds RTs that will not obtain information (middle, Noinfo CS, blue), and controls have no effect (right). g Inactivation results, quantified by comparing normalized RTs for the Info CS (red) and Noinfo CS (blue) before vs. after inactivation. icbDS inactivation slowed RTs to the Info CS (left); Pal inactivation speeded RTs to Noinfo CS (middle); control sessions had no significant effect on RTs to either CS (right). Error bars are ± 1 SE. **, *** indicate p < 0.01, 0.001 (rank-sum tests)
Fig. 7 Perturbation of network activity impairs information seeking. a Gaze-contingent information task. Monkeys were shown a CS, waited for a go signal, and then were allowed to gaze at it. Gazing at an Info or Noinfo CS caused it to be replaced with an informative or noninformative cue. Regardless of gaze, the outcome was always delivered a fixed time after CS onset. b RT distribution for animal B. The animal had much faster RTs for Info trials (red) than Noinfo trials (blue). The animal often anticipated the time that information would become available, as indicated by the prevalence of anticipatory saccades especially on Info trials. This histogram includes all RTs collected when inactivations were not being performed (n = 1966), excluding four outliers from Noinfo trials (RTs = 0.741, 0.748, 1.326, 1.335 s). c Muscimol inactivation effect on RTs to contralateral CSs, quantified as the change in Infobias Index (after–before). There are significant reductions in Infobias Index for icbDS inactivations (green), Pal inactivations (blue), and all inactivations (black), but not control sessions (gray). *, **, *** indicate p < 0.05, 0.01, 0.001 (permutation tests). Error bars are ± 1 SE. d Cumulative distributions showing each session’s inactivation effect on the Infobias Index for contralateral CSs. Inactivation sessions consistently reduce the information bias; control sessions do not. e Schematic model of a mechanism by which the cortico-BG network could motivate information-seeking gaze shifts. f Model predictions: the two BG areas should influence information seeking in distinct manners, such that icbDS inactivation slows RTs to obtain information (left, Info CS, red), Pal inactivation speeds RTs that will not obtain information (middle, Noinfo CS, blue), and controls have no effect (right). g Inactivation results, quantified by comparing normalized RTs for the Info CS (red) and Noinfo CS (blue) before vs. after inactivation. icbDS inactivation slowed RTs to the Info CS (left); Pal inactivation speeded RTs to Noinfo CS (middle); control sessions had no significant effect on RTs to either CS (right). Error bars are ± 1 SE. **, *** indicate p < 0.01, 0.001 (rank-sum tests)CC BY · PubMed Central

Verification

Claims the paper makes

The claims and statistics of this paper haven’t been checked yet.

Run the check — free, no account needed. It reads the open-access text and checks the sources it cites.

A few free checks a day · papers already verified open instantly · results are public

Claims other papers make about this one

Each is checked against this paper’s own text: does it say what the citing paper says it does?

Self-check

Percentages, sums and reported differences re-computed from the paper’s own numbers.

The self-check needs the paper’s full text.

Citations

Cites

Show all 126 references

Cited by

Sorted by citations

See all 129

Metadata

Authors
White, J. K., Bromberg-Martin, E. S., Heilbronner, S. R., Zhang, K., Pai, J., Haber, S. N., & Monosov, I. E.
Affiliations
  • Washington University in St. Louis (US)
  • University of Minnesota (US)
  • University of Rochester (US)
Corresponding author
Monosov, Ilya E.
Venue
Nature Communications
Published
2019-11-14
Volume
10
Issue
1
Pages
5168-5168
ISSN
2041-1723 (ISSN-L)
OpenAlex
W2984095784
Cited by
129
References
126
Citations by year
2026: 12 · 2025: 17 · 2024: 17 · 2023: 17 · 2022: 16 · 2021: 28 · 2020: 20 · 2019: 1
FWCI
9.45
Type
journal article
Language
en
Open access
Locations
  • Nature Communications (publishedVersion, cc-by)
  • bioRxiv (Cold Spring Harbor Laboratory) (acceptedVersion, cc-by-nc-nd)
  • Europe PMC (PubMed Central) (publishedVersion, cc-by)
  • PubMed Central (publishedVersion, cc-by)
  • PubMed (publishedVersion)
  • Digital Commons@Becker (Washington University School of Medicine) (submittedVersion, cc-by)
  • RePEc: Research Papers in Economics (submittedVersion)
  • DOAJ (DOAJ: Directory of Open Access Journals) (submittedVersion, cc-by-sa)
  • DOAJ (DOAJ: Directory of Open Access Journals) (submittedVersion)
Funders
Edward Mallinckrodt, Jr. Foundation
Topics
  • Life Sciences › Neuroscience › Cognitive Neuroscience › Neural and Behavioral Psychology Studies
  • Life Sciences › Neuroscience › Cellular and Molecular Neuroscience › Neurotransmitter Receptor Influence on Behavior
  • Life Sciences › Neuroscience › Cognitive Neuroscience › Memory and Neural Mechanisms
Keywords
information seeking, uncertainty, anterior cingulate cortex, basal ganglia, cortico-basal ganglia network, reward prediction, gaze shifts, motivation, primate behavior
MeSH terms
Animals, Basal Ganglia, Fixation, Ocular, Macaca mulatta, Male, Nerve Net, Neurons, Reward, Uncertainty, Information Seeking Behavior

About these checks

Registry, retraction, Cites and statistics results are computed, not judged, with one exception: a printed reference that no index lists is read once by a model before it counts as a citation error. Claims are extracted by a model and kept only when their quote appears verbatim in the text; each cited source is then checked, with a model’s help, for whether it says what the claim relies on. Those verdicts can be wrong — read the claim’s quote and the cited source before relying on one.

Statistics and arithmetic are recomputed, not judged.

Confidence bands are shown only for fields calibrated on our annotated test set. None is calibrated yet, so no band is shown.

What counts as a claim ›How we measure confidence ›How we check this ›

Are you an author, or do you see a problem with this page? Request a review