CoChat

Integrative differential expression and gene set enrichment analysis using summary statistics for scRNA-seq studies

Open access

The DOI matches its Crossref record; 62 of the 62 references it cites were found in a registry or an index.

Abstract

Differential expression (DE) analysis and gene set enrichment (GSE) analysis are commonly applied in single cell RNA sequencing (scRNA-seq) studies. Here, we develop an integrative and scalable computational method, iDEA, to perform joint DE and GSE analysis through a hierarchical Bayesian framework. By integrating DE and GSE analyses, iDEA can improve the power and consistency of DE analysis and the accuracy of GSE analysis. Importantly, iDEA uses only DE summary statistics as input, enabling effective data modeling through complementing and pairing with various existing DE methods. We illustrate the benefits of iDEA with extensive simulations. We also apply iDEA to analyze three scRNA-seq data sets, where iDEA achieves up to five-fold power gain over existing GSE methods and up to 64% power gain over existing DE methods. The power gain brought by iDEA allows us to identify many pathways that would not be identified by existing approaches in these data.

Overview

The claims and statistics of this paper haven’t been checked yet.

Free: it reads the open-access text and checks the first 5 claims that cite a source we can check. Create a free account to check every claim.

A few free checks a day · papers already verified open instantly · results are public

Integrity signals

Registry

Crossref · 10.1038/s41467-020-15298-6

Cites

62 of 62 references verified0 citation errors · 0 not checkable

Statistics

Figures

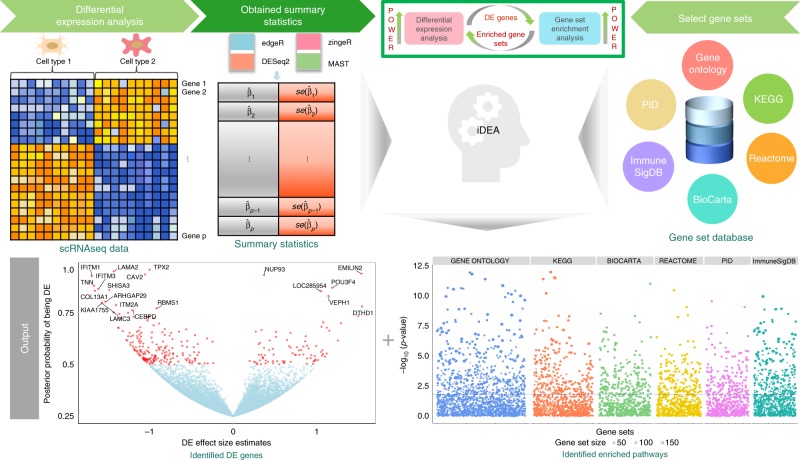
Fig. 1 Schematic overview of iDEA. iDEA is designed to jointly model all genes together for integrative differential expression (DE) analysis and gene set enrichment (GSE) analysis. iDEA requires input association summary statistics from existing scRNA-seq DE methods in terms of the DE effect size estimate β^j and its standard error se(β^j) for every gene (j=1,2,⋯,p) (top left panels). iDEA also requires a pre-defined set of gene sets that we have compiled and pruned for use with the software (top right panels). With these two inputs, iDEA performs joint DE and GSE analysis through a Bayesian hierarchical model. For each gene set, iDEA outputs a p-value for testing whether the gene set is enriched with DE genes (bottom right panel) for GSE analysis. In addition, iDEA outputs the posterior inclusion probability of each gene being DE (bottom left panel) for DE analysis. By modeling all genes together and integrating DE and GSE analyses in a joint framework, iDEA can increase the power of both analyses.
Fig. 1 Schematic overview of iDEA. iDEA is designed to jointly model all genes together for integrative differential expression (DE) analysis and gene set enrichment (GSE) analysis. iDEA requires input association summary statistics from existing scRNA-seq DE methods in terms of the DE effect size estimate β^j and its standard error se(β^j) for every gene (j=1,2,⋯,p) (top left panels). iDEA also requires a pre-defined set of gene sets that we have compiled and pruned for use with the software (top right panels). With these two inputs, iDEA performs joint DE and GSE analysis through a Bayesian hierarchical model. For each gene set, iDEA outputs a p-value for testing whether the gene set is enriched with DE genes (bottom right panel) for GSE analysis. In addition, iDEA outputs the posterior inclusion probability of each gene being DE (bottom left panel) for DE analysis. By modeling all genes together and integrating DE and GSE analyses in a joint framework, iDEA can increase the power of both analyses.CC BY · PubMed Central
Fig. 2 iDEA produces well-calibrated p-values for gene set enrichment analysis under null simulations. Quantile-quantile plots of -log10(p-values) from iDEA (orange), fGSEA (green), CAMERA (navyblue), PAGE (skyblue) and GSEA (yellow) are shown under different null scenarios with varying gene set coverage rates (CR): CR = 1% (a); CR = 2% (b); CR = 5% (c); CR = 10% (d). CR represents the percentage of genes inside the gene set. Here, the other parameters are set to be τ0 = −2 and τ1 = 0. λgc is the genomic control factor.
Fig. 2 iDEA produces well-calibrated p-values for gene set enrichment analysis under null simulations. Quantile-quantile plots of -log10(p-values) from iDEA (orange), fGSEA (green), CAMERA (navyblue), PAGE (skyblue) and GSEA (yellow) are shown under different null scenarios with varying gene set coverage rates (CR): CR = 1% (a); CR = 2% (b); CR = 5% (c); CR = 10% (d). CR represents the percentage of genes inside the gene set. Here, the other parameters are set to be τ0 = −2 and τ1 = 0. λgc is the genomic control factor.CC BY · PubMed Central
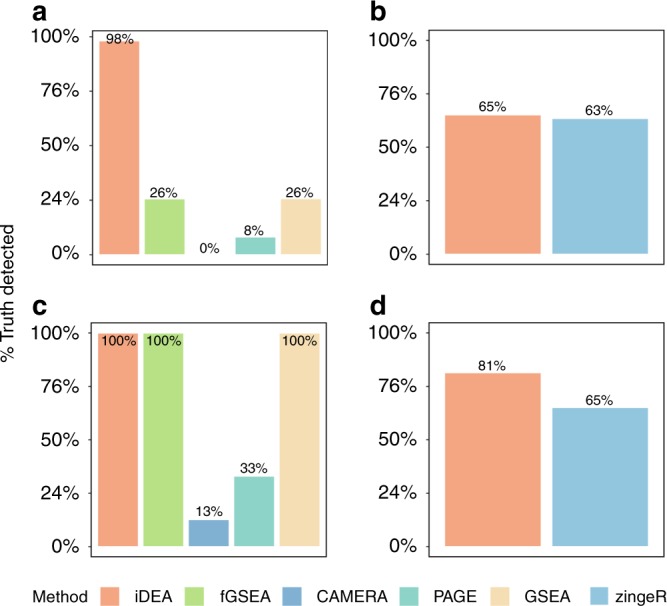
Fig. 3 iDEA is more powerful for both GSE and DE analyses than existing approaches in power simulations. The power of iDEA in identifying enriched pathways (y-axis; a, c) and in identifying differentially expressed genes (y-axis; b, d) are higher than that of the other methods (x-axis). The compared GSE methods (a, c) include iDEA (orange), fGSEA (green), CAMERA (navyblue), PAGE (skyblue), and GSEA (yellow). The compared DE methods (b, d) include iDEA (orange) and zingeR (blue). Simulations are performed under two parameter settings: τ0 = −2, τ1 = 0.5, and CR = 10% (a, b); τ0 = −2, τ1 = 5, and CR = 10% (c, d). Here, power was calculated based on an FDR of 5%.
Fig. 3 iDEA is more powerful for both GSE and DE analyses than existing approaches in power simulations. The power of iDEA in identifying enriched pathways (y-axis; a, c) and in identifying differentially expressed genes (y-axis; b, d) are higher than that of the other methods (x-axis). The compared GSE methods (a, c) include iDEA (orange), fGSEA (green), CAMERA (navyblue), PAGE (skyblue), and GSEA (yellow). The compared DE methods (b, d) include iDEA (orange) and zingeR (blue). Simulations are performed under two parameter settings: τ0 = −2, τ1 = 0.5, and CR = 10% (a, b); τ0 = −2, τ1 = 5, and CR = 10% (c, d). Here, power was calculated based on an FDR of 5%.CC BY · PubMed Central
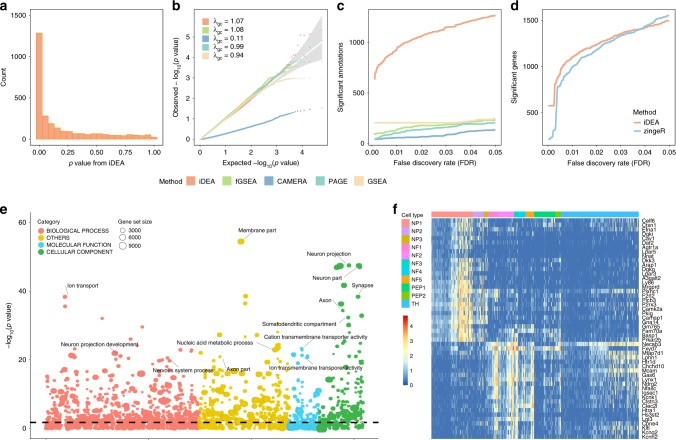
Fig. 4 Analysis results in the embryonic stem cell scRNA-seq data. Results are shown for comparing two cell types, endothelial cell (EC) and definitive endoderm derivatives cell (DEC). a p-values from iDEA for GSE analysis display expected enrichment of small p-values (for true signals) and a long flat tail toward large p-values. b Quantile-quantile plots of −log10(p-values) from GSE methods including iDEA (orange), fGSEA (green), CAMERA (navyblue), PAGE (skyblue) and GSEA (yellow) are shown under permuted null. The p-values from iDEA, fGSEA, PAGE and GSEA are reasonably well calibrated, while that from CAEMRA are overly conservative. Here λgc is the genomic control factor. c Number of identified enriched gene sets by iDEA (orange), fGSEA (green), CAMERA (navyblue), PAGE (skyblue) and GSEA (yellow) are plotted against different empirical false discovery rates (FDR). iDEA is more powerful than other methods for GSE analysis. d Number of identified DE genes by iDEA (orange) and zingeR (blue) are plotted against different empirical FDR values. iDEA is more powerful than zingeR for DE analysis. e Heatmap shows the normalized expression level (log10-transformation with pseudo-count 0.1) for selected 50 DE genes (rows) identified by iDEA for cells in the two cell types (columns). Genes are sorted by Hierarchical clustering, cells are ordered by cell types (EC: red; DEC: blue). These DE genes clearly distinguish two compared cell types. f Bubble plot shows –log10(p-values) for GSE analysis from iDEA (y-axis) for different gene sets. Gene sets are colored by ten categories: immunologic signatures (red), chemical and genetic perturbations (yellow), GO biological process (blue), GO molecular function (green), GO cellular component (orange), oncogenic signatures (deep blue), Reactome (grass-green), KEGG (purple), PID (rose), and Biocarta (gray). The size of the dot represents the number of genes contained in the gene set. Names for ten of the gene sets that are closely related to embryonic cell development are highlighted in the panel.
Fig. 4 Analysis results in the embryonic stem cell scRNA-seq data. Results are shown for comparing two cell types, endothelial cell (EC) and definitive endoderm derivatives cell (DEC). a p-values from iDEA for GSE analysis display expected enrichment of small p-values (for true signals) and a long flat tail toward large p-values. b Quantile-quantile plots of −log10(p-values) from GSE methods including iDEA (orange), fGSEA (green), CAMERA (navyblue), PAGE (skyblue) and GSEA (yellow) are shown under permuted null. The p-values from iDEA, fGSEA, PAGE and GSEA are reasonably well calibrated, while that from CAEMRA are overly conservative. Here λgc is the genomic control factor. c Number of identified enriched gene sets by iDEA (orange), fGSEA (green), CAMERA (navyblue), PAGE (skyblue) and GSEA (yellow) are plotted against different empirical false discovery rates (FDR). iDEA is more powerful than other methods for GSE analysis. d Number of identified DE genes by iDEA (orange) and zingeR (blue) are plotted against different empirical FDR values. iDEA is more powerful than zingeR for DE analysis. e Heatmap shows the normalized expression level (log10-transformation with pseudo-count 0.1) for selected 50 DE genes (rows) identified by iDEA for cells in the two cell types (columns). Genes are sorted by Hierarchical clustering, cells are ordered by cell types (EC: red; DEC: blue). These DE genes clearly distinguish two compared cell types. f Bubble plot shows –log10(p-values) for GSE analysis from iDEA (y-axis) for different gene sets. Gene sets are colored by ten categories: immunologic signatures (red), chemical and genetic perturbations (yellow), GO biological process (blue), GO molecular function (green), GO cellular component (orange), oncogenic signatures (deep blue), Reactome (grass-green), KEGG (purple), PID (rose), and Biocarta (gray). The size of the dot represents the number of genes contained in the gene set. Names for ten of the gene sets that are closely related to embryonic cell development are highlighted in the panel.CC BY · PubMed Central
Fig. 5 Analysis results in the mouse neuronal cell scRNA-seq data. Results are shown for comparing nonpeptidergic nociceptors 1 (NP1) versus all the other cell types. a p-values from iDEA for GSE analysis display expected enrichment of small p-values (for true signals) and a long flat tail towards large p-values. b Quantile-quantile plots of −log10(p-values) from GSE methods including iDEA (orange), fGSEA (green), CAMERA (navyblue), PAGE (skyblue) and GSEA (yellow) are shown under permuted null. The p-values from iDEA, fGSEA, PAGE and GSEA are reasonably well calibrated, while that from CAEMRA are overly conservative. Here λgc is the genomic control factor. c Number of identified enriched gene sets by iDEA (orange), fGSEA (green), CAMERA (navyblue), PAGE (skyblue) and GSEA (yellow) are plotted against different empirical false discovery rates (FDR). iDEA is more powerful than other methods for GSE analysis. d Number of identified DE genes by iDEA (orange) and zingeR (blue) are plotted against different empirical FDR values. iDEA is more powerful than zingeR for DE analysis. e Heatmap shows the normalized expression level (log10-transformation with pseudo-count 0.1) for selected 50 DE genes (rows) identified by iDEA for cells in the two cell types (columns). Genes are sorted by Hierarchical clustering, cells are ordered by cell types (NP1: red; others: other colors). These DE genes clearly distinguish two compared cell types. f Bubble plot shows –log10(p-values) for GSE analysis from iDEA (y-axis) for different gene sets. Gene sets are colored by four categories: GO biological process (orange), GO molecular function (blue), GO cellular component (green) and other gene ontology terms with only GO numbers (yellow). The size of the dot represents the number of genes contained in the gene set. Names for ten of the gene sets that are closely related to nociceptive sensory neurons’ activities are highlighted in the panel.
Fig. 5 Analysis results in the mouse neuronal cell scRNA-seq data. Results are shown for comparing nonpeptidergic nociceptors 1 (NP1) versus all the other cell types. a p-values from iDEA for GSE analysis display expected enrichment of small p-values (for true signals) and a long flat tail towards large p-values. b Quantile-quantile plots of −log10(p-values) from GSE methods including iDEA (orange), fGSEA (green), CAMERA (navyblue), PAGE (skyblue) and GSEA (yellow) are shown under permuted null. The p-values from iDEA, fGSEA, PAGE and GSEA are reasonably well calibrated, while that from CAEMRA are overly conservative. Here λgc is the genomic control factor. c Number of identified enriched gene sets by iDEA (orange), fGSEA (green), CAMERA (navyblue), PAGE (skyblue) and GSEA (yellow) are plotted against different empirical false discovery rates (FDR). iDEA is more powerful than other methods for GSE analysis. d Number of identified DE genes by iDEA (orange) and zingeR (blue) are plotted against different empirical FDR values. iDEA is more powerful than zingeR for DE analysis. e Heatmap shows the normalized expression level (log10-transformation with pseudo-count 0.1) for selected 50 DE genes (rows) identified by iDEA for cells in the two cell types (columns). Genes are sorted by Hierarchical clustering, cells are ordered by cell types (NP1: red; others: other colors). These DE genes clearly distinguish two compared cell types. f Bubble plot shows –log10(p-values) for GSE analysis from iDEA (y-axis) for different gene sets. Gene sets are colored by four categories: GO biological process (orange), GO molecular function (blue), GO cellular component (green) and other gene ontology terms with only GO numbers (yellow). The size of the dot represents the number of genes contained in the gene set. Names for ten of the gene sets that are closely related to nociceptive sensory neurons’ activities are highlighted in the panel.CC BY · PubMed Central
Fig. 6 Analysis results in the 10X Genomics scRNA-seq data. Results are shown for comparing CD4+ T cells versus CD8+ T cells. a p-values from iDEA for GSE analysis display expected enrichment of small p-values (for true signals) and a long flat tail towards large p-values. b Quantile-quantile plots of −log10(p-values) from GSE methods including iDEA (orange), fGSEA (green), CAMERA (navyblue), PAGE (skyblue) and GSEA (yellow) are shown under permuted null. The p-values from all methods in the permuted data are not discernable from the null expectation. Here λgc is the genomic control factor. c Number of identified enriched gene sets by iDEA (orange), fGSEA (green), CAMERA (navyblue), PAGE (skyblue) and GSEA (yellow) are plotted against different empirical false discovery rates (FDR). iDEA is as the same powerful than other methods for GSE analysis. d Number of identified DE genes by iDEA (orange) and zingeR (blue) are plotted against different empirical FDR values. iDEA is more powerful than zingeR for DE analysis. e Heatmap shows the normalized expression level (log10-transformation with pseudo-count 0.1) for selected 30 DE genes (rows) identified by iDEA for cells in the two cell types (columns). Genes are sorted by Hierarchical clustering, cells are ordered by cell types (CD4: blue; CD8: red). These DE genes clearly distinguish two compared cell types. f Bubble plot shows –log10(p-values) for GSE analysis from iDEA (y-axis) for different gene sets. Gene sets are colored by six projects: HPCA (red), FANTOM (yellow), BLUEPRINT (blue), NOVERSHTERN (green), ENCODE (orange), IRIS (deep blue). The size of the dot represents the number of genes contained in the gene set. Names for ten of the gene sets that are closely related to CD4+ and CD8+ immune process are highlighted in the panel.
Fig. 6 Analysis results in the 10X Genomics scRNA-seq data. Results are shown for comparing CD4+ T cells versus CD8+ T cells. a p-values from iDEA for GSE analysis display expected enrichment of small p-values (for true signals) and a long flat tail towards large p-values. b Quantile-quantile plots of −log10(p-values) from GSE methods including iDEA (orange), fGSEA (green), CAMERA (navyblue), PAGE (skyblue) and GSEA (yellow) are shown under permuted null. The p-values from all methods in the permuted data are not discernable from the null expectation. Here λgc is the genomic control factor. c Number of identified enriched gene sets by iDEA (orange), fGSEA (green), CAMERA (navyblue), PAGE (skyblue) and GSEA (yellow) are plotted against different empirical false discovery rates (FDR). iDEA is as the same powerful than other methods for GSE analysis. d Number of identified DE genes by iDEA (orange) and zingeR (blue) are plotted against different empirical FDR values. iDEA is more powerful than zingeR for DE analysis. e Heatmap shows the normalized expression level (log10-transformation with pseudo-count 0.1) for selected 30 DE genes (rows) identified by iDEA for cells in the two cell types (columns). Genes are sorted by Hierarchical clustering, cells are ordered by cell types (CD4: blue; CD8: red). These DE genes clearly distinguish two compared cell types. f Bubble plot shows –log10(p-values) for GSE analysis from iDEA (y-axis) for different gene sets. Gene sets are colored by six projects: HPCA (red), FANTOM (yellow), BLUEPRINT (blue), NOVERSHTERN (green), ENCODE (orange), IRIS (deep blue). The size of the dot represents the number of genes contained in the gene set. Names for ten of the gene sets that are closely related to CD4+ and CD8+ immune process are highlighted in the panel.CC BY · PubMed Central

Verification

Claims the paper makes

The claims and statistics of this paper haven’t been checked yet.

Free: it reads the open-access text and checks the first 5 claims that cite a source we can check. Create a free account to check every claim.

A few free checks a day · papers already verified open instantly · results are public

Claims other papers make about this one

Each is checked against this paper’s own text: does it say what the citing paper says it does?

Self-check

Percentages, sums and reported differences re-computed from the paper’s own numbers.

The self-check needs the paper’s full text.

Citations

Cites

Show all 62 references

Cited by

See all 99

Metadata

Authors
Ma, Y., Sun, S., Shang, X., Keller, E. T., Chen, M., & Zhou, X.
Affiliations
  • University of Michigan (US)
  • Northwestern Polytechnical University (CN)
  • University of Chicago (US)
Corresponding author
Zhou, Xiang
Venue
Nature Communications
Published
2020-03-27
Volume
11
Issue
1
Pages
1585-1585
ISSN
2041-1723 (ISSN-L)
OpenAlex
W3013406975
Cited by
81
References
62
Citations by year
2026: 7 · 2025: 10 · 2024: 23 · 2023: 12 · 2022: 18 · 2021: 9 · 2020: 2
FWCI
3.32
Type
journal article
Language
en
Open access
Licence
Locations
  • Nature Communications (publishedVersion, cc-by)
  • PubMed Central (publishedVersion, cc-by)
  • PubMed (publishedVersion)
  • RePEc: Research Papers in Economics (submittedVersion)
  • DOAJ (DOAJ: Directory of Open Access Journals) (submittedVersion, cc-by-sa)
Funders
  • National Science Foundation (1712933, P30 CA046592, R01HD088558)
  • National Natural Science Foundation of China (61902319)
  • Huazhong University of Science and Technology
  • Natural Science Foundation of Shaanxi Province (2019JQ127)
  • National Institutes of Health
  • National Human Genome Research Institute (R01HG009124)
  • National Cancer Institute (P01CA093900, P30CA046592)
  • National Institute of General Medical Sciences (R01GM126553)
  • Eunice Kennedy Shriver National Institute of Child Health and Human Development (R01HD088558)
Topics
  • Life Sciences › Biochemistry, Genetics and Molecular Biology › Molecular Biology › Single-cell and spatial transcriptomics
  • Life Sciences › Biochemistry, Genetics and Molecular Biology › Molecular Biology › Bioinformatics and Genomic Networks
  • Life Sciences › Biochemistry, Genetics and Molecular Biology › Molecular Biology › Gene expression and cancer classification
Keywords
differential expression analysis, gene set enrichment analysis, single-cell RNA sequencing, ideas, Bayesian hierarchical model, summary statistics, statistical power, pathway identification
MeSH terms
Human Embryonic Stem Cells, RNA-Seq, Animals, Computer Simulation, Endoderm, Gene Expression Regulation, Humans, Models, Genetic, Sensory Receptor Cells, Statistics as Topic, Gene Expression Profiling, Endothelial Cells, Mice, Single-Cell Analysis

About these checks

Registry, retraction, Cites and statistics results are computed, not judged, with one exception: a printed reference that no index lists is read once by a model before it counts as a citation error. Claims are extracted by a model and kept only when their quote appears verbatim in the text; each cited source is then checked, with a model’s help, for whether it says what the claim relies on. Those verdicts can be wrong — read the claim’s quote and the cited source before relying on one.

Statistics and arithmetic are recomputed, not judged.

Confidence bands are shown only for fields calibrated on our annotated test set. None is calibrated yet, so no band is shown.

What counts as a claim ›How we measure confidence ›How we check this ›

Are you an author, or do you see a problem with this page? Request a review

How to cite

Cite CoChat for the checks on this page, and the paper for its own findings.

This page
CoChat. (2026). Citation check: Integrative differential expression and gene set enrichment analysis using summary statistics for scRNA-seq studies. https://app.cochat.ai/papers/10.1038/s41467-020-15298-6
The paper
Ma, Y., Sun, S., Shang, X., Keller, E. T., Chen, M., & Zhou, X. (2020). Integrative differential expression and gene set enrichment analysis using summary statistics for scRNA-seq studies. Nature Communications. https://doi.org/10.1038/s41467-020-15298-6

Data sources

Bibliographic data: Semantic Scholar, OpenAlex, Crossref.

Contains information from the Semantic Scholar Academic Graph Datasets, made available under the ODC Attribution License (ODC-BY 1.0).

Semantic Scholar’s data is described in: Kinney, R., et al. (2023). The Semantic Scholar Open Data Platform. arXiv:2301.10140.