

The DOI matches its Crossref record; 50 of the 50 references it cites were found in a registry or an index.
Natural killer cells modulate motor neuron-immune cell cross talk in models of Amyotrophic Lateral Sclerosis
Open accessAbstract
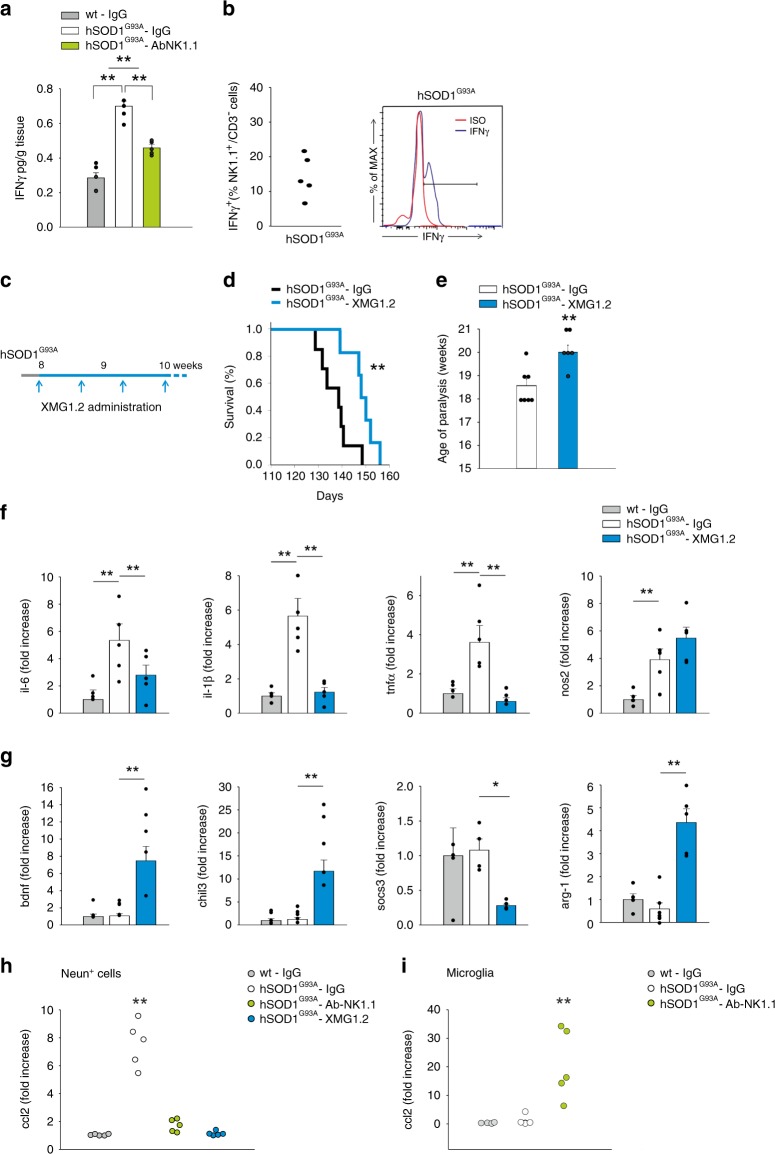
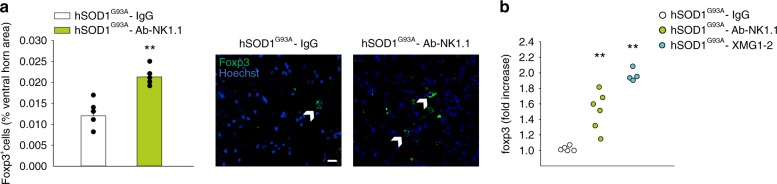
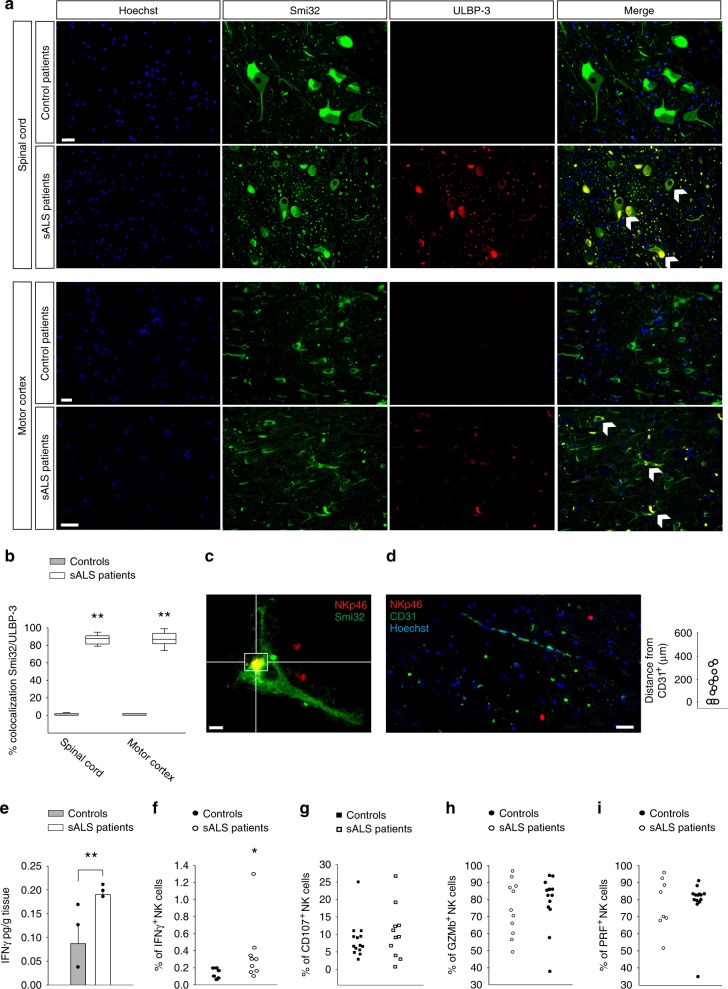
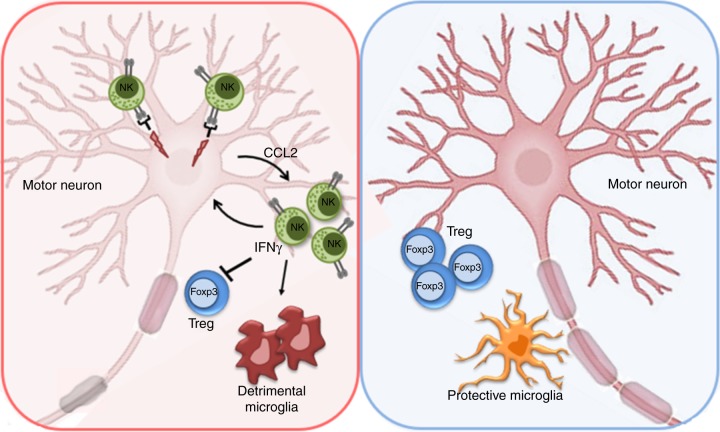
In amyotrophic lateral sclerosis (ALS), immune cells and glia contribute to motor neuron (MN) degeneration. We report the presence of NK cells in post-mortem ALS motor cortex and spinal cord tissues, and the expression of NKG2D ligands on MNs. Using a mouse model of familial-ALS, hSOD1 G93A , we demonstrate NK cell accumulation in the motor cortex and spinal cord, with an early CCL2-dependent peak. NK cell depletion reduces the pace of MN degeneration, delays motor impairment and increases survival. This is confirmed in another ALS mouse model, TDP43 A315T . NK cells are neurotoxic to hSOD1 G93A MNs which express NKG2D ligands, while IFNγ produced by NK cells instructs microglia toward an inflammatory phenotype, and impairs FOXP3 + /Treg cell infiltration in the spinal cord of hSOD1 G93A mice. Together, these data suggest a role of NK cells in determining the onset and progression of MN degeneration in ALS, and in modulating Treg recruitment and microglia phenotype.
Overview
The claims and statistics of this paper haven’t been checked yet.
Run the check — free, no account needed. It reads the open-access text and checks the sources it cites.
Integrity signals
Registry
Cites
Statistics
Figures
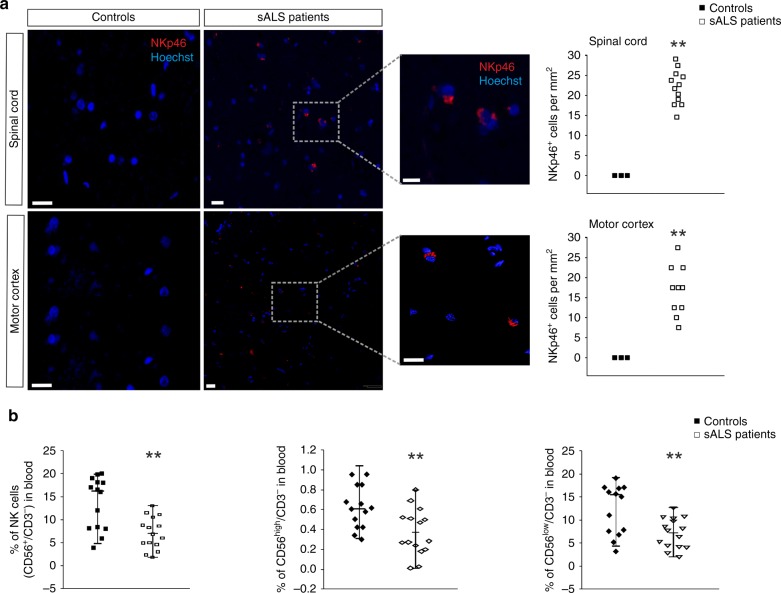
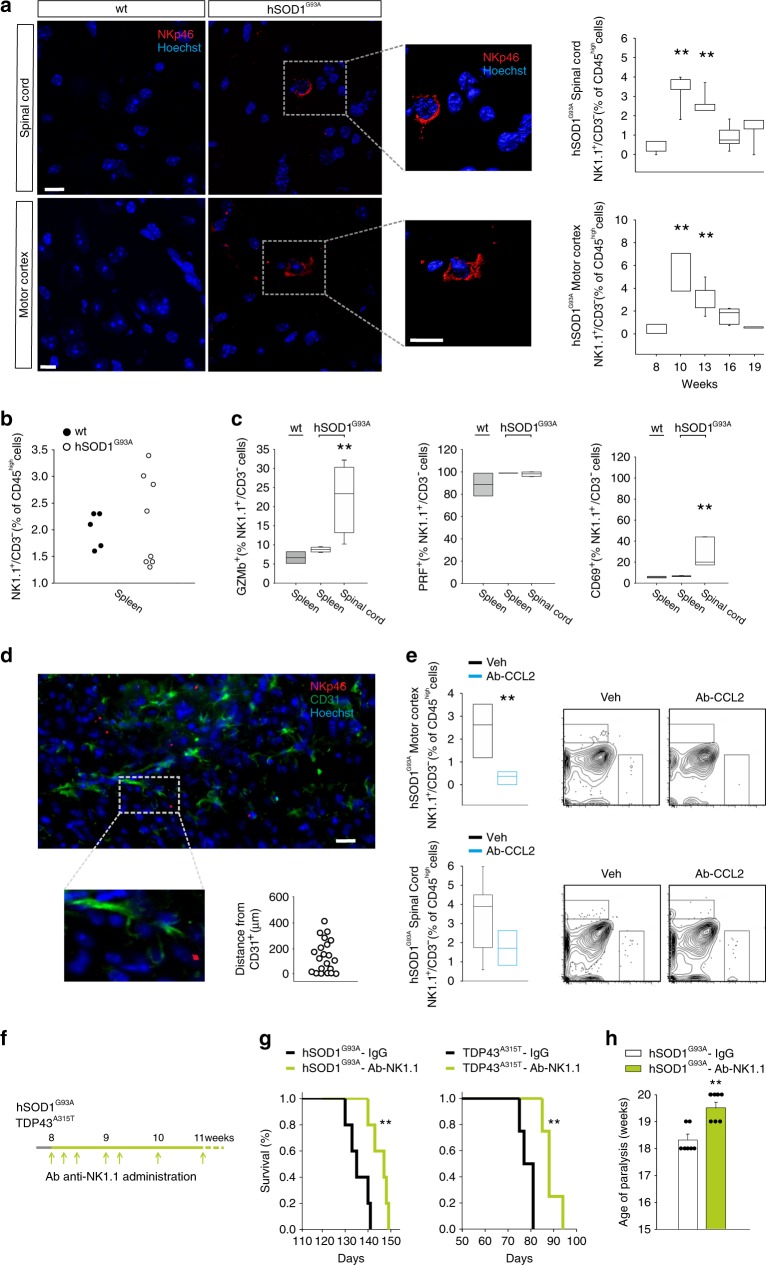
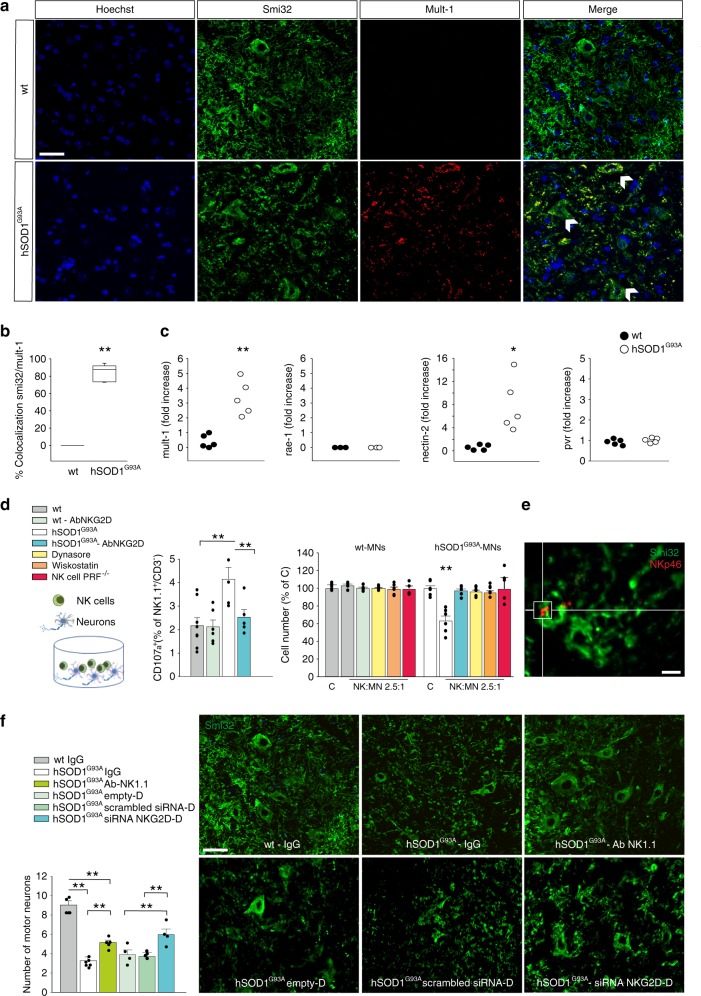
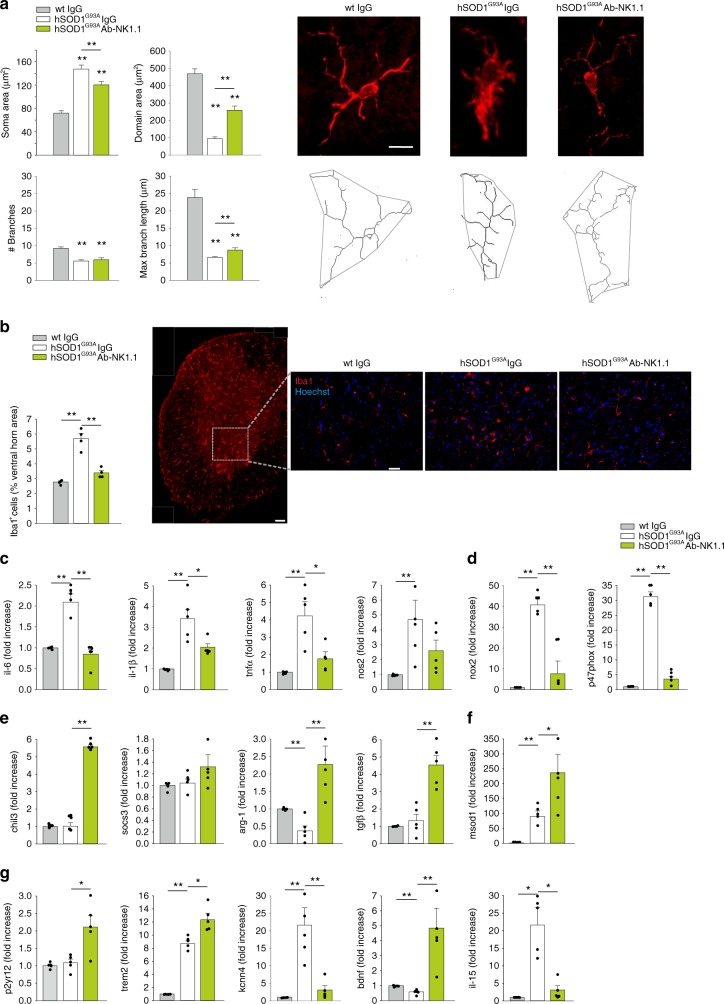
Verification
Claims the paper makes
The claims and statistics of this paper haven’t been checked yet.
Run the check — free, no account needed. It reads the open-access text and checks the sources it cites.
Claims other papers make about this one
Each is checked against this paper’s own text: does it say what the citing paper says it does?
In the citing paper
“NK cell infiltration into the spinal cord and cerebral motor cortex was observed in sporadic ALS patients and an ALS mouse model (SOD1G93A).”
From Microglia in neurodegenerative diseases: mechanism and potential therapeutic targets (2023) · cites this paper as [365]
Self-check
Percentages, sums and reported differences re-computed from the paper’s own numbers.
The self-check needs the paper’s full text.
Citations
Cites
1 retracted
Liu, X., Zhou, J., Yu, T., Chen, C., Cheng, Q., Sengupta, K., Huang, Y., Li, H., Liu, C., Wang, Y., et al. (2014) · Angewandte Chemie International Edition · doi:10.1002/anie.201406764 · Cited by 206
Self-citationRetractedAnalyzing real-time PCR data by the comparative CT method
Schmittgen, T. D., & Livak, K. J. (2008) · Nature Protocols · doi:10.1038/nprot.2008.73 · Cited by 26,190
El Escorial revisited: revised criteria for the diagnosis of amyotrophic lateral sclerosis
Brooks, B. R., Miller, R. G., Swash, M., & Munsat, T. L. (2000) · Amyotrophic Lateral Sclerosis and Other Motor Neuron Disorders · doi:10.1080/146608200300079536 · Cited by 5,433
Lanier, L. L. (2004) · Annual Review of Immunology · doi:10.1146/annurev.immunol.23.021704.115526 · Cited by 2,765
Microglia emerge as central players in brain disease
Salter, M. W., & Stevens, B. (2017) · Nature Medicine · doi:10.1038/nm.4397 · Cited by 1,767
Onset and Progression in Inherited ALS Determined by Motor Neurons and Microglia
Boillée, S., Yamanaka, K., Lobsiger, C. S., Copeland, N. G., Jenkins, N. A., Kassiotis, G., Kollias, G., & Cleveland, D. W. (2006) · Science · doi:10.1126/science.1123511 · Cited by 1,623
Disease-Associated Microglia: A Universal Immune Sensor of Neurodegeneration
Deczkowska, A., Keren-Shaul, H., Weiner, A., Colonna, M., Schwartz, M., & Amit, I. (2018) · Cell · doi:10.1016/j.cell.2018.05.003 · Cited by 1,474
Beers, D. R., Henkel, J. S., Xiao, Q., Zhao, W., Wang, J., Yen, A. A., Siklos, L., McKercher, S. R., & Appel, S. H. (2006) · Proceedings of the National Academy of Sciences · doi:10.1073/pnas.0607423103 · Cited by 733
TDP-43 mutant transgenic mice develop features of ALS and frontotemporal lobar degeneration
Wegorzewska, I., Bell, S., Cairns, N. J., Miller, T. M., & Baloh, R. H. (2009) · Proceedings of the National Academy of Sciences · doi:10.1073/pnas.0908767106 · Cited by 706
Chiu, I. M., Morimoto, E. T. A., Goodarzi, H., Liao, J. T., O’Keeffe, S., Phatnani, H. P., Muratet, M., Carroll, M. C., Levy, S., Tavazoie, S., et al. (2013) · Cell Reports · doi:10.1016/j.celrep.2013.06.018 · Cited by 651
Research works printed but not linked: 1
- Ludolph, A. Amyotrophic lateral sclerosis & frontotemporal degeneration. A Revis. El Escorial criteria 16, 291–292 (2015).
Cited by
Sorted by citations
Microglia in neurodegenerative diseases: mechanism and potential therapeutic targets
Gao, C., Jiang, J., Tan, Y., & Chen, S. (2023) · Signal Transduction and Targeted Therapy · doi:10.1038/s41392-023-01588-0 · Cited by 1,616
Transforming the understanding of brain immunity
Castellani, G., Croese, T., Peralta Ramos, J. M., & Schwartz, M. (2023) · Science · doi:10.1126/science.abo7649 · Cited by 386
Strzelec, M., Detka, J., Mieszczak, P., Sobocińska, M. K., & Majka, M. (2023) · Frontiers in Immunology · doi:10.3389/fimmu.2023.1127704 · Cited by 266
The microglial component of amyotrophic lateral sclerosis
Clarke, B. E., & Patani, R. (2020) · Brain · doi:10.1093/brain/awaa309 · Cited by 164
Lyu, Z., Ding, L., Tintaru, A., & Peng, L. (2020) · Accounts of Chemical Research · doi:10.1021/acs.accounts.0c00589 · Cited by 152
Self-citationSingle-cell dissection of the human motor and prefrontal cortices in ALS and FTLD
Pineda, S. S., Lee, H., Fitzwalter, B. E., Mohammadi, S., Pregent, L., Gardashli, M., Mantero, J. C., Engelberg-Cook, E., DeJesus‐Hernandez, M., van Blitterswijk, M., et al. (2024) · Cell · doi:10.1016/j.cell.2024.02.031 · Cited by 158
Non-neuronal cells in amyotrophic lateral sclerosis — from pathogenesis to biomarkers
Vahsen, B. F., Gray, E., Thompson, A. G., Ansorge, O., Anthony, D. C., Cowley, S. A., Talbot, K., & Turner, M. R. (2021) · Nature Reviews Neurology · doi:10.1038/s41582-021-00487-8 · Cited by 147
The Emerging Role of Central and Peripheral Immune Systems in Neurodegenerative Diseases
Zang, X., Chen, S., Zhu, J., Ma, J., & Zhai, Y. (2022) · Frontiers in Aging Neuroscience · doi:10.3389/fnagi.2022.872134 · Cited by 139
Béland, L.-C., Markovinovic, A., Jakovac, H., De Marchi, F., Bilic, E., Mazzini, L., Kriz, J., & Munitic, I. (2020) · Brain Communications · doi:10.1093/braincomms/fcaa124 · Cited by 125
Chiot, A., Zaïdi, S., Iltis, C., Ribon, M., Berriat, F., Schiaffino, L., Jolly, A., de la Grange, P., Mallat, M., Bohl, D., et al. (2020) · Nature Neuroscience · doi:10.1038/s41593-020-00718-z · Cited by 122
Regulatory T-cells inhibit microglia-induced pain hypersensitivity in female mice
Kuhn, J., Vainchtein, I. D., Braz, J. M., Hamel, K. A., Bernstein, M. X., Craik, V., Dahlgren, M. W., Ortiz-Carpena, J. F., Molofsky, A. B., Molofsky, A. V., et al. (2021) · eLife · doi:10.7554/elife.69056 · Cited by 107
The contribution of the peripheral immune system to neurodegeneration
Berriat, F., Lobsiger, C. S., & Boillée, S. (2023) · Nature Neuroscience · doi:10.1038/s41593-023-01323-6 · Cited by 87
The role of natural killer cells in Parkinson’s disease
Earls, R. H., & Lee, J. (2020) · Experimental & Molecular Medicine · doi:10.1038/s12276-020-00505-7 · Cited by 94
Amphiphilic Dendrimer Vectors for RNA Delivery: State-of-the-Art and Future Perspective
Chen, J., Zhu, D., Liu, X., & Peng, L. (2022) · Accounts of Materials Research · doi:10.1021/accountsmr.1c00272 · Cited by 84
Self-citationAppel, S. H., Beers, D. R., & Zhao, W. (2021) · Current Opinion in Neurology · doi:10.1097/wco.0000000000000983 · Cited by 79
Masrori, P., Beckers, J., Gossye, H., & Damme, P. V. (2022) · Molecular Neurodegeneration · doi:10.1186/s13024-022-00525-z · Cited by 80
Umbilical Cord Mesenchymal Stem Cells in Amyotrophic Lateral Sclerosis: an Original Study
Barczewska, M., Maksymowicz, S., Zdolińska-Malinowska, I., Siwek, T., & Grudniak, M. (2020) · Stem Cell Reviews and Reports · doi:10.1007/s12015-020-10016-7 · Cited by 65
NK cells associate with ALS in a sex- and age-dependent manner
Murdock, B. J., Famie, J. P., Piecuch, C. E., Pawlowski, K. D., Mendelson, F. E., Pieroni, C. H., Iniguez, S. D., Zhao, L., Goutman, S. A., & Feldman, E. L. (2021) · JCI Insight · doi:10.1172/jci.insight.147129 · Cited by 65
Synthesis and use of an amphiphilic dendrimer for siRNA delivery into primary immune cells
Chen, J., Ellert‐Miklaszewska, A., Garofalo, S., Dey, A. K., Tang, J., Jiang, Y., Clément, F., Marche, P. N., Liu, X., Kaminska, B., et al. (2020) · Nature Protocols · doi:10.1038/s41596-020-00418-9 · Cited by 64
Self-citationGarofalo, S., Cocozza, G., Bernardini, G., Savage, J. C., Raspa, M., Aronica, E., Tremblay, M., Ransohoff, R. M., Santoni, A., & Limatola, C. (2022) · Brain Behavior and Immunity · doi:10.1016/j.bbi.2022.06.004 · Cited by 59
Self-citationLiu, R., Li, Y., Wang, Z., Chen, P., Xie, Y., Qu, W., Wang, M., Yu, Z., & Luo, X. (2023) · CNS Neuroscience & Therapeutics · doi:10.1111/cns.14161 · Cited by 58
The immune system as a system of relations
Daëron, M. (2022) · Frontiers in Immunology · doi:10.3389/fimmu.2022.984678 · Cited by 60
Garofalo, S., Cocozza, G., Mormino, A., Bernardini, G., Russo, E., Ielpo, D., Andolina, D., Ventura, R., Martinello, K., Renzi, M., et al. (2023) · Nature Communications · doi:10.1038/s41467-023-38899-3 · Cited by 55
Self-citationInterplay between immunity and amyotrophic lateral sclerosis: Clinical impact
Marchi, F. D., Munitić, I., Amedei, A., Berry, J. D., Feldman, E. L., Aronica, E., Nardo, G., Weehaeghe, D. V., Niccolai, E., Prtenjača, N., et al. (2021) · Neuroscience & Biobehavioral Reviews · doi:10.1016/j.neubiorev.2021.06.027 · Cited by 52
Self-citationCorrelation between leukocyte phenotypes and prognosis of amyotrophic lateral sclerosis
Cui, C., Ingre, C., Yin, L., Li, X., Andersson, J., Seitz, C., Ruffin, N., Pawitan, Y., Piehl, F., & Fang, F. (2022) · eLife · doi:10.7554/elife.74065 · Cited by 52
You, J., Youssef, M., Santos, J. R., Lee, J., & Park, J. (2023) · Biology · doi:10.3390/biology12101307 · Cited by 60
Microglia: The Hub of Intercellular Communication in Ischemic Stroke
Zhang, Y., Lian, L., Fu, R., Liu, J., Shan, X., Jin, Y., & Xu, S. (2022) · Frontiers in Cellular Neuroscience · doi:10.3389/fncel.2022.889442 · Cited by 51
Cargo-selective and adaptive delivery of nucleic acid therapeutics by bola-amphiphilic dendrimers
Chen, J., Zhu, D., Lian, B., Shi, K., Chen, P., Li, Y., Lin, W., Ding, L., Long, Q., Wang, Y., et al. (2023) · Proceedings of the National Academy of Sciences · doi:10.1073/pnas.2220787120 · Cited by 49
Self-citationThe role of the CD8+ T cell compartment in ageing and neurodegenerative disorders
Terrabuio, E., Zenaro, E., & Constantin, G. (2023) · Frontiers in Immunology · doi:10.3389/fimmu.2023.1233870 · Cited by 51
Neuroinflammation in amyotrophic lateral sclerosis: pathogenic insights and therapeutic implications
Calma, A. D., Pavey, N., Menon, P., & Vucic, S. (2024) · Current Opinion in Neurology · doi:10.1097/wco.0000000000001279 · Cited by 48
Brain endothelial CXCL12 attracts protective natural killer cells during ischemic stroke
Wang, S., de Fabritus, L., Kumar, P. A., Werner, Y., Ma, M., Li, D., Siret, C., Simic, M., Li, B., Kerdiles, Y. M., et al. (2023) · Journal of Neuroinflammation · doi:10.1186/s12974-023-02689-x · Cited by 51
Dhumal, D. M., Lan, W., Ding, L., Jiang, Y., Lyu, Z., Laurini, E., Marson, D., Tintaru, A., Dusetti, N., Giorgio, S., et al. (2020) · Nano Research · doi:10.1007/s12274-020-3216-8 · Cited by 46
Self-citationHe, D., Xu, Y. C., Liu, M., & Cui, L. (2023) · Aging and Disease · doi:10.14336/ad.2023.0519 · Cited by 44
Yu, W., He, J., Cai, X., Yu, Z., Zou, Z., & Fan, D. (2022) · Frontiers in Aging Neuroscience · doi:10.3389/fnagi.2022.890958 · Cited by 41
Natural killer cells in the central nervous system
Ning, Z., Liu, Y., Guo, D., Lin, W., & Tang, Y. (2023) · Cell Communication and Signaling · doi:10.1186/s12964-023-01324-9 · Cited by 41
Anderson, G. (2022) · International Journal of Molecular Sciences · doi:10.3390/ijms24010587 · Cited by 36
Figueroa‐Romero, C., Monteagudo, A., Murdock, B. J., Famie, J. P., Webber‐Davis, I. F., Piecuch, C. E., Teener, S. J., Pacut, C. M., Goutman, S. A., & Feldman, E. L. (2022) · Frontiers in Immunology · doi:10.3389/fimmu.2022.773288 · Cited by 35
Tissue-Dependent Adaptations and Functions of Innate Lymphoid Cells
Murphy, J. M., Ngai, L., Mortha, A., & Crome, S. Q. (2022) · Frontiers in Immunology · doi:10.3389/fimmu.2022.836999 · Cited by 36
Janus kinase inhibitors are potential therapeutics for amyotrophic lateral sclerosis
Richardson, P. J., Smith, D. P., de Giorgio, A., Snetkov, X., Almond-Thynne, J., Cronin, S., Mead, R. J., McDermott, C. J., & Shaw, P. J. (2023) · Translational Neurodegeneration · doi:10.1186/s40035-023-00380-y · Cited by 35
The role of CD56bright NK cells in neurodegenerative disorders
Rodriguez-Mogeda, C., van Ansenwoude, C. M. J., van der Molen, L. H., Strijbis, E. M. M., Mebius, R. E., & de Vries, H. E. (2024) · Journal of Neuroinflammation · doi:10.1186/s12974-024-03040-8 · Cited by 39
Gut microbiota immune cross-talk in amyotrophic lateral sclerosis
Kaul, M., Mukherjee, D., Weiner, H. L., & Cox, L. M. (2024) · Neurotherapeutics · doi:10.1016/j.neurot.2024.e00469 · Cited by 36
Cytokines and Chemokines Modulation of Itch
Du, L., Zhu, J., & Mi, W. (2022) · Neuroscience · doi:10.1016/j.neuroscience.2022.05.035 · Cited by 34
NK cells in the brain: implications for brain tumor development and therapy
Balatsoukas, A., Rossignoli, F., & Shah, K. (2022) · Trends in Molecular Medicine · doi:10.1016/j.molmed.2021.12.008 · Cited by 34
Innate Lymphoid Cells in the Central Nervous System
Wang, S., & van de Pavert, S. A. (2022) · Frontiers in Immunology · doi:10.3389/fimmu.2022.837250 · Cited by 36
Small Activating RNA Modulation of the G Protein‐Coupled Receptor for Cancer Treatment
Xiong, Y., Ke, R., Zhang, Q., Lan, W., Yuan, W., Chan, K. N. I., Roussel, T., Jiang, Y., Wu, J., Liu, S., et al. (2022) · Advanced Science · doi:10.1002/advs.202200562 · Cited by 32
Self-citationIon Channels Orchestrate Pancreatic Ductal Adenocarcinoma Progression and Therapy
Hofschröer, V., Najder, K., Rugi, M., Bouazzi, R., Cozzolino, M., Arcangeli, A., Panyi, G., & Schwab, A. (2021) · Frontiers in Pharmacology · doi:10.3389/fphar.2020.586599 · Cited by 33
Liu, E., Karpf, L., & Bohl, D. (2021) · Frontiers in Molecular Neuroscience · doi:10.3389/fnmol.2021.767041 · Cited by 32
Histone‐deacetylase 8 drives the immune response and the growth of glioma
Mormino, A., Cocozza, G., Fontemaggi, G., Valente, S., Esposito, V., Santoro, A., Bernardini, G., Santoni, A., Fazi, F., Mai, A., et al. (2021) · Glia · doi:10.1002/glia.24065 · Cited by 30
Self-citationGautam, M., Günay, A., Chandel, N. S., & Özdinler, P. H. (2022) · Scientific Reports · doi:10.1038/s41598-022-08068-5 · Cited by 34
Immunology of amyotrophic lateral sclerosis – role of the innate and adaptive immunity
Mimic, S., Aru, B., Pehlivanoğlu, C., Sleiman, H., Anđjus, P. R., & Demirel, G. Y. (2023) · Frontiers in Neuroscience · doi:10.3389/fnins.2023.1277399 · Cited by 29
Carata, E., Muci, M., Giulio, S. D., Mariano, S., & Panzarini, E. (2023) · International Journal of Molecular Sciences · doi:10.3390/ijms241411251 · Cited by 30
Microglial crosstalk with astrocytes and immune cells in amyotrophic lateral sclerosis
Calafatti, M., Cocozza, G., Limatola, C., & Garofalo, S. (2023) · Frontiers in Immunology · doi:10.3389/fimmu.2023.1223096 · Cited by 29
Self-citationTargeting common disease pathomechanisms to treat amyotrophic lateral sclerosis
Faller, K. M. E., Chaytow, H., & Gillingwater, T. H. (2025) · Nature Reviews Neurology · doi:10.1038/s41582-024-01049-4 · Cited by 30
Giovannelli, I., Bayatti, N., Brown, A. G., Wang, D. Y. Q., Mickunas, M., Camu, W., Veyrune, J., Payan, C., Garlanda, C., Locati, M., et al. (2021) · Brain Communications · doi:10.1093/braincomms/fcab141 · Cited by 27
Cao, W., Cao, Z., Tian, Y., Zhang, L., Wang, W., Tang, L., Xu, C., & Fan, D. (2023) · Annals of Neurology · doi:10.1002/ana.26760 · Cited by 27
New Insights and Implications of Natural Killer Cells in Parkinson’s Disease
Menees, K. B., & Lee, J. (2022) · Journal of Parkinson s Disease · doi:10.3233/jpd-223212 · Cited by 26
Sublethal enteroviral infection exacerbates disease progression in an ALS mouse model
Xue, Y. C., Liu, H., Mohamud, Y., Bahreyni, A., Zhang, J., Cashman, N. R., & Luo, H. (2022) · Journal of Neuroinflammation · doi:10.1186/s12974-022-02380-7 · Cited by 24
COVID-19, ferrosenescence and neurodegeneration, a mini-review
Sfera, A., Osorio, C. P., Maguire, G. A., Rahman, L., Jafri, A., Cummings, M. A., & Maldonado, J. C. (2020) · Progress in Neuro-Psychopharmacology and Biological Psychiatry · doi:10.1016/j.pnpbp.2020.110230 · Cited by 21
Hoecke, L. V., Lucci, C., & Vandenbroucke, R. E. (2025) · Trends in Neurosciences · doi:10.1016/j.tins.2025.09.008 · Cited by 23
Neurodegenerative diseases and brain delivery of therapeutics: Bridging the gap using dendrimers
Kaur, A., Singh, N., Kaur, H., Kakoty, V., Sharma, D. S., Khursheed, R., Babu, M. R., Harish, V., Gupta, G., Gulati, M., et al. (2023) · Journal of Drug Delivery Science and Technology · doi:10.1016/j.jddst.2023.104868 · Cited by 19
Graber, D. J., Cook, W. J., Sentman, M.-L., Murad-Mabaera, J. M., & Sentman, C. L. (2023) · Cytotherapy · doi:10.1016/j.jcyt.2023.11.007 · Cited by 19
Peripheral Immune Profiles Predict ALS Progression in an Age- and Sex-Dependent Manner
Murdock, B. J., Zhao, B., Pawlowski, K. D., Famie, J. P., Piecuch, C. E., Webber‐Davis, I. F., Teener, S. J., Feldman, E. L., Zhao, L., & Goutman, S. A. (2024) · Neurology Neuroimmunology & Neuroinflammation · doi:10.1212/nxi.0000000000200241 · Cited by 19
The pathogenic role of c-Kit+ mast cells in the spinal motor neuron-vascular niche in ALS
Kovacs, M., Alamón, C., Maciel, C., Varela, V., Ibarburu, S., Tarragó, L., King, P. H., Si, Y., Kwon, Y., Hermine, O., et al. (2021) · Acta Neuropathologica Communications · doi:10.1186/s40478-021-01241-3 · Cited by 21
(2023) · Advances in magnetic resonance technology and applications · doi:10.1016/b978-0-323-91771-1.00016-2 · Cited by 19
Clinical Safety and Preliminary Efficacy of Regulatory T Cells for ALS
Shneider, N. A., Nesta, A. V., Rifai, O. M., Yasek, J. E., Elyaman, W., Aziz‐Zaman, S., Lyu, M.-A., Lévy, S., Hoover, B. N., Vlad, G., et al. (2025) · NEJM Evidence · doi:10.1056/evidoa2400249 · Cited by 18
The therapeutic potential of natural killer cells in neuropathic pain
Kim, H. W., Wang, S., Davies, A. J., & Oh, S. B. (2023) · Trends in Neurosciences · doi:10.1016/j.tins.2023.05.008 · Cited by 19
Sirkis, D. W., Solsberg, C. W., Johnson, T. P., Bonham, L. W., Sturm, V. E., Lee, S. E., Rankin, K. P., Rosen, H. J., Boxer, A. L., Seeley, W. W., et al. (2023) · Genome Medicine · doi:10.1186/s13073-023-01205-3 · Cited by 19
Immunological drivers of amyotrophic lateral sclerosis
Gendron, T. F., & Petrucelli, L. (2023) · Science Translational Medicine · doi:10.1126/scitranslmed.adj9332 · Cited by 18
Microglial Potassium Channels: From Homeostasis to Neurodegeneration
Cocozza, G., Garofalo, S., Capitani, R., D’Alessandro, G., & Limatola, C. (2021) · Biomolecules · doi:10.3390/biom11121774 · Cited by 19
Self-citationNeuroimmune interactions and their roles in neurodegenerative diseases
Chen, B.-R., Wu, T., Chen, T.-H., & Wang, Y. (2023) · Fundamental Research · doi:10.1016/j.fmre.2023.04.002 · Cited by 18
Piccoli, T., Castro, F., Bella, V. L., Meraviglia, S., Simone, M. D., Salemi, G., Dieli, F., & Spataro, R. (2023) · BMC Neurology · doi:10.1186/s12883-023-03255-x · Cited by 17
Álvarez‐Sánchez, E., Carbayo, Á., Valle‐Tamayo, N., Muñoz, L., Aumatell, J., Torres, S., Rubio‐Guerra, S., Castro, J. G., Selma‐González, J., Alcolea, D. A., et al. (2025) · Journal of Neuroinflammation · doi:10.1186/s12974-025-03347-0 · Cited by 15
Gong, Z., Liu, Y., Ding, F., Ba, L., & Zhang, M. (2022) · Frontiers in Neuroscience · doi:10.3389/fnins.2022.981371 · Cited by 15
Wang, J., Gao, Y., Xiao, L., Lin, Y., Huang, L., Chen, J., Liang, G., Li, W., Yi, W., Lao, J., et al. (2023) · iScience · doi:10.1016/j.isci.2023.107476 · Cited by 15
Effect and Mechanism of Sodium Butyrate on Neuronal Recovery and Prognosis in Diabetic Stroke
Li, T., Zhao, D.-M., Wei, Y., Li, J.-B., Li, X., Wan, Q., Zhang, X., Liu, X.-N., Yang, W., & Li, W. (2023) · Journal of Neuroimmune Pharmacology · doi:10.1007/s11481-023-10071-0 · Cited by 14
Pathological Role of Natural Killer Cells in Parkinson's Disease: A Systematic Review
Zhang, L., Zhang, Y., & Fan, D. (2022) · Frontiers in Aging Neuroscience · doi:10.3389/fnagi.2022.890816 · Cited by 14
Innate lymphoid cells in neuroinflammation
Kveštak, D., Mihalić, A., Jonjić, S., & Brizić, I. (2024) · Frontiers in Cellular Neuroscience · doi:10.3389/fncel.2024.1364485 · Cited by 14
Dysfunction of RNA/RNA-Binding Proteins in ALS Astrocytes and Microglia
Rossi, S., & Cozzolino, M. (2021) · Cells · doi:10.3390/cells10113005 · Cited by 15
Murdock, B. J., Zhao, B., Webber‐Davis, I. F., Teener, S. J., Pawlowski, K. D., Famie, J. P., Piecuch, C. E., Jang, D., Feldman, E. L., Zhao, L., et al. (2025) · Med · doi:10.1016/j.medj.2025.100673 · Cited by 12
Cocozza, G., Busdraghi, L. M., Chece, G., Menini, A., Ceccanti, M., Libonati, L., Cambieri, C., Fiorentino, F., Rotili, D., Scavizzi, F., et al. (2024) · Brain Behavior and Immunity · doi:10.1016/j.bbi.2024.12.010 · Cited by 12
Self-citationAssociation of immune cell traits with Parkinson’s disease: a Mendelian randomization study
Song, Z., Li, W., Han, Y., Xu, Y., Ding, H., & Wang, Y. (2024) · Frontiers in Aging Neuroscience · doi:10.3389/fnagi.2024.1340110 · Cited by 10
Wang, Z., Cao, W., Chen, L., Zhang, S., Tang, L., Cui, W., Kong, M., Yu, L., Fan, D., & Zheng, W. (2025) · Neural Regeneration Research · doi:10.4103/nrr.nrr-d-24-01081 · Cited by 9
Monov, D., & Molodozhnikova, N. (2024) · Frontiers in Neurology · doi:10.3389/fneur.2023.1258224 · Cited by 11
Perimenopausal depression: Targeting inflammation and oxidative stress (Review)
Yu, Y., Yu, T., Liu, K., Li, Y., Luan, Y., Yang, T., Li, W., Cong, H., & Wu, X. (2025) · Molecular Medicine Reports · doi:10.3892/mmr.2025.13526 · Cited by 9
Muribaculum intestinale negatively impacts glioma growth in mice through the toll-like receptor 2
Marrocco, F., Cocozza, G., Antonangeli, F., Khan, M. V., Pietropaolo, G., Elkihel, A., Favaretto, G., Lin, X., Mancinelli, R., Busdraghi, L. M., et al. (2026) · Gut Microbes · doi:10.1080/19490976.2026.2623349 · Cited by 8
Self-citationYang, J. M., Zhang, S., Li, X., Chen, Z., Xu, J., Chen, J., Tan, Y., Li, G., Yu, B., Gu, X., et al. (2024) · Journal of Advanced Research · doi:10.1016/j.jare.2024.07.008 · Cited by 8
Liu, J., Zhao, W., Guo, J., Kang, K., Li, H., Yang, X., Li, J., Wang, Q., & Qiao, H. (2024) · Brain Research Bulletin · doi:10.1016/j.brainresbull.2024.111036 · Cited by 8
Allogeneic B cell immunomodulatory therapy in amyotrophic lateral sclerosis
Sîrbulescu, R. F., Nicholson, K. A., Kawai, K., Hilton, O., Sobell, D., Jin, G., Verrill, D. E., Dwyer, L., Xiong, Y., Bachanová, P., et al. (2024) · The FASEB Journal · doi:10.1096/fj.202302659r · Cited by 7
Matsuo, K., Nagamatsu, J., Nagata, K., Umeda, R., Shiota, T., Morimoto, S., Suzuki, N., Aoki, M., Okano, H., Nakamori, M., et al. (2024) · Frontiers in Cell and Developmental Biology · doi:10.3389/fcell.2024.1357204 · Cited by 8
Association of apolipoprotein E ε4 allele and amyotrophic lateral sclerosis in Chinese population
He, D., Shang, L., Liu, Q. F., Shen, D., Sun, X., Cai, Z., Zhao, X., Liu, L., Yang, X., Liu, M., et al. (2021) · Amyotrophic Lateral Sclerosis and Frontotemporal Degeneration · doi:10.1080/21678421.2021.1953077 · Cited by 7
Kabiljo, R., Marriott, H., Hunt, G. P., Pfaff, A. L., Khleifat, A. A., Adey, B. N., Jones, A., Troakes, C., Quinn, J. P., Dobson, R., et al. (2023) · medRxiv · doi:10.1101/2023.05.05.23289551 · Cited by 7
Astrocytes Contribute to Motor Neuron Degeneration in ALS via the TRAIL ‐ DR5 Signaling Pathway
Yang, K., Liu, Y., Deng, W., Gong, Z., Huang, L., Li, Z., & Zhang, M. (2025) · Journal of Neurochemistry · doi:10.1111/jnc.70146 · Cited by 6
Du, R., Chen, P., Mao, L., Zhu, Y., He, Z., & Huang, X. (2024) · Frontiers in Immunology · doi:10.3389/fimmu.2024.1360527 · Cited by 6
Lu, I., Cheung, P. F., Heming, M., Thomas, C., Giglio, G., Leo, M., Erdemir, M., Wirth, T., König, S., Dambietz, C. A., et al. (2024) · Nature Communications · doi:10.1038/s41467-024-48195-3 · Cited by 10
Minamiyama, S., Sakai, M., Yamaguchi, Y., Kusui, M., Wada, H., Hikiami, R., Tamaki, Y., Asada‐Utsugi, M., Shodai, A., Makino, A., et al. (2023) · Molecular Therapy — Methods & Clinical Development · doi:10.1016/j.omtm.2023.01.008 · Cited by 6
Groppa, S. A., Ciolac, D., Duarte, C. L., Garcia, C., Gasnaș, D., Leahu, P., Efremova, D., Alexandru, G., Bălănuță, T., Mîrzac, D., et al. (2021) · Advances in experimental medicine and biology · doi:10.1007/5584_2021_675 · Cited by 6
Shaping the glioblastoma microenvironment to enhance CAR-NK immunotherapy
Tang, E., & Chen, J. Y. (2025) · Frontiers in Immunology · doi:10.3389/fimmu.2025.1681966 · Cited by 5
Ratano, P., Cocozza, G., Pinchera, C., Busdraghi, L. M., Cantando, I., Martinello, K., Scioli, M., Rosito, M., Bezzi, P., Fucile, S., et al. (2024) · Frontiers in Molecular Neuroscience · doi:10.3389/fnmol.2023.1333745 · Cited by 5
Self-citationHuman CLOCK enhances neocortical function
Liu, Y., Fontenot, M. R., Kulkarni, A., Khandelwal, N., Park, S. H. E., Criswell, C. J., Harper, M. J., Xu, P., Gupta, N., Gibson, J. R., et al. (2025) · Nature Neuroscience · doi:10.1038/s41593-025-01993-4 · Cited by 10
Yazit, N. A. A., Juliana, N., Kadiman, S., Hafidz, K. M., Teng, N. I. M. F., Hamid, N. A., Effendy, N. M., Azmani, S., Abu, I. F., Aziz, N. A. S. A., et al. (2023) · International Journal of Environmental Research and Public Health · doi:10.3390/ijerph20021457 · Cited by 5
Metadata
- Authors
- Garofalo, S., Cocozza, G., Porzia, A., Inghilleri, M., Raspa, M., Scavizzi, F., Aronica, E., Bernardini, G., Peng, L., Ransohoff, R. M., Santoni, A., & Limatola, C.
- Affiliations
- Sapienza University of Rome (IT)
- Istituto Neurologico Mediterraneo (IT)
- Institute of Cell Biology and Neurobiology (IT)
- Netherlands Institute for Neuroscience (NL)
- Istituto Pasteur (IT)
- Centre National de la Recherche Scientifique (FR)
- Corresponding author
- Garofalo, Stefano
- Limatola, Cristina
- ORCID
- Venue
- Nature Communications
- Published
- 2020-04-14
- Volume
- 11
- Issue
- 1
- Pages
- 1773-1773
- ISSN
- 2041-1723 (ISSN-L)
- PMC
- PMC7156729
- OpenAlex
- W3015391013
- Cited by
- 170
- References
- 50
- Citations by year
- 2026: 24 · 2025: 25 · 2024: 30 · 2023: 36 · 2022: 25 · 2021: 19 · 2020: 11
- FWCI
- 9.85
- Type
- journal article
- Language
- en
- Open access
- gold
- doi.org
- Locations
- Nature Communications (publishedVersion, cc-by)
- PubMed Central (publishedVersion, cc-by)
- PubMed (publishedVersion)
- Pure Amsterdam UMC (publishedVersion, cc-by)
- IRIS Research product catalog (Sapienza University of Rome) (submittedVersion, cc-by)
- Data Archiving and Networked Services (DANS) (submittedVersion, other-oa)
- HAL (submittedVersion, cc-by)
- HAL (submittedVersion, other-oa)
- RePEc: Research Papers in Economics (submittedVersion)
- DOAJ (DOAJ: Directory of Open Access Journals) (submittedVersion, cc-by-sa)
- Funders
- Agence Nationale de la Recherche (ANR-16-ENM2-0004)
- Ministero dell’Istruzione, dell’Università e della Ricerca (PRIN 2015, H2020)
- Associazione Italiana per la Ricerca sul Cancro (PRIN 2015)
- Fondazione Italiana per la Ricerca sul Cancro (22329)
- Horizon 2020 Framework Programme
- Topics
- Health Sciences › Medicine › Clinical Neurology › Amyotrophic Lateral Sclerosis Research
- Life Sciences › Neuroscience › Neurology › Neuroinflammation and Neurodegeneration Mechanisms
- Life Sciences › Immunology and Microbiology › Immunology › Immune Cell Function and Interaction
- Keywords
- amyotrophic lateral sclerosis, natural killer cells, motor neuron degeneration, NKG2D ligands, MCP-1, microglial activation, interferon-gamma, regulatory T cells, neuroinflammation, motor cortex, spinal cord, neurotoxicity
- MeSH terms
- Adult, Aged, Amyotrophic Lateral Sclerosis, Animals, Disease Models, Animal, Female, Humans, Killer Cells, Natural, Male, Middle Aged, Motor Cortex, Motor Neurons, Spinal Cord, Disease Progression, Mice, Natural Cytotoxicity Triggering Receptor 1
About these checks
Registry, retraction, Cites and statistics results are computed, not judged, with one exception: a printed reference that no index lists is read once by a model before it counts as a citation error. Claims are extracted by a model and kept only when their quote appears verbatim in the text; each cited source is then checked, with a model’s help, for whether it says what the claim relies on. Those verdicts can be wrong — read the claim’s quote and the cited source before relying on one.
Statistics and arithmetic are recomputed, not judged.
Confidence bands are shown only for fields calibrated on our annotated test set. None is calibrated yet, so no band is shown.
What counts as a claim ›How we measure confidence ›How we check this ›
Are you an author, or do you see a problem with this page? Request a review
