Cited by 219DNA Repair MechanismsEpigenetics and DNA MethylationHistone Deacetylase Inhibitors Research

The DOI matches its Crossref record; 72 of the 72 references it cites were found in a registry or an index.

HDAC1 modulates OGG1-initiated oxidative DNA damage repair in the aging brain and Alzheimer’s disease

Open access

Abstract

DNA damage contributes to brain aging and neurodegenerative diseases. However, the factors stimulating DNA repair to stave off functional decline remain obscure. We show that HDAC1 modulates OGG1-initated 8-oxoguanine (8-oxoG) repair in the brain. HDAC1-deficient mice display age-associated DNA damage accumulation and cognitive impairment. HDAC1 stimulates OGG1, a DNA glycosylase known to remove 8-oxoG lesions that are associated with transcriptional repression. HDAC1 deficiency causes impaired OGG1 activity, 8-oxoG accumulation at the promoters of genes critical for brain function, and transcriptional repression. Moreover, we observe elevated 8-oxoG along with reduced HDAC1 activity and downregulation of a similar gene set in the 5XFAD mouse model of Alzheimer's disease. Notably, pharmacological activation of HDAC1 alleviates the deleterious effects of 8-oxoG in aged wild-type and 5XFAD mice. Our work uncovers important roles for HDAC1 in 8-oxoG repair and highlights the therapeutic potential of HDAC1 activation to counter functional decline in brain aging and neurodegeneration.

Overview

The claims and statistics of this paper haven’t been checked yet.

Run the check — free, no account needed. It reads the open-access text and checks the sources it cites.

A few free checks a day · papers already verified open instantly · results are public

Integrity signals

Registry

Crossref · 10.1038/s41467-020-16361-y

Cites

72 of 72 references verified0 citation errors · 0 not checkable

Statistics

Figures

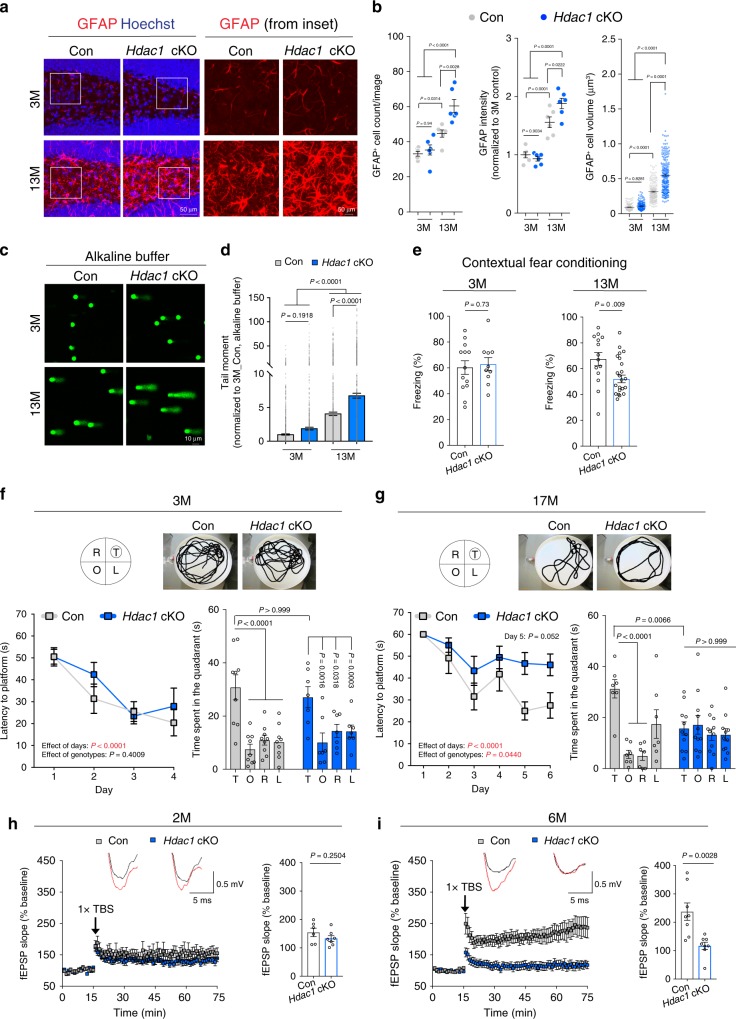
Fig. 1 Hdac1 cKO mice exhibit age-associated impairments. a Representative images of control and Hdac1 cKO mice at the age of 3 months (3M) and 13 months (13M) stained for GFAP (red) and nuclei Hoechst (blue) in the hippocampal region. b Analysis of GFAP+ cells. a, b Three mice were analyzed in each group (two sections/mouse). Cells analyzed for cell volume were: 144 (3M control), 168 (3M Hdac1 cKO), 181 (13M control), and 227 (13M Hdac1 cKO). c, d Representative images and quantification of the comet assay using hippocampal homogenates. c, d Nuclei analyzed (three mice/group) were: 1356 (3M control), 1268 (3M Hdac1 cKO), 1898 (13M control), and 1944 (13M Hdac1 cKO). e Analysis of freezing behavior during contextual fear conditioning test. Animals analyzed were: 13 (3M control), 10 (3M Hdac1 cKO), 14 (13M control), and 22 (13M Hdac1 cKO). f, g Control and Hdac1 cKO mice were subjected to the Morris water maze (MWM) test. Shown are the latencies to hidden platform during training and time spent in each quadrant during the probe trial. Images show the location of each quadrant and swim trace of mouse during the probe trial. T = target, O = opposite, R = right, L = left. Animals analyzed were: 9 (3M control), 7 (3M Hdac1 cKO), 7 (17M control), and 11 (17M Hdac1 cKO). h, i Hippocampal LTP induction in control and Hdac1 cKO mice. Animals/slices analyzed were: 3/6 (2M control), 3/7 (2M Hdac1 cKO), 4/8 (6M control), and 5/8 (6M Hdac1 cKO). Overlay of the representative field excitatory post-synaptic potential slope (fEPSPs) before (black trace) and after (red trace) LTP induction. Theta-burst stimulation (TBS). All values are shown as mean ± SEM. Statistical analysis: b, d one-way ANOVA with Tukey’s post hoc test; e, h, i two-tailed Student’s t test; f, g two-way repeated-measures ANOVA with Bonferroni’s post hoc test for acquisition phase; two-way ANOVA with Bonferroni’s post hoc test for probe trial. Source data are provided as a Source Data file.
Fig. 1 Hdac1 cKO mice exhibit age-associated impairments. a Representative images of control and Hdac1 cKO mice at the age of 3 months (3M) and 13 months (13M) stained for GFAP (red) and nuclei Hoechst (blue) in the hippocampal region. b Analysis of GFAP+ cells. a, b Three mice were analyzed in each group (two sections/mouse). Cells analyzed for cell volume were: 144 (3M control), 168 (3M Hdac1 cKO), 181 (13M control), and 227 (13M Hdac1 cKO). c, d Representative images and quantification of the comet assay using hippocampal homogenates. c, d Nuclei analyzed (three mice/group) were: 1356 (3M control), 1268 (3M Hdac1 cKO), 1898 (13M control), and 1944 (13M Hdac1 cKO). e Analysis of freezing behavior during contextual fear conditioning test. Animals analyzed were: 13 (3M control), 10 (3M Hdac1 cKO), 14 (13M control), and 22 (13M Hdac1 cKO). f, g Control and Hdac1 cKO mice were subjected to the Morris water maze (MWM) test. Shown are the latencies to hidden platform during training and time spent in each quadrant during the probe trial. Images show the location of each quadrant and swim trace of mouse during the probe trial. T = target, O = opposite, R = right, L = left. Animals analyzed were: 9 (3M control), 7 (3M Hdac1 cKO), 7 (17M control), and 11 (17M Hdac1 cKO). h, i Hippocampal LTP induction in control and Hdac1 cKO mice. Animals/slices analyzed were: 3/6 (2M control), 3/7 (2M Hdac1 cKO), 4/8 (6M control), and 5/8 (6M Hdac1 cKO). Overlay of the representative field excitatory post-synaptic potential slope (fEPSPs) before (black trace) and after (red trace) LTP induction. Theta-burst stimulation (TBS). All values are shown as mean ± SEM. Statistical analysis: b, d one-way ANOVA with Tukey’s post hoc test; e, h, i two-tailed Student’s t test; f, g two-way repeated-measures ANOVA with Bonferroni’s post hoc test for acquisition phase; two-way ANOVA with Bonferroni’s post hoc test for probe trial. Source data are provided as a Source Data file.CC BY · PubMed Central
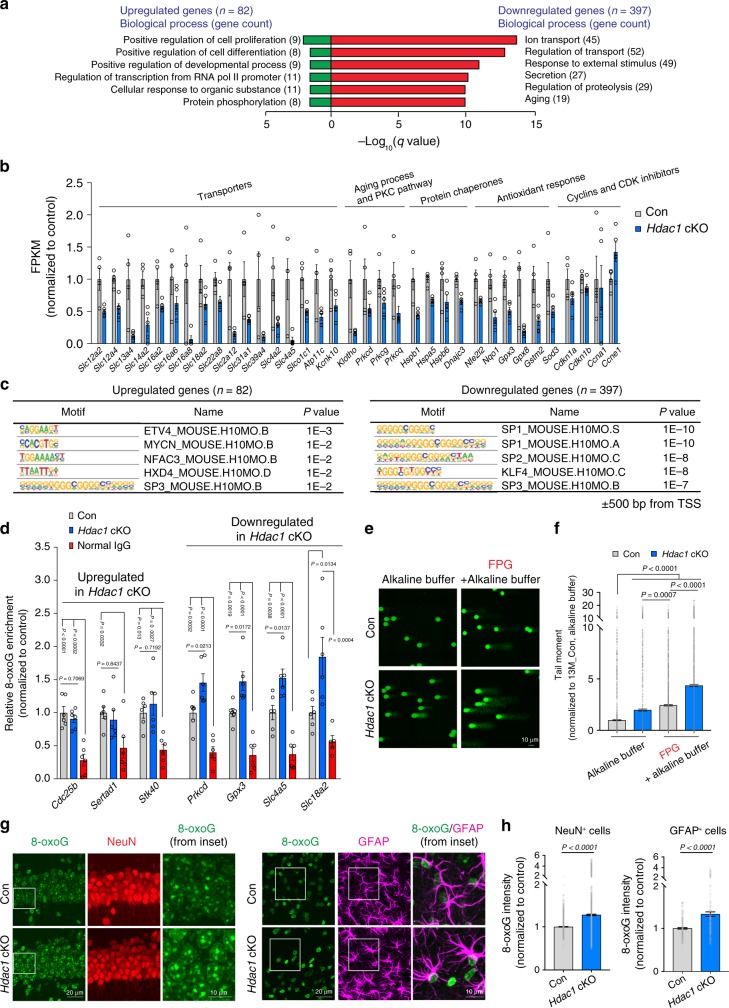
Fig. 2 Promoters of downregulated genes in aged Hdac1 cKO mice are enriched for guanine-rich motifs and 8-oxoG lesions. a Enriched GO terms of DEGs from 13M animals were annotated using MSigDB31,32. b FPKM (Fragments Per Kilobase of transcript per Million mapped reads) values of DEGs identified in 13M Hdac1 cKO mice function in ion transport, aging process, PKC pathway, protein chaperone, and antioxidant response. Cell cycle-related genes were unaltered. c Known motifs identified by HOMER program40 within upstream and downstream (±) 500 base pairs (bp) from TSS (transcriptional start site) of DEGs. d ChIP-qPCR analysis indicates the enrichment of 8-oxoG at gene promoters (500 bp upstream of TSS). At least five animals were analyzed from two independent experiments. e, f Representative images and quantification plots of the alkaline and FPG-modified comet assay using hippocampal homogenates from 13M control and Hdac1 cKO mice. e, f Nuclei analyzed (three mice/group) were: alkaline, 1928 (13M control), 1412 (13M Hdac1 cKO); FPG + alkaline, 1872 (13M control) and 1500 (13M Hdac1 cKO). g Representative images of 13M control and Hdac1 cKO mice stained for 8-oxoG (green), NeuN (red), and GFAP (magenta). h Quantification plots showing the 8-oxoG intensity. g, h Four mice were analyzed (two sections/mouse). Cells analyzed were: NeuN+ cells, 1585 (13M control), 2306 (13M Hdac1 cKO); GFAP+ cells, 191 (13M control), 164 (13M Hdac1 cKO). All values are shown as mean ± SEM. Statistical analysis: a weighted Kolmogorov–Smirnov-like test followed by multiple hypothesis testing; c cumulative binomial distributions; d, f one-way ANOVA with Tukey’s post hoc test; h two-tailed Student’s t test. Source data are provided as a Source Data file.
Fig. 2 Promoters of downregulated genes in aged Hdac1 cKO mice are enriched for guanine-rich motifs and 8-oxoG lesions. a Enriched GO terms of DEGs from 13M animals were annotated using MSigDB31,32. b FPKM (Fragments Per Kilobase of transcript per Million mapped reads) values of DEGs identified in 13M Hdac1 cKO mice function in ion transport, aging process, PKC pathway, protein chaperone, and antioxidant response. Cell cycle-related genes were unaltered. c Known motifs identified by HOMER program40 within upstream and downstream (±) 500 base pairs (bp) from TSS (transcriptional start site) of DEGs. d ChIP-qPCR analysis indicates the enrichment of 8-oxoG at gene promoters (500 bp upstream of TSS). At least five animals were analyzed from two independent experiments. e, f Representative images and quantification plots of the alkaline and FPG-modified comet assay using hippocampal homogenates from 13M control and Hdac1 cKO mice. e, f Nuclei analyzed (three mice/group) were: alkaline, 1928 (13M control), 1412 (13M Hdac1 cKO); FPG + alkaline, 1872 (13M control) and 1500 (13M Hdac1 cKO). g Representative images of 13M control and Hdac1 cKO mice stained for 8-oxoG (green), NeuN (red), and GFAP (magenta). h Quantification plots showing the 8-oxoG intensity. g, h Four mice were analyzed (two sections/mouse). Cells analyzed were: NeuN+ cells, 1585 (13M control), 2306 (13M Hdac1 cKO); GFAP+ cells, 191 (13M control), 164 (13M Hdac1 cKO). All values are shown as mean ± SEM. Statistical analysis: a weighted Kolmogorov–Smirnov-like test followed by multiple hypothesis testing; c cumulative binomial distributions; d, f one-way ANOVA with Tukey’s post hoc test; h two-tailed Student’s t test. Source data are provided as a Source Data file.CC BY · PubMed Central
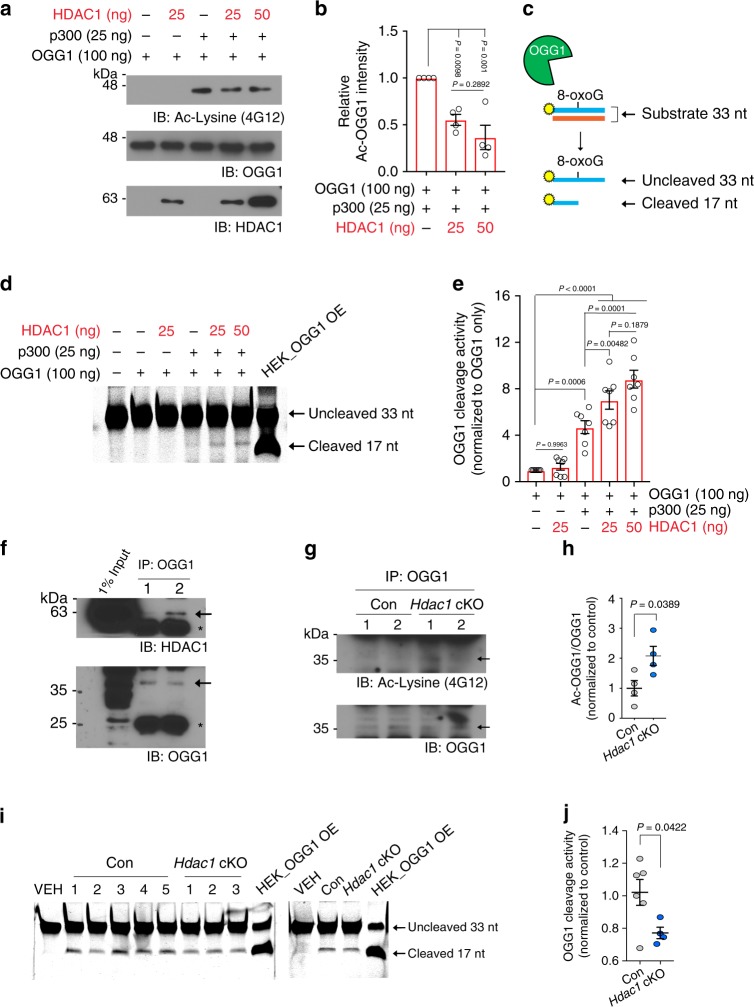
Fig. 3 HDAC1 modulates OGG1 activity. a, b Representative images and quantification of OGG1 acetylation assessed by western blot analysis using antibody against acetylated lysine (Ac-Lysine, 4G12). Recombinant OGG1 (100 ng) was first acetylated by p300 (25 ng), and then incubated with titrated amount of HDAC1 (25 and 50 ng). a, b Four replicates from four independent experiments. c Reaction scheme of OGG1 cleavage assay. 5′IRDye800CW-labeled oligonucleotides (33 nt) that contain an 8-oxoG base at position 17 and complementary unlabeled strand were used as OGG1 substrate. Recombinant OGG1 proteins were incubated with OGG1 substrate and resolved by 20% denaturing urea PAGE. d, e Representative images and quantification of OGG1 cleavage activity on the reaction samples shown in Fig. 3a. d, e Seven replicates from four independent experiments. Nuclear extracts from HEK cells overexpressing OGG1 were used as a positive control. f Co-immunoprecipitation of OGG1 with HDAC1 in cortical nuclear extracts from 2-month-old wild-type mice (n = 2) from one experiment. The asterisks indicate the nonspecific cross-reaction with the IgG heavy and light chains. g, h Representative images and quantification of acetylation status of endogenous OGG1 in hippocampal lysates of 13M control (n = 4) and Hdac1 cKO (n = 4) animals. g, h Two independent experiments. i Representative images of OGG1 cleavage assay using hippocampal nuclear extracts of 13M control and Hdac1 cKO mice. j Quantification of cleaved 17-nt products after OGG1 cleavage assay using hippocampal nuclear extracts of 13M control (n = 6) and Hdac1 cKO (n = 4) animals. i, j Two independent experiments. All values are shown as mean ± SEM. Statistical analysis: b, e one-way ANOVA with Tukey’s post hoc test; h, j two-tailed Student’s t test. Source data are provided as a Source Data file.
Fig. 3 HDAC1 modulates OGG1 activity. a, b Representative images and quantification of OGG1 acetylation assessed by western blot analysis using antibody against acetylated lysine (Ac-Lysine, 4G12). Recombinant OGG1 (100 ng) was first acetylated by p300 (25 ng), and then incubated with titrated amount of HDAC1 (25 and 50 ng). a, b Four replicates from four independent experiments. c Reaction scheme of OGG1 cleavage assay. 5′IRDye800CW-labeled oligonucleotides (33 nt) that contain an 8-oxoG base at position 17 and complementary unlabeled strand were used as OGG1 substrate. Recombinant OGG1 proteins were incubated with OGG1 substrate and resolved by 20% denaturing urea PAGE. d, e Representative images and quantification of OGG1 cleavage activity on the reaction samples shown in Fig. 3a. d, e Seven replicates from four independent experiments. Nuclear extracts from HEK cells overexpressing OGG1 were used as a positive control. f Co-immunoprecipitation of OGG1 with HDAC1 in cortical nuclear extracts from 2-month-old wild-type mice (n = 2) from one experiment. The asterisks indicate the nonspecific cross-reaction with the IgG heavy and light chains. g, h Representative images and quantification of acetylation status of endogenous OGG1 in hippocampal lysates of 13M control (n = 4) and Hdac1 cKO (n = 4) animals. g, h Two independent experiments. i Representative images of OGG1 cleavage assay using hippocampal nuclear extracts of 13M control and Hdac1 cKO mice. j Quantification of cleaved 17-nt products after OGG1 cleavage assay using hippocampal nuclear extracts of 13M control (n = 6) and Hdac1 cKO (n = 4) animals. i, j Two independent experiments. All values are shown as mean ± SEM. Statistical analysis: b, e one-way ANOVA with Tukey’s post hoc test; h, j two-tailed Student’s t test. Source data are provided as a Source Data file.CC BY · PubMed Central
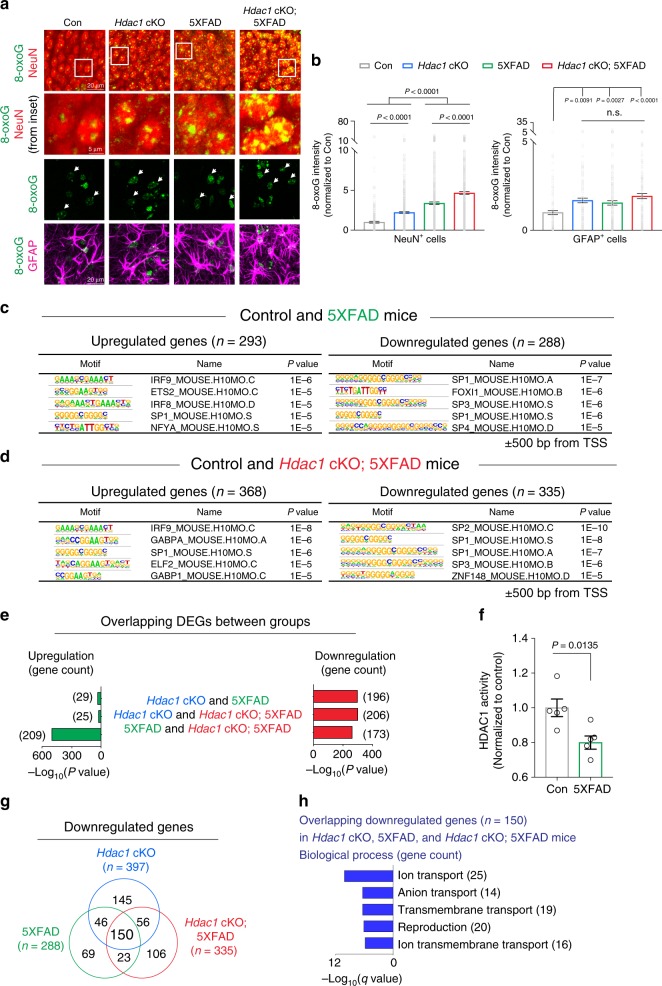
Fig. 4 Increased 8-oxoG lesions and downregulation of genes with guanine-rich motifs at promoters in 5XFAD mice. a, b Representative images and quantifications of 8-oxoG intensity in NeuN+ cells and GFAP+ cells. 14M animals stained for 8-oxoG (green), NeuN (red), and GFAP (magenta). a, b Three mice were analyzed per group (two sections/mouse). Nuclei analyzed were: NeuN+ cells, 409 (control), 683 (Hdac1 cKO), 962 (5XFAD), 910 (Hdac1 cKO; 5XFAD); GFAP+ cells, 104 (control), 121 (Hdac1 cKO), 204 (5XFAD), 155 (Hdac1 cKO; 5XFAD). White arrows indicate GFAP+ cells. c Known motifs identified by HOMER program40 within ±500 bp from TSS of DEGs c 13M control and 5XFAD mice. d 13M control and Hdac1 cKO; 5XFAD mice. e Bar graphs showing the amount of DEGs overlaps between groups (Hdac1 cKO, 5XFAD, and Hdac1 cKO; 5XFAD mice at the age of 13 months) and enrichment significance. f Hippocampal tissues from 13M control and 5XFAD mice were assayed for HDAC1 activity. Five animals were analyzed in each group. g A Venn diagram showing the overlap in downregulated genes between Hdac1 cKO, 5XFAD, and Hdac1 cKO; 5XFAD mice at the age of 13 months. h Enriched GO terms of overlapping genes between Hdac1 cKO, 5XFAD, and Hdac1 cKO; 5XFAD mice at the age of 13 months, annotated using MSigDB31,32. All values are shown as mean ± SEM. Statistical analysis: b one-way ANOVA with Tukey’s post hoc test, n.s., not significant. P value of each comparison: Hdac1 cKO versus 5XFAD = 0.8823; Hdac1 cKO versus Hdac1 cKO; 5XFAD = 0.5983; 5XFAD versus Hdac1 cKO; 5XFAD = 0.1215; c, d cumulative binomial distributions; e two-tailed Fisher’s exact test; f two-tailed Student’s t test; h weighted Kolmogorov–Smirnov-like test followed by multiple hypothesis testing. Source data are provided as a Source Data file.
Fig. 4 Increased 8-oxoG lesions and downregulation of genes with guanine-rich motifs at promoters in 5XFAD mice. a, b Representative images and quantifications of 8-oxoG intensity in NeuN+ cells and GFAP+ cells. 14M animals stained for 8-oxoG (green), NeuN (red), and GFAP (magenta). a, b Three mice were analyzed per group (two sections/mouse). Nuclei analyzed were: NeuN+ cells, 409 (control), 683 (Hdac1 cKO), 962 (5XFAD), 910 (Hdac1 cKO; 5XFAD); GFAP+ cells, 104 (control), 121 (Hdac1 cKO), 204 (5XFAD), 155 (Hdac1 cKO; 5XFAD). White arrows indicate GFAP+ cells. c Known motifs identified by HOMER program40 within ±500 bp from TSS of DEGs c 13M control and 5XFAD mice. d 13M control and Hdac1 cKO; 5XFAD mice. e Bar graphs showing the amount of DEGs overlaps between groups (Hdac1 cKO, 5XFAD, and Hdac1 cKO; 5XFAD mice at the age of 13 months) and enrichment significance. f Hippocampal tissues from 13M control and 5XFAD mice were assayed for HDAC1 activity. Five animals were analyzed in each group. g A Venn diagram showing the overlap in downregulated genes between Hdac1 cKO, 5XFAD, and Hdac1 cKO; 5XFAD mice at the age of 13 months. h Enriched GO terms of overlapping genes between Hdac1 cKO, 5XFAD, and Hdac1 cKO; 5XFAD mice at the age of 13 months, annotated using MSigDB31,32. All values are shown as mean ± SEM. Statistical analysis: b one-way ANOVA with Tukey’s post hoc test, n.s., not significant. P value of each comparison: Hdac1 cKO versus 5XFAD = 0.8823; Hdac1 cKO versus Hdac1 cKO; 5XFAD = 0.5983; 5XFAD versus Hdac1 cKO; 5XFAD = 0.1215; c, d cumulative binomial distributions; e two-tailed Fisher’s exact test; f two-tailed Student’s t test; h weighted Kolmogorov–Smirnov-like test followed by multiple hypothesis testing. Source data are provided as a Source Data file.CC BY · PubMed Central
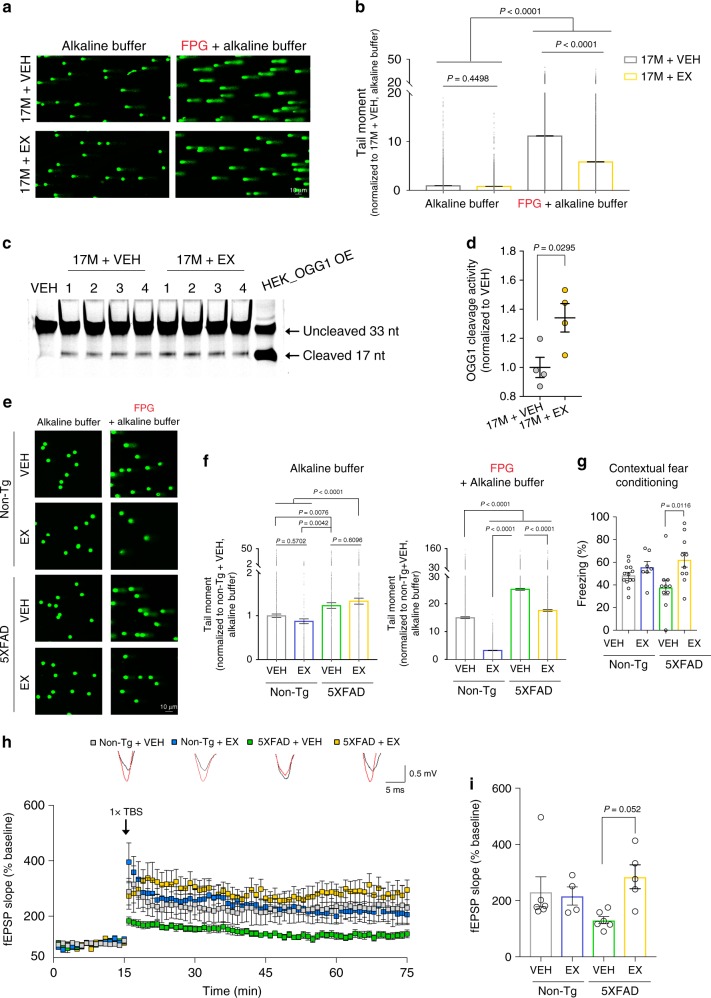
Fig. 5 Pharmacological activation of HDAC1 reduces 8-oxoG lesions in aged wild-type and 5XFAD mice. a, b Representative images and quantification of the comet assay using hippocampal homogenates from 17-month-old (17M) wild-type (WT) mice after vehicle (VEH) or exifone (EX) treatment for 4 weeks. a, b Nuclei analyzed (three mice/group) were: alkaline, 4746 (17M + VEH), and 3702 (17M + EX); FPG + alkaline, 6254 (17M + VEH), and 4268 (17M + EX). c Hippocampal nuclear extracts from 17M WT mice that received daily treatment of either VEH or EX for 4 weeks were used to assess OGG1 cleavage activity. d Quantification of cleaved 17-nt products presented in c. c, d Four animals in each group were analyzed from one experiment. e Representative images and quantification plots of the comet assay using hippocampal homogenates from 8-month-old non-Tg control and 5XFAD mice treated daily with VEH or EX for 2 weeks. e, f Nuclei analyzed (at least three mice/group) were: alkaline, 6046 (non-Tg + VEH), 1385 (non-Tg + EX), 3140 (5XFAD + VEH), 3227 (5XFAD + EX); FPG + alkaline, 4177 (non-Tg + VEH), 2030 (non-Tg + EX), 4179 (5XFAD + VEH), and 3075 (5XFAD + EX). g Analysis of freezing behavior during contextual fear conditioning test. Animals analyzed were: 13 (non-Tg + VEH), 7 (non-Tg + EX), 10 (5XFAD + VEH), and 10 (5XFAD + EX). h, i Hippocampal LTP induction in 14-month-old non-Tg control and 5XFAD mice treated daily with VEH or EX for 2 weeks. Animals/slices analyzed in each group were: 3/6 (non-Tg + VEH), 3/4 (non-Tg + EX), 3/6 (5XFAD + VEH), and 3/5 (5XFAD + EX). Overlay of the representative fEPSPs before (black trace) and after (red trace) LTP induction. All values are shown as mean ± SEM. Statistical analysis: b, f, g, i one-way ANOVA with Tukey’s post hoc test; d two-tailed Student’s t test. Source data are provided as a Source Data file.
Fig. 5 Pharmacological activation of HDAC1 reduces 8-oxoG lesions in aged wild-type and 5XFAD mice. a, b Representative images and quantification of the comet assay using hippocampal homogenates from 17-month-old (17M) wild-type (WT) mice after vehicle (VEH) or exifone (EX) treatment for 4 weeks. a, b Nuclei analyzed (three mice/group) were: alkaline, 4746 (17M + VEH), and 3702 (17M + EX); FPG + alkaline, 6254 (17M + VEH), and 4268 (17M + EX). c Hippocampal nuclear extracts from 17M WT mice that received daily treatment of either VEH or EX for 4 weeks were used to assess OGG1 cleavage activity. d Quantification of cleaved 17-nt products presented in c. c, d Four animals in each group were analyzed from one experiment. e Representative images and quantification plots of the comet assay using hippocampal homogenates from 8-month-old non-Tg control and 5XFAD mice treated daily with VEH or EX for 2 weeks. e, f Nuclei analyzed (at least three mice/group) were: alkaline, 6046 (non-Tg + VEH), 1385 (non-Tg + EX), 3140 (5XFAD + VEH), 3227 (5XFAD + EX); FPG + alkaline, 4177 (non-Tg + VEH), 2030 (non-Tg + EX), 4179 (5XFAD + VEH), and 3075 (5XFAD + EX). g Analysis of freezing behavior during contextual fear conditioning test. Animals analyzed were: 13 (non-Tg + VEH), 7 (non-Tg + EX), 10 (5XFAD + VEH), and 10 (5XFAD + EX). h, i Hippocampal LTP induction in 14-month-old non-Tg control and 5XFAD mice treated daily with VEH or EX for 2 weeks. Animals/slices analyzed in each group were: 3/6 (non-Tg + VEH), 3/4 (non-Tg + EX), 3/6 (5XFAD + VEH), and 3/5 (5XFAD + EX). Overlay of the representative fEPSPs before (black trace) and after (red trace) LTP induction. All values are shown as mean ± SEM. Statistical analysis: b, f, g, i one-way ANOVA with Tukey’s post hoc test; d two-tailed Student’s t test. Source data are provided as a Source Data file.CC BY · PubMed Central
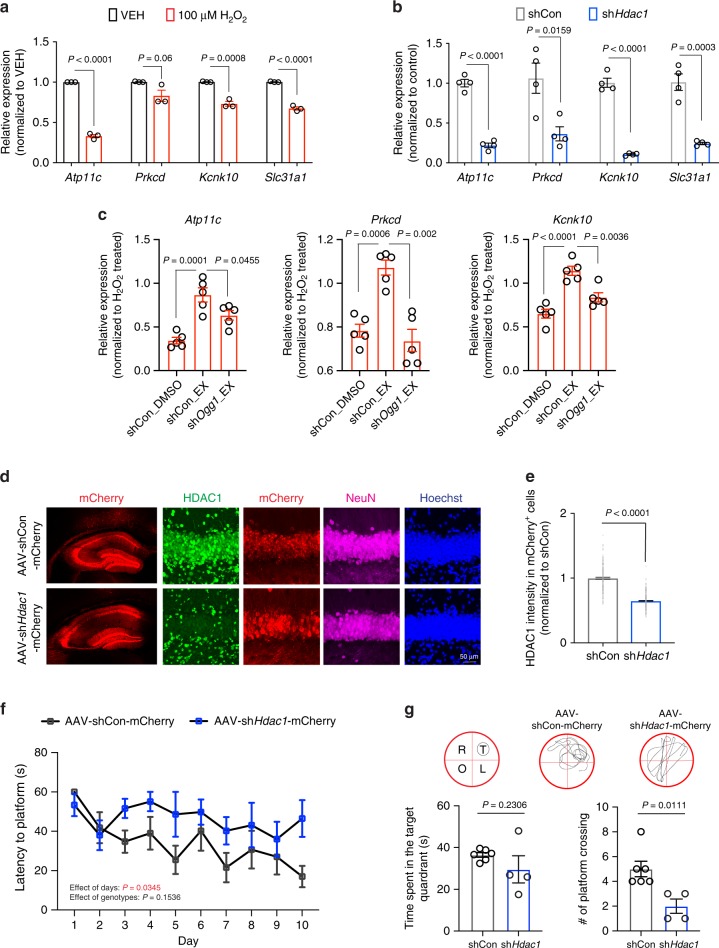
Fig. 6 HDAC1 alleviates oxidative damage-mediated gene repression in neurons and neuronal HDAC1 modulates cognition in aged mice. a The effect of oxidative damage on gene repression in wild-type cultured neurons (14 DIV) treated with 100 μM H2O2 overnight. Six replicates from three independent experiments. b Gene expression changes in cultured neuron (14 DIV) expressing shHdac1 or scrambled (shCon). Four replicates from four independent experiments. c The effects of oxidative damage on gene repression in cultured neurons (14 DIV) expressing shOgg1 or scrambled (shCon) that were preincubated with 1 μM exifone (EX) or vehicle (VEH) for 6 h prior to the addition of H2O2. Five replicates from five independent experiments. d Representative images of the hippocampal region showing HDAC1 levels in aged wild-type mice injected with AAV viruses expressing shRNA against Hdac1 (AAV-shHdac1-mCherry) or scrambled (AAV-shCon-mCherry). mCherry (red), HDAC1 (green), NeuN (magenta), and nuclei Hoechst (blue). e Quantification showing the HDAC1 intensity in mCherry+ cells. d, e Three mice (two sections/mouse) were analyzed. Cells analyzed were: 197 (AAV-shCon-mCherry), 251 (AAV-shHdac1-mCherry). f, g AAV-shHdac1-mCherry and AAV-shCon-mCherry-injected mice were subjected to the MWM task 3 weeks after viral injection. Shown are the latency to hidden platform during the training, and time spent in each quadrant and number of platform’s crossing during the probe trial. Images showing the location of each quadrant and swim trace of mouse during the probe trial. T = target, O = opposite, R = right, L = left. Animals analyzed were: 6 (AAV-shCon-mCherry) and 4 (AAV-shHdac1-mCherry). All values are shown as mean ± SEM. Statistical analysis: a, b, e, g Two-tailed Student’s t test; c one-way ANOVA with Tukey’s post hoc test; f two-way repeated-measures ANOVA with Bonferroni’s post hoc test. Source data are provided as a Source Data file.
Fig. 6 HDAC1 alleviates oxidative damage-mediated gene repression in neurons and neuronal HDAC1 modulates cognition in aged mice. a The effect of oxidative damage on gene repression in wild-type cultured neurons (14 DIV) treated with 100 μM H2O2 overnight. Six replicates from three independent experiments. b Gene expression changes in cultured neuron (14 DIV) expressing shHdac1 or scrambled (shCon). Four replicates from four independent experiments. c The effects of oxidative damage on gene repression in cultured neurons (14 DIV) expressing shOgg1 or scrambled (shCon) that were preincubated with 1 μM exifone (EX) or vehicle (VEH) for 6 h prior to the addition of H2O2. Five replicates from five independent experiments. d Representative images of the hippocampal region showing HDAC1 levels in aged wild-type mice injected with AAV viruses expressing shRNA against Hdac1 (AAV-shHdac1-mCherry) or scrambled (AAV-shCon-mCherry). mCherry (red), HDAC1 (green), NeuN (magenta), and nuclei Hoechst (blue). e Quantification showing the HDAC1 intensity in mCherry+ cells. d, e Three mice (two sections/mouse) were analyzed. Cells analyzed were: 197 (AAV-shCon-mCherry), 251 (AAV-shHdac1-mCherry). f, g AAV-shHdac1-mCherry and AAV-shCon-mCherry-injected mice were subjected to the MWM task 3 weeks after viral injection. Shown are the latency to hidden platform during the training, and time spent in each quadrant and number of platform’s crossing during the probe trial. Images showing the location of each quadrant and swim trace of mouse during the probe trial. T = target, O = opposite, R = right, L = left. Animals analyzed were: 6 (AAV-shCon-mCherry) and 4 (AAV-shHdac1-mCherry). All values are shown as mean ± SEM. Statistical analysis: a, b, e, g Two-tailed Student’s t test; c one-way ANOVA with Tukey’s post hoc test; f two-way repeated-measures ANOVA with Bonferroni’s post hoc test. Source data are provided as a Source Data file.CC BY · PubMed Central

Verification

Claims the paper makes

The claims and statistics of this paper haven’t been checked yet.

Run the check — free, no account needed. It reads the open-access text and checks the sources it cites.

A few free checks a day · papers already verified open instantly · results are public

Claims other papers make about this one

Each is checked against this paper’s own text: does it say what the citing paper says it does?

Self-check

Percentages, sums and reported differences re-computed from the paper’s own numbers.

The self-check needs the paper’s full text.

Citations

Cites

Show all 72 references

Research works printed but not linked: 1

  1. Piette, F. et al. Effets de I'exifone sur les troubles mnesiques, le comportement et al dépendance de malades atteints de démence sénile de type Alzheimer. Rev. Gériatr 11, 375–378 (1986).

Cited by

Sorted by citations

Items 201–219 of 219

Metadata

Authors
Pao, P.-C., Patnaik, D., Watson, L. A., Gao, F., Pan, L., Wang, J., Adaikkan, C., Penney, J., Cam, H. P., Huang, W.-C., Pantano, L., Lee, A., Nott, A., Phan, T. X., Gjoneska, E., Elmsaouri, S., Haggarty, S. J., & Tsai, L.-H.
Affiliations
  • Massachusetts Institute of Technology (US)
  • Harvard University (US)
  • California Institute of Technology (US)
  • University of California San Diego (US)
  • National Institutes of Health (US)
Corresponding author
Tsai, Li-Huei
Venue
Nature Communications
Published
2020-05-18
Volume
11
Issue
1
Pages
2484-2484
ISSN
2041-1723 (ISSN-L)
OpenAlex
W3025772309
Cited by
216
References
72
Citations by year
2026: 25 · 2025: 45 · 2024: 38 · 2023: 37 · 2022: 41 · 2021: 23 · 2020: 7
FWCI
8.92
Type
journal article
Language
en
Open access
Locations
  • Nature Communications (publishedVersion, cc-by)
  • PubMed Central (publishedVersion, cc-by)
  • PubMed (publishedVersion)
  • CaltechAUTHORS (California Institute of Technology) (submittedVersion, cc-by)
  • RePEc: Research Papers in Economics (submittedVersion)
  • DOAJ (DOAJ: Directory of Open Access Journals) (submittedVersion, cc-by-sa)
  • DSpace@MIT (Massachusetts Institute of Technology) (submittedVersion, cc-by-nc)
  • IslandScholar (University of Prince Edward Island) (submittedVersion, cc-by)
Funders
  • U.S. Department of Health & Human Services | NIH | National Institute on Aging (AG046174)
  • U.S. Department of Health & Human Services | NIH | National Institute of Neurological Disorders and Stroke (NS102730)
  • Glenn Foundation for Medical Research
Topics
  • Life Sciences › Biochemistry, Genetics and Molecular Biology › Molecular Biology › DNA Repair Mechanisms
  • Life Sciences › Biochemistry, Genetics and Molecular Biology › Molecular Biology › Epigenetics and DNA Methylation
  • Life Sciences › Biochemistry, Genetics and Molecular Biology › Molecular Biology › Histone Deacetylase Inhibitors Research
Keywords
HDAC1, OGG1, 8-oxoguanine, oxidative DNA damage repair, brain aging, Alzheimer's disease, DNA glycosylase, transcriptional repression, cognitive impairment, 5xFAD mice, neurodegeneration, DNA damage accumulation
MeSH terms
Acetylation, Aging, Alzheimer Disease, Animals, Astrocytes, Base Sequence, Benzophenones, Brain, Cognition, Cognition Disorders, DNA Damage, Guanine, Memory, Mice, Inbred C57BL, Neurons, Promoter Regions, Genetic, Down-Regulation, Mice, Knockout, Oxidative Stress, DNA Glycosylases, Histone Deacetylase 1, Gene Ontology

About these checks

Registry, retraction, Cites and statistics results are computed, not judged, with one exception: a printed reference that no index lists is read once by a model before it counts as a citation error. Claims are extracted by a model and kept only when their quote appears verbatim in the text; each cited source is then checked, with a model’s help, for whether it says what the claim relies on. Those verdicts can be wrong — read the claim’s quote and the cited source before relying on one.

Statistics and arithmetic are recomputed, not judged.

Confidence bands are shown only for fields calibrated on our annotated test set. None is calibrated yet, so no band is shown.

What counts as a claim ›How we measure confidence ›How we check this ›

Are you an author, or do you see a problem with this page? Request a review