Student or educator? Sign up with your school email and get 6 months of Pro free.
CoChat

The DOI matches its Crossref record; 57 of the 57 references it cites were found in a registry or an index.

Transcriptomics and proteomics reveal a cooperation between interferon and T-helper 17 cells in neuromyelitis optica

Open access

Abstract

Type I interferon (IFN-I) and T helper 17 (TH17) drive pathology in neuromyelitis optica spectrum disorder (NMOSD) and in TH17-induced experimental autoimmune encephalomyelitis (TH17-EAE). This is paradoxical because the prevalent theory is that IFN-I inhibits TH17 function. Here we report that a cascade involving IFN-I, IL-6 and B cells promotes TH17-mediated neuro-autoimmunity. In NMOSD, elevated IFN-I signatures, IL-6 and IL-17 are associated with severe disability. Furthermore, IL-6 and IL-17 levels are lower in patients on anti-CD20 therapy. In mice, IFN-I elevates IL-6 and exacerbates TH17-EAE. Strikingly, IL-6 blockade attenuates disease only in mice treated with IFN-I. By contrast, B-cell-deficiency attenuates TH17-EAE in the presence or absence of IFN-I treatment. Finally, IFN-I stimulates B cells to produce IL-6 to drive pathogenic TH17 differentiation in vitro. Our data thus provide an explanation for the paradox surrounding IFN-I and TH17 in neuro-autoimmunity, and may have utility in predicting therapeutic response in NMOSD.

Overview

The claims and statistics of this paper haven’t been checked yet.

Free: it reads the open-access text and checks the first 5 claims that cite a source we can check. Create a free account to check every claim.

A few free checks a day · papers already verified open instantly · results are public

Integrity signals

Registry

Crossref · 10.1038/s41467-020-16625-7

Cites

57 of 57 references verified0 citation errors · 0 not checkable

Statistics

Figures

Fig. 1 NMOSD patients stratify into two groups based on IFN-I gene expression. RNA profiles of a untreated patients (NMO-untreated; n = 7), b Rituximab-treated patients (NMO-Ritux; n = 24) and c patients on other therapies (NMO-Other Tx; n = 7) were compared with healthy volunteers (n = 18). d Venn diagram of differentially expressed genes of the NMO-Untreated vs healthy, NMO-Ritux vs healthy, and NMO-Other Tx vs healthy. e Heatmap depicts relative levels of IFN-I genes in NMOSD patients (Red = NMO-Untreated, Yellow = NMO-Other Tx, Green = NMO-Ritux). Patients were stratified into two groups, IFN-low and IFN-high, based on IFN-I gene expression. Yellow represents relative high expression and blue represents relative low expression. f Heatmap depicts the differentially abundant serum proteins in IFN-high NMOSD (N = 16), IFN-low NMOSD (n = 22), and healthy controls (n = 18). Yellow represents relative high serum levels; blue represents relative low serum levels. Comparison of g disability (EDSS), h number of relapses 2 years prior to sample collection, i age, and j autoantibody status of IFN-high and IFN-low NMOSD patients. Two-tailed Student’s t tests and Chi-square tests were used to determine statistical significance. k MCP-3 and l IL-6 levels in NMOSD patients of different EDSS range (EDSS 4–6.5: n = 15, EDSS 2.5–3.5: n = 9, EDSS 0–2: n = 16). P values were determined using two-tailed Kruskal–Wallis tests with multiple comparisons corrected by the Dunn’s method. Bar graphs represent the mean and error bars are the S.E.M. Source data are provided as a Source Data file.
Fig. 1 NMOSD patients stratify into two groups based on IFN-I gene expression. RNA profiles of a untreated patients (NMO-untreated; n = 7), b Rituximab-treated patients (NMO-Ritux; n = 24) and c patients on other therapies (NMO-Other Tx; n = 7) were compared with healthy volunteers (n = 18). d Venn diagram of differentially expressed genes of the NMO-Untreated vs healthy, NMO-Ritux vs healthy, and NMO-Other Tx vs healthy. e Heatmap depicts relative levels of IFN-I genes in NMOSD patients (Red = NMO-Untreated, Yellow = NMO-Other Tx, Green = NMO-Ritux). Patients were stratified into two groups, IFN-low and IFN-high, based on IFN-I gene expression. Yellow represents relative high expression and blue represents relative low expression. f Heatmap depicts the differentially abundant serum proteins in IFN-high NMOSD (N = 16), IFN-low NMOSD (n = 22), and healthy controls (n = 18). Yellow represents relative high serum levels; blue represents relative low serum levels. Comparison of g disability (EDSS), h number of relapses 2 years prior to sample collection, i age, and j autoantibody status of IFN-high and IFN-low NMOSD patients. Two-tailed Student’s t tests and Chi-square tests were used to determine statistical significance. k MCP-3 and l IL-6 levels in NMOSD patients of different EDSS range (EDSS 4–6.5: n = 15, EDSS 2.5–3.5: n = 9, EDSS 0–2: n = 16). P values were determined using two-tailed Kruskal–Wallis tests with multiple comparisons corrected by the Dunn’s method. Bar graphs represent the mean and error bars are the S.E.M. Source data are provided as a Source Data file.CC BY · PubMed Central
Fig. 2 Correlation between TH17 and disability in NMOSD patients. Correlations between EDSS and a %TH17, b %TH17.1, c %TH17 + %TH17.1, and d %TH1 cells in NMOSD patients (n = 6). Two-tailed Pearson correlations were used to determine statistical significance. P values < 0.05 were considered significant and P values > 0.05 were not significant.
Fig. 2 Correlation between TH17 and disability in NMOSD patients. Correlations between EDSS and a %TH17, b %TH17.1, c %TH17 + %TH17.1, and d %TH1 cells in NMOSD patients (n = 6). Two-tailed Pearson correlations were used to determine statistical significance. P values < 0.05 were considered significant and P values > 0.05 were not significant.CC BY · PubMed Central
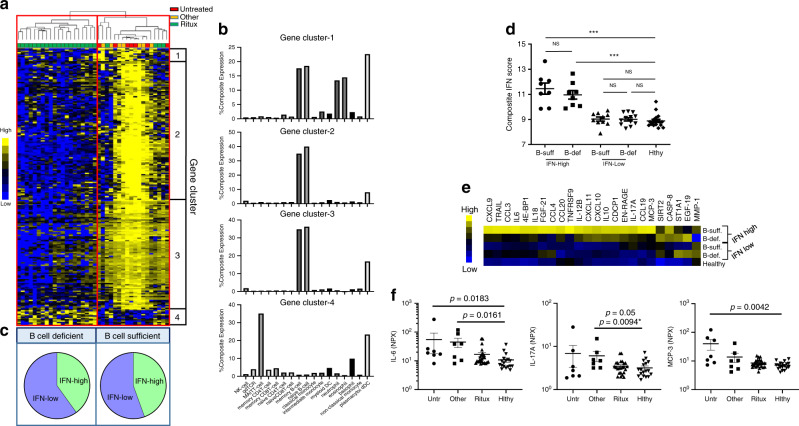
Fig. 3 Effects of B-cell-depleting therapy (BCDT) in IFN-high and IFN-low NMOSD patients. a Heatmap depicts the hierarchical clustering of NMOSD patients (Red = NMO-Untreated, Yellow = NMO-Other Tx, Green = NMO-Ritux) based on differentially expressed genes (DEGs) of patients treated with rituximab (n = 24) compared with patients not treated with rituximab (n = 14). Hierarchical clustering of the DEGs grouped genes into four clusters (Gene clusters 1–4). Yellow represents elevated gene expression and blue represents reduced gene expression. b Percent expression of genes in clusters 1–4 per cell type. c Stratification of NMOSD patients into two groups, defined as B-cell-deficient and B-cell-sufficient, based on gene expression and pie chart depicting the distribution of IFN-high and IFN-low NMOSD patients in the B-cell-deficient and B-cell-sufficient groups. d Composite IFN scores (average read count of IFN-I genes) of B-cell-sufficient IFN-high patients (n = 8), B-cell-deficient IFN-high patients (n = 8), B-cell-sufficient IFN-low patients (n = 10), B-cell-deficient IFN-low patients (n = 12) and healthy individuals (n = 18). e Heatmap indicating relative protein levels in IFN-high and IFN-low NMOSD patients from B-cell-sufficient or B-cell-deficient groups. f Serum protein levels of IL-6, IL-17A, and MCP-3 in untreated (n = 7), Other-treated (n = 7), and rituximab-treated NMOSD (n = 24) patients compared with healthy controls (n = 18). P values were determined using two-tailed Kruskal–Wallis tests with multiple comparisons corrected by the Dunn’s method or by a two-tailed Mann–Whitney test indicated with an *.
Fig. 3 Effects of B-cell-depleting therapy (BCDT) in IFN-high and IFN-low NMOSD patients. a Heatmap depicts the hierarchical clustering of NMOSD patients (Red = NMO-Untreated, Yellow = NMO-Other Tx, Green = NMO-Ritux) based on differentially expressed genes (DEGs) of patients treated with rituximab (n = 24) compared with patients not treated with rituximab (n = 14). Hierarchical clustering of the DEGs grouped genes into four clusters (Gene clusters 1–4). Yellow represents elevated gene expression and blue represents reduced gene expression. b Percent expression of genes in clusters 1–4 per cell type. c Stratification of NMOSD patients into two groups, defined as B-cell-deficient and B-cell-sufficient, based on gene expression and pie chart depicting the distribution of IFN-high and IFN-low NMOSD patients in the B-cell-deficient and B-cell-sufficient groups. d Composite IFN scores (average read count of IFN-I genes) of B-cell-sufficient IFN-high patients (n = 8), B-cell-deficient IFN-high patients (n = 8), B-cell-sufficient IFN-low patients (n = 10), B-cell-deficient IFN-low patients (n = 12) and healthy individuals (n = 18). e Heatmap indicating relative protein levels in IFN-high and IFN-low NMOSD patients from B-cell-sufficient or B-cell-deficient groups. f Serum protein levels of IL-6, IL-17A, and MCP-3 in untreated (n = 7), Other-treated (n = 7), and rituximab-treated NMOSD (n = 24) patients compared with healthy controls (n = 18). P values were determined using two-tailed Kruskal–Wallis tests with multiple comparisons corrected by the Dunn’s method or by a two-tailed Mann–Whitney test indicated with an *.CC BY · PubMed Central
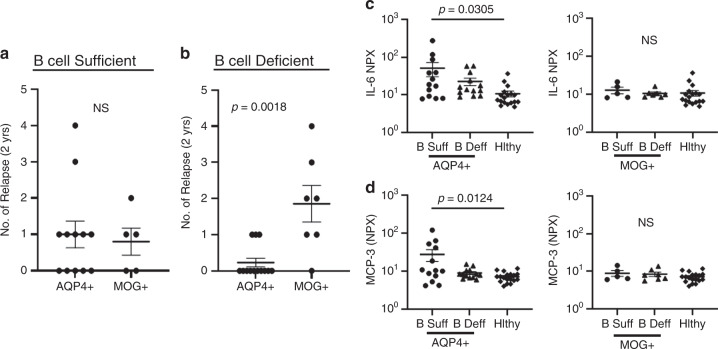
Fig. 4 Effects of B-cell depletion on AQP4-Ig + and MOG-Ig + NMOSD. a Comparison of relapse rates in AQP4-Ig + (n = 12) and MOG-Ig+ NMOSD (n = 5) who are B-cell-sufficient. b Comparison of relapse rates in AQP4-IgG+ (n = 13) and MOG-IgG+ (n = 7) NMOSD who are B-cell-deficient. P values were determined using two-tailed Mann–Whitney tests. Serum c IL-6 and d MCP-3 levels in B cell-sufficient AQP4-IgG+ patients (n = 13), B-cell-deficient AQP4-IgG+ patients (n = 13), B-cell-sufficient MOG-IgG+ patients (n = 5) and B-cell-deficient MOG-IgG+ patients (n = 7) were compared with healthy controls (n = 18). P values were determined using one-way ANOVA tests with multiple comparisons corrected by the Tukey’s method. Error bars indicate the S.E.M. Source data are provided as a Source Data file.
Fig. 4 Effects of B-cell depletion on AQP4-Ig + and MOG-Ig + NMOSD. a Comparison of relapse rates in AQP4-Ig + (n = 12) and MOG-Ig+ NMOSD (n = 5) who are B-cell-sufficient. b Comparison of relapse rates in AQP4-IgG+ (n = 13) and MOG-IgG+ (n = 7) NMOSD who are B-cell-deficient. P values were determined using two-tailed Mann–Whitney tests. Serum c IL-6 and d MCP-3 levels in B cell-sufficient AQP4-IgG+ patients (n = 13), B-cell-deficient AQP4-IgG+ patients (n = 13), B-cell-sufficient MOG-IgG+ patients (n = 5) and B-cell-deficient MOG-IgG+ patients (n = 7) were compared with healthy controls (n = 18). P values were determined using one-way ANOVA tests with multiple comparisons corrected by the Tukey’s method. Error bars indicate the S.E.M. Source data are provided as a Source Data file.CC BY · PubMed Central
Fig. 5 Type I IFN drives IL-6 production in human memory B cells. a Correlation between composite IFN scores and serum CXCL11 levels with IL-6 in B cell-sufficient NMOSD patients (n = 18), B-cell-deficient NMOSD patients (n = 20) and healthy volunteers (n = 18). R and p values were determined using two-tailed Pearson correlation coefficient tests. Direct effect of IFN-β on human naive and memory B cells was assessed by stimulating purified human naïve (CD27−) and memory B cells (CD27+) from healthy donors (n = 4) with CD40L, anti-Ig ± IFN-β. Representative flow cytometric plots and frequency of live b naive CD19+ B cells and c memory B cells expressing CD80, CD86, and IL-6 are shown. Statistical significance was determined using two-tailed Student t tests. P values <0.05 were considered significant.
Fig. 5 Type I IFN drives IL-6 production in human memory B cells. a Correlation between composite IFN scores and serum CXCL11 levels with IL-6 in B cell-sufficient NMOSD patients (n = 18), B-cell-deficient NMOSD patients (n = 20) and healthy volunteers (n = 18). R and p values were determined using two-tailed Pearson correlation coefficient tests. Direct effect of IFN-β on human naive and memory B cells was assessed by stimulating purified human naïve (CD27−) and memory B cells (CD27+) from healthy donors (n = 4) with CD40L, anti-Ig ± IFN-β. Representative flow cytometric plots and frequency of live b naive CD19+ B cells and c memory B cells expressing CD80, CD86, and IL-6 are shown. Statistical significance was determined using two-tailed Student t tests. P values <0.05 were considered significant.CC BY · PubMed Central
Fig. 6 IFN-β elevates IL-6 and exacerbates TH17-driven EAE. MOG-primed TH17 cells were transferred into recipient mice and treated with 1000 U of IFN-β or vehicle every other day from day 0–10 post transfer of cells. a Clinical scores of mice with TH17-EAE treated with vehicle or IFN-β; (TH17-vehicle n = 5, TH17-IFN-β n = 5) and two-tailed Mann–Whitney tests were performed to determine statistical significance (*P < 0.05). Representative of four experiments with similar results. b Spinal cord sections from mice (day 30) were stained with H&E and Luxol fast blue. Representative images of four mice in each group. Scale bar represents 100 µm. c Levels of IL-6 in the sera (measured by ELISA) of TH17-EAE (day 2) were elevated with IFN-β; (TH17-vehicle n = 5, TH17-IFN-β n = 5, healthy n = 3) and a two-tailed Kruskal–Wallis test with multiple comparisons corrected by the Dunn’s method was used to determine statistical significance. d Representative flow cytometry plots and absolute numbers of live CD4+ T cells in the spinal cords of EAE mice, 30 days post transfer. e Representative flow cytometry plots and absolute numbers of CD4+ T cells expressing IL-17, GM-CSF or both in the spinal cords of EAE mice. f Representative flow cytometry plots and absolute numbers of live CD19+ B cells in the spinal cords of EAE mice. (TH17-vehicle n = 5, TH17-IFN-β n = 5) and two-tailed Mann–Whitney tests were performed to determine statistical significance. Error bars indicate the S.E.M. Source data are provided as a Source Data file.
Fig. 6 IFN-β elevates IL-6 and exacerbates TH17-driven EAE. MOG-primed TH17 cells were transferred into recipient mice and treated with 1000 U of IFN-β or vehicle every other day from day 0–10 post transfer of cells. a Clinical scores of mice with TH17-EAE treated with vehicle or IFN-β; (TH17-vehicle n = 5, TH17-IFN-β n = 5) and two-tailed Mann–Whitney tests were performed to determine statistical significance (*P < 0.05). Representative of four experiments with similar results. b Spinal cord sections from mice (day 30) were stained with H&E and Luxol fast blue. Representative images of four mice in each group. Scale bar represents 100 µm. c Levels of IL-6 in the sera (measured by ELISA) of TH17-EAE (day 2) were elevated with IFN-β; (TH17-vehicle n = 5, TH17-IFN-β n = 5, healthy n = 3) and a two-tailed Kruskal–Wallis test with multiple comparisons corrected by the Dunn’s method was used to determine statistical significance. d Representative flow cytometry plots and absolute numbers of live CD4+ T cells in the spinal cords of EAE mice, 30 days post transfer. e Representative flow cytometry plots and absolute numbers of CD4+ T cells expressing IL-17, GM-CSF or both in the spinal cords of EAE mice. f Representative flow cytometry plots and absolute numbers of live CD19+ B cells in the spinal cords of EAE mice. (TH17-vehicle n = 5, TH17-IFN-β n = 5) and two-tailed Mann–Whitney tests were performed to determine statistical significance. Error bars indicate the S.E.M. Source data are provided as a Source Data file.CC BY · PubMed Central
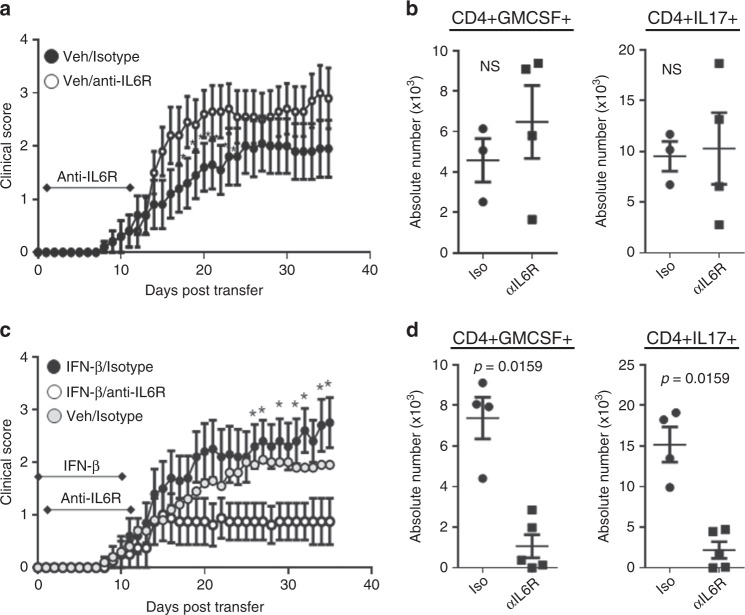
Fig. 7 IL-6 blockade attenuates IFN-β-treated TH17-EAE. TH17-EAE mice, either treated with IFN-β or vehicle, were also treated with either anti-IL-6R or an isotype control every 5 days from days 1–11. a Effect of treatment with anti-IL-6R (n = 10) or isotype (n = 10) control on the clinical scores of vehicle-treated TH17-EAE. Data were pooled from two independent experiments. b Number of CD4+ T cells that express GM-CSF and IL-17 in spinal cords of vehicle-treated mice (day 35). c Effect of anti-IL-6R (n = 8) or isotype (n = 10) treatment on the clinical scores of IFN-β-treated TH17-EAE. Data were pooled from two independent experiments. Vehicle/isotype treated mice were also plotted for reference. d Number of CD4+ T cells that express GM-CSF and IL-17 in the spinal cords of IFN-β-treated EAE mice (day 35). Statistical analysis was performed using Mann–Whitney tests (P < 0.05). Error bars indicate the S.E.M. Results are compiled from two independent experiments.
Fig. 7 IL-6 blockade attenuates IFN-β-treated TH17-EAE. TH17-EAE mice, either treated with IFN-β or vehicle, were also treated with either anti-IL-6R or an isotype control every 5 days from days 1–11. a Effect of treatment with anti-IL-6R (n = 10) or isotype (n = 10) control on the clinical scores of vehicle-treated TH17-EAE. Data were pooled from two independent experiments. b Number of CD4+ T cells that express GM-CSF and IL-17 in spinal cords of vehicle-treated mice (day 35). c Effect of anti-IL-6R (n = 8) or isotype (n = 10) treatment on the clinical scores of IFN-β-treated TH17-EAE. Data were pooled from two independent experiments. Vehicle/isotype treated mice were also plotted for reference. d Number of CD4+ T cells that express GM-CSF and IL-17 in the spinal cords of IFN-β-treated EAE mice (day 35). Statistical analysis was performed using Mann–Whitney tests (P < 0.05). Error bars indicate the S.E.M. Results are compiled from two independent experiments.CC BY · PubMed Central
Fig. 8 B cell-deficiency attenuates IFN-β-treated TH17-EAE. TH17-EAE was induced in either C57BL/6 or µMT mice and treated with IFN-β or vehicle. a Clinical scores of vehicle-treated C57BL/6 (n = 10) and µMT (n = 10) mice with TH17-EAE. Data were pooled from two independent experiments. Mann–Whitney tests were performed to determine statistical significance (P < 0.05). b Number of CD4+ T cells that express GM-CSF and IL-17 in spinal cords of vehicle-treated mice (day 29). c Clinical scores of IFN-β-treated C57BL/6 (n = 10) and µMT (n = 11) mice with TH17-EAE. Data were pooled from two independent experiments. Mann–Whitney tests were performed to determine statistical significance (P < 0.05). d Number of CD4+ T cells that express GM-CSF and IL-17 in spinal cords of IFN-β-treated mice (day 29). Statistical analysis was performed using two-tailed Mann–Whitney tests. Error bars indicate the S.E.M. Results are compiled from two independent experiments. Source data are provided as a Source Data file.
Fig. 8 B cell-deficiency attenuates IFN-β-treated TH17-EAE. TH17-EAE was induced in either C57BL/6 or µMT mice and treated with IFN-β or vehicle. a Clinical scores of vehicle-treated C57BL/6 (n = 10) and µMT (n = 10) mice with TH17-EAE. Data were pooled from two independent experiments. Mann–Whitney tests were performed to determine statistical significance (P < 0.05). b Number of CD4+ T cells that express GM-CSF and IL-17 in spinal cords of vehicle-treated mice (day 29). c Clinical scores of IFN-β-treated C57BL/6 (n = 10) and µMT (n = 11) mice with TH17-EAE. Data were pooled from two independent experiments. Mann–Whitney tests were performed to determine statistical significance (P < 0.05). d Number of CD4+ T cells that express GM-CSF and IL-17 in spinal cords of IFN-β-treated mice (day 29). Statistical analysis was performed using two-tailed Mann–Whitney tests. Error bars indicate the S.E.M. Results are compiled from two independent experiments. Source data are provided as a Source Data file.CC BY · PubMed Central
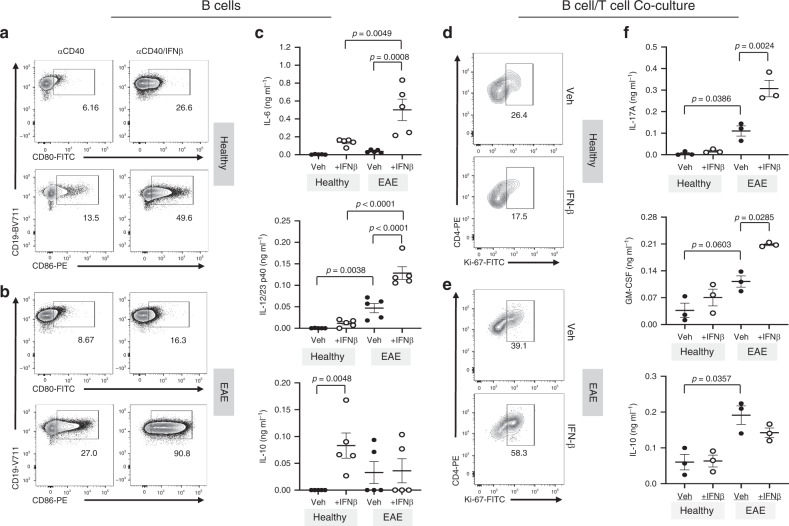
Fig. 9 Effect of IFN-β-stimulated B cells on TH17 cells. Purified B cells from spleens of healthy or EAE mice (n = 5) were stimulated with anti-CD40 ± IFN-β for 3 days. Following stimulation, B cells were washed and co-cultured with CD4+ T cells from 2D2 mice in the presence of MOG35–55 antigen. Following IFN-β stimulation, B-cell phenotype and cytokine production were assessed by a, b FACS and c ELISA, respectively. Stimulated B cells were washed and co-cultured with antigen-specific 2D2 T-helper cells in the presence of MOG35–55 antigen. Representative flow cytometry plots of Ki-67 staining of 2D2 CD4+ T cells cultured with B cells from d healthy (n = 3) or e EAE mice (n = 3). f The cytokines IL-17A, GM-CSF, and IL-10 from the co-culture supernatants were analyzed by ELISA (n = 3 per group). Statistical significance was determined using paired one-way ANOVA tests with multiple comparison corrections using the Holm-Sidak’s method. P values < 0.05 were considered significant. Error bars indicate SEM. Source data are provided as a Source Data file.
Fig. 9 Effect of IFN-β-stimulated B cells on TH17 cells. Purified B cells from spleens of healthy or EAE mice (n = 5) were stimulated with anti-CD40 ± IFN-β for 3 days. Following stimulation, B cells were washed and co-cultured with CD4+ T cells from 2D2 mice in the presence of MOG35–55 antigen. Following IFN-β stimulation, B-cell phenotype and cytokine production were assessed by a, b FACS and c ELISA, respectively. Stimulated B cells were washed and co-cultured with antigen-specific 2D2 T-helper cells in the presence of MOG35–55 antigen. Representative flow cytometry plots of Ki-67 staining of 2D2 CD4+ T cells cultured with B cells from d healthy (n = 3) or e EAE mice (n = 3). f The cytokines IL-17A, GM-CSF, and IL-10 from the co-culture supernatants were analyzed by ELISA (n = 3 per group). Statistical significance was determined using paired one-way ANOVA tests with multiple comparison corrections using the Holm-Sidak’s method. P values < 0.05 were considered significant. Error bars indicate SEM. Source data are provided as a Source Data file.CC BY · PubMed Central
Fig. 10 IFN-I indirectly promotes TH17 pathogenicity. Data from Fig. 9 indicate that IFN-I stimulates the expression of IL-6 and IL-12p40 from activated B cells which, in the context of auto-antigen, supports the proliferation of inflammatory TH17 cells. In contrast, IFN-I stimulation of naive B cells elevates IL-10 and not IL-6 and does not efficiently promote inflammatory TH17 cell proliferation.
Fig. 10 IFN-I indirectly promotes TH17 pathogenicity. Data from Fig. 9 indicate that IFN-I stimulates the expression of IL-6 and IL-12p40 from activated B cells which, in the context of auto-antigen, supports the proliferation of inflammatory TH17 cells. In contrast, IFN-I stimulation of naive B cells elevates IL-10 and not IL-6 and does not efficiently promote inflammatory TH17 cell proliferation.CC BY · PubMed Central

Verification

Claims the paper makes

The claims and statistics of this paper haven’t been checked yet.

Free: it reads the open-access text and checks the first 5 claims that cite a source we can check. Create a free account to check every claim.

A few free checks a day · papers already verified open instantly · results are public

Claims other papers make about this one

Each is checked against this paper’s own text: does it say what the citing paper says it does?

Self-check

Percentages, sums and reported differences re-computed from the paper’s own numbers.

The self-check needs the paper’s full text.

Citations

Cites

Show all 57 references

Cited by

See all 98

Metadata

Authors
Agasing, A. M., Wu, Q., Khatri, B., Borisow, N., Ruprecht, K., Brandt, A. U., Gawde, S., Kumar, G., Quinn, J. L., Ko, R. M., Mao-Draayer, Y., Lessard, C. J., Paul, F., & Axtell, R. C.
Affiliations
  • Oklahoma Medical Research Foundation (US)
  • University of Michigan (US)
  • Max Delbrück Center (DE)
  • Stiftung Charité (DE)
  • University of California, Irvine (US)
Corresponding author
Axtell, Robert C.
Venue
Nature Communications
Published
2020-06-05
Volume
11
Issue
1
Pages
2856-2856
ISSN
2041-1723 (ISSN-L)
OpenAlex
W3033198321
Cited by
98
References
57
Citations by year
2026: 11 · 2025: 20 · 2024: 13 · 2023: 12 · 2022: 20 · 2021: 15 · 2020: 7
FWCI
8.87
Type
journal article
Language
en
Open access
Licence
Locations
  • Nature Communications (publishedVersion, cc-by)
  • PubMed Central (publishedVersion, cc-by)
  • PubMed (publishedVersion)
  • MDC Repository (Max-Delbrueck-Center for Molecular Medicine) (acceptedVersion)
  • RePEc: Research Papers in Economics (submittedVersion)
  • DOAJ (DOAJ: Directory of Open Access Journals) (submittedVersion, cc-by-sa)
Funders
  • National Multiple Sclerosis Society (RG-1602-07722)
  • Multiple Sclerosis Society
  • Deutsche Forschungsgemeinschaft
  • Bundesministerium für Bildung und Forschung
  • National Institutes of Health (RG-1602-07722)
  • National Eye Institute (R01EY027346)
  • National Institute of Allergy and Infectious Diseases (R01AI137047)
Topics
  • Health Sciences › Medicine › Clinical Neurology › Multiple Sclerosis Research Studies
  • Life Sciences › Immunology and Microbiology › Immunology › Psoriasis: Treatment and Pathogenesis
  • Life Sciences › Immunology and Microbiology › Immunology › interferon and immune responses
Keywords
neuromyelitis optica spectrum disorder, type I interferon, Th17 cells, interleukin-6, IL-17, B cells, anti-CD20 therapy, experimental autoimmune encephalomyelitis, Th17 cell differentiation, disability
MeSH terms
Adult, Animals, B-Lymphocytes, Encephalomyelitis, Autoimmune, Experimental, Female, Humans, Interferon Type I, Male, Middle Aged, Neuromyelitis Optica, Autoimmunity, Interleukin-6, Interleukin-17, Gene Expression Profiling, Proteomics, Mice, Th17 Cells

About these checks

Registry, retraction, Cites and statistics results are computed, not judged, with one exception: a printed reference that no index lists is read once by a model before it counts as a citation error. Claims are extracted by a model and kept only when their quote appears verbatim in the text; each cited source is then checked, with a model’s help, for whether it says what the claim relies on. Those verdicts can be wrong — read the claim’s quote and the cited source before relying on one.

Statistics and arithmetic are recomputed, not judged.

Confidence bands are shown only for fields calibrated on our annotated test set. None is calibrated yet, so no band is shown.

What counts as a claim ›How we measure confidence ›How we check this ›

Are you an author, or do you see a problem with this page? Request a review

How to cite

Cite CoChat for the checks on this page, and the paper for its own findings.

This page
CoChat. (2026). Citation check: Transcriptomics and proteomics reveal a cooperation between interferon and T-helper 17 cells in neuromyelitis optica. https://app.cochat.ai/papers/10.1038/s41467-020-16625-7
The paper
Agasing, A. M., Wu, Q., Khatri, B., Borisow, N., Ruprecht, K., Brandt, A. U., Gawde, S., Kumar, G., Quinn, J. L., Ko, R. M., Mao-Draayer, Y., Lessard, C. J., Paul, F., & Axtell, R. C. (2020). Transcriptomics and proteomics reveal a cooperation between interferon and T-helper 17 cells in neuromyelitis optica. Nature Communications. https://doi.org/10.1038/s41467-020-16625-7

Data sources

Bibliographic data: Semantic Scholar, OpenAlex, Crossref.

Contains information from the Semantic Scholar Academic Graph Datasets, made available under the ODC Attribution License (ODC-BY 1.0).

Semantic Scholar’s data is described in: Kinney, R., et al. (2023). The Semantic Scholar Open Data Platform. arXiv:2301.10140.