

The DOI matches its Crossref record; 83 of the 83 references it cites were found in a registry or an index.
Meningeal lymphatic dysfunction exacerbates traumatic brain injury pathogenesis.
Open accessPublished version of a preprint
Abstract
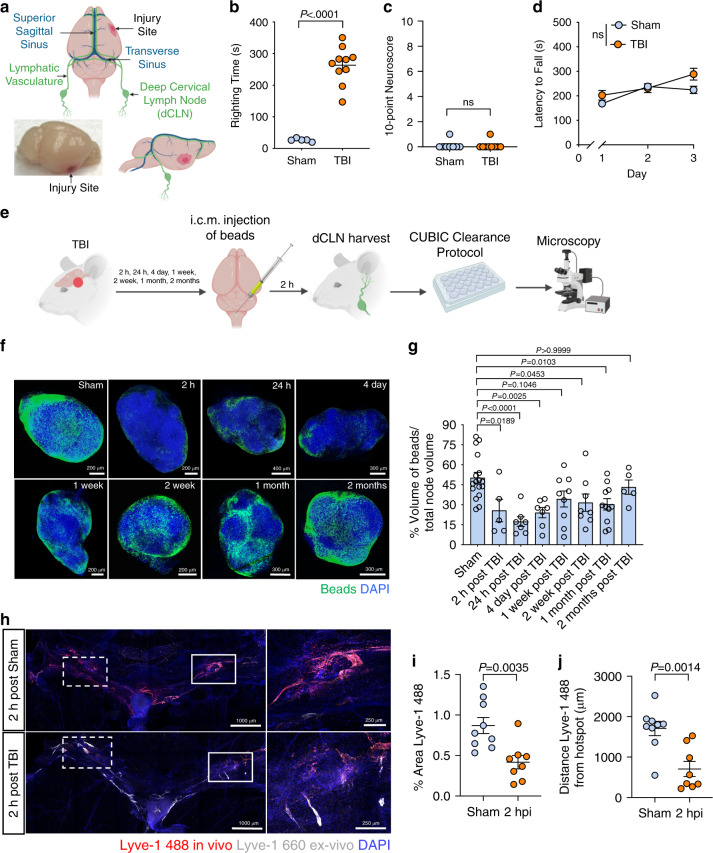
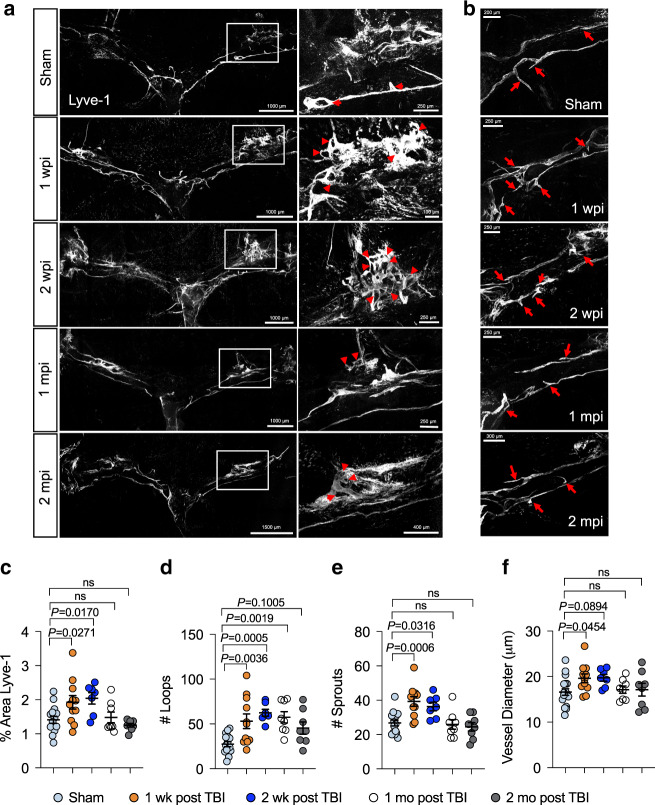
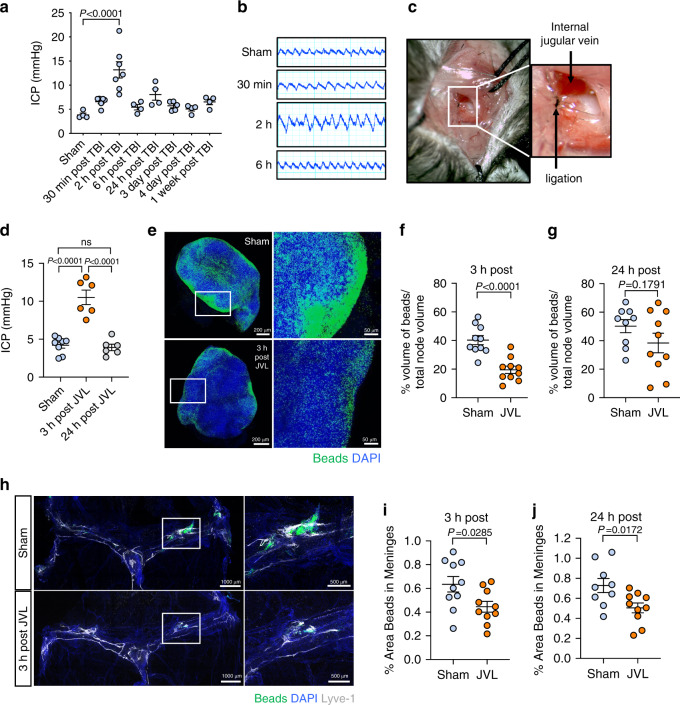
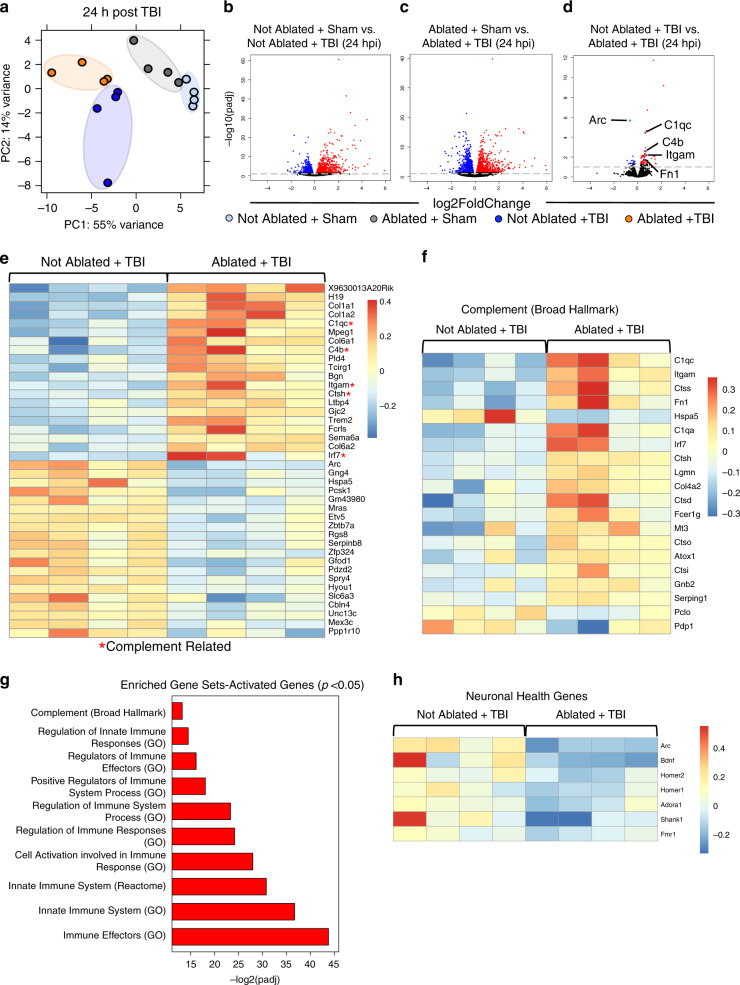
Traumatic brain injury (TBI) is a leading global cause of death and disability. Here we demonstrate in an experimental mouse model of TBI that mild forms of brain trauma cause severe deficits in meningeal lymphatic drainage that begin within hours and last out to at least one month post-injury. To investigate a mechanism underlying impaired lymphatic function in TBI, we examined how increased intracranial pressure (ICP) influences the meningeal lymphatics. We demonstrate that increased ICP can contribute to meningeal lymphatic dysfunction. Moreover, we show that pre-existing lymphatic dysfunction before TBI leads to increased neuroinflammation and negative cognitive outcomes. Finally, we report that rejuvenation of meningeal lymphatic drainage function in aged mice can ameliorate TBI-induced gliosis. These findings provide insights into both the causes and consequences of meningeal lymphatic dysfunction in TBI and suggest that therapeutics targeting the meningeal lymphatic system may offer strategies to treat TBI.
Overview
The claims and statistics of this paper haven’t been checked yet.
Run the check — free, no account needed. It reads the open-access text and checks the sources it cites.
Integrity signals
Registry
Cites
Statistics
Figures
Verification
Claims the paper makes
The claims and statistics of this paper haven’t been checked yet.
Run the check — free, no account needed. It reads the open-access text and checks the sources it cites.
Claims other papers make about this one
Each is checked against this paper’s own text: does it say what the citing paper says it does?
The cited source says what the claim attributes to it.
In the citing paper
“In a mild closed-skull TBI model, meningeal lymphatic drainage is impaired likely due to increases in intracranial pressure, accompanied by lymphatic morphological changes”
From Living on the Edge of the CNS: Meninges Cell Diversity in Health and Disease (2021) · cites this paper as Bolte et al., 2020
In the citing paper
“pre-existing defects in meningeal lymphatics causes worsened neuroinflammation following TBI”
From Living on the Edge of the CNS: Meninges Cell Diversity in Health and Disease (2021) · cites this paper as Bolte et al., 2020
Self-check
Percentages, sums and reported differences re-computed from the paper’s own numbers.
The self-check needs the paper’s full text.
Citations
Cites
Moderated estimation of fold change and dispersion for RNA-seq data with DESeq2
Love, M. I., Huber, W., & Anders, S. (2014) · Genome Biology · doi:10.1186/s13059-014-0550-8 · Cited by 95,106
The Sequence Alignment/Map format and SAMtools
Li, H., Handsaker, B., Wysoker, A., Fennell, T., Ruan, J., Homer, N., Marth, G., Abecasis, G., Durbin, R., & 1000 Genome Project Data Processing Subgroup (2009) · Bioinformatics · doi:10.1093/bioinformatics/btp352 · Cited by 62,041
HTSeq—a Python framework to work with high-throughput sequencing data
Anders, S., Pyl, P. T., & Huber, W. (2015) · Bioinformatics · doi:10.1093/bioinformatics/btu638 · Cited by 21,464
Graph-based genome alignment and genotyping with HISAT2 and HISAT-genotype
Kim, D., Paggi, J. M., Park, C., Bennett, C., & Salzberg, S. L. (2019) · Nature Biotechnology · doi:10.1038/s41587-019-0201-4 · Cited by 15,022
The Molecular Signatures Database Hallmark Gene Set Collection
Liberzon, A., Birger, C., Thorvaldsdóttir, H., Ghandi, M., Mesirov, J. P., & Tamayo, P. (2015) · Cell Systems · doi:10.1016/j.cels.2015.12.004 · Cited by 13,807
Iliff, J. J., Wang, M., Liao, Y., Plogg, B. A., Peng, W., Gundersen, G. A., Benveniste, H., Vates, G. E., Deane, R., Goldman, S. A., et al. (2012) · Science Translational Medicine · doi:10.1126/scitranslmed.3003748 · Cited by 5,824 · cited 2×
“While decreased ISF transport from the parenchyma to the sub-arachnoid space may lead to decreased lymphatic drainage [57, 58], it has also been shown that impaired lymphatic drainage decreases recirculation of macromolecules through the glymphatic route [21].”
BackgroundThe Reactome pathway Knowledgebase
Fabregat, A., Sidiropoulos, K., Garapati, P., Gillespie, M., Hausmann, K., Haw, R., Jassal, B., Jupe, S., Korninger, F., McKay, S., et al. (2016) · Nucleic Acids Research · doi:10.1093/nar/gkv1351 · Cited by 5,605
Structural and functional features of central nervous system lymphatic vessels
Louveau, A., Smirnov, I., Keyes, T. J., Eccles, J. D., Rouhani, S. J., Peske, J. D., Derecki, N. C., Castle, D., Mandell, J. W., Lee, K. S., et al. (2015) · Nature · doi:10.1038/nature14432 · Cited by 4,413
circlize implements and enhances circular visualization in R
Gu, Z., Gu, L., Eils, R., Schlesner, M., & Brors, B. (2014) · Bioinformatics · doi:10.1093/bioinformatics/btu393 · Cited by 4,290
Buniello, A., MacArthur, J. A. L., Cerezo, M., Harris, L. W., Hayhurst, J., Malangone, C., McMahon, A., Morales, J., Mountjoy, E., Sollis, E., et al. (2019) · Nucleic Acids Research · doi:10.1093/nar/gky1120 · Cited by 4,000
Research works printed but not linked: 1
- McKee, A. C. et al. Chronic traumatic encephalopathy in athletes: progressive tauopathy after repetitive head injury. J. Neuropathol. Exp. Neurol. 68, 709–735 (2009). · DOI · Paper page
Cited by
Sorted by citations
Items 201–300 of 358
Sun, Y., Huang, X., Guo, W., Hong, C., Ji, J., Zhang, X.-Y., Yang, J., Hu, G., & Sun, X. (2025) · Journal of Neuroinflammation · doi:10.1186/s12974-025-03409-3 · Cited by 9
Glymphatic system and mild traumatic brain injury: a mini review
Miettinen, P., Utz, B., Bañuelos‐Cabrera, I., Golanov, E. V., Lenzner, Z., Lara-Valderrábano, L., Välimaa, L., & Harel, A. (2025) · Frontiers in Neuroscience · doi:10.3389/fnins.2025.1705690 · Cited by 10
Deep cervical lymph node analysis in central nervous system inflammatory disease
Giff, A., Clark, M. W., Bhattacharyya, S., Sage, P. T., Madore, B., Guenette, J. P., & Miyawaki, E. K. (2026) · Frontiers in Immunology · doi:10.3389/fimmu.2026.1747114 · Cited by 9
Qian, Y., Wang, J., Chen, J., Lin, W., Shen, H., Fang, Y., & Yu, W. (2024) · Experimental Neurology · doi:10.1016/j.expneurol.2024.115036 · Cited by 8
Glymphatics for the Neurosurgeon
Treffy, R., Eraky, A. M., Hussain, O., & Hedayat, H. (2023) · Neurosurgery Open · doi:10.1227/neuprac.0000000000000051 · Cited by 8
Meningeal lymphatic flow slows after mild traumatic brain injury
Lemprière, S. A. (2020) · Nature Reviews Neurology · doi:10.1038/s41582-020-00420-5 · Cited by 8
Wang, C., Chang, Y., Chen, X., Bai, L., Wang, H., Pan, Y., Zhang, C., Guo, D., & Xue, X. (2022) · Molecules · doi:10.3390/molecules27092967 · Cited by 8
Living on the border of the CNS: Dural immune cells in health and disease
Chen, Z., Liu, P., Xia, X., Wang, L., & Li, X. (2022) · Cellular Immunology · doi:10.1016/j.cellimm.2022.104545 · Cited by 9
Measurement of relative motion of the brain and skull in the mini-pig in-vivo
Kailash, K. A., Guertler, C. A., Johnson, C. L., Okamoto, R. J., & Bayly, P. V. (2023) · Journal of Biomechanics · doi:10.1016/j.jbiomech.2023.111676 · Cited by 8
Microphysiological models of the central nervous system with fluid flow
Zilberman, A., & Cornelison, R. C. (2021) · Brain Research Bulletin · doi:10.1016/j.brainresbull.2021.05.015 · Cited by 7
Neurosurgery and the glymphatic system
Eide, P. K. (2024) · Acta Neurochirurgica · doi:10.1007/s00701-024-06161-4 · Cited by 9
Covert cerebrospinal fluid dynamics dysfunction: evolution from conventional to innovative therapies
Xu, Y. X., Yin, H., Li, L., Wang, X., & Hou, Q. (2025) · Frontiers in Neurology · doi:10.3389/fneur.2025.1554813 · Cited by 7
Lohat, V., Ilyas, R., Wei, Q., Oo, D., Xue, J., Horsman, I., Keane, K., Stephens, M., von der Weid, P., & Liao, S. (2025) · American Journal Of Pathology · doi:10.1016/j.ajpath.2025.05.017 · Cited by 7
Hoang, T. A., Cao, E., Gracia, G., Nicolazzo, J. A., & Trevaskis, N. L. (2023) · Frontiers in Pharmacology · doi:10.3389/fphar.2023.1111617 · Cited by 7
Semple, B. D., & Panagiotopoulou, O. (2023) · Neurotrauma Reports · doi:10.1089/neur.2023.0025 · Cited by 7
Localized, time-dependent responses of rat cranial bone to repeated mild traumatic brain injuries
Dill, L. K., Sims, N. A., Shad, A., Anyaegbu, C. C., Warnock, A., Mao, Y., Fitzgerald, M., & Semple, B. D. (2022) · Scientific Reports · doi:10.1038/s41598-022-18643-5 · Cited by 7
Significance of developmental meningeal lymphatic dysfunction in experimental post-traumatic injury
Virenque, A., Koivisto, H., Antila, S., Zub, E., Rooney, E. J., Miszczuk, D., Müller, A., Stoka, E., Marchi, N., Alitalo, K. K., et al. (2022) · Brain Behavior & Immunity - Health · doi:10.1016/j.bbih.2022.100466 · Cited by 8
Advances in Research on Meningeal Lymphatic Vessels in Central Nervous System Diseases
Shen, H., Zhu, B., Qian, Y., Jin, J., Zhou, J., Peng, G., & Mo, J. (2024) · Journal of Craniofacial Surgery · doi:10.1097/scs.0000000000010872 · Cited by 7
Emerging Roles of Meningeal Lymphatic Vessels in Ischemic Stroke
Machado, R. S., Mathias, K., Joaquim, L. D. S., da Costa, M. D. A., Tiscoski, A. D. B., Gonçalves, C. L., Rezin, G. T., & Petronilho, F. C. (2025) · Molecular Neurobiology · doi:10.1007/s12035-025-04983-6 · Cited by 6
Aging as a key determinant of glymphatic system function in older adults
Yin, F., Zeng, B., Nie, L., Ding, S., Luo, D., Zeng, P., Li, B., Shi, Z., Li, Y., & Luo, T. (2025) · The Journals of Gerontology Series A · doi:10.1093/gerona/glaf176 · Cited by 6
Kanuri, S. H., & Sirrkay, P. J. (2025) · Neurology International · doi:10.3390/neurolint17090134 · Cited by 7
Han, M., Han, Y., Jiang, Z., Gao, Y., Cao, G., Zhang, H., Wang, T., & Li, Z. (2025) · Proceedings of the National Academy of Sciences · doi:10.1073/pnas.2503434122 · Cited by 8
Shirasath, K. R., Chaudhari, A. K., Nakhate, K. T., Goyal, S. N., & Awathale, S. N. (2025) · Phytotherapy Research · doi:10.1002/ptr.70105 · Cited by 7
Shin, J., Kim, D.-U., Bae, G., Han, J.-Y., Lim, D.-W., Lee, Y., Kim, E. J., Kwon, E., Han, D., & Kim, S. (2024) · Pharmaceuticals · doi:10.3390/ph17101409 · Cited by 6
Bubeníková, A., Procházka, V., Vacínek, D., Haratek, K., Skalický, P., Laczó, M., Laczó, J., Vlasák, A., Leško, R., Mládek, A., et al. (2025) · Journal of Neurology Neurosurgery & Psychiatry · doi:10.1136/jnnp-2025-336076 · Cited by 6
Lin, J., Sun, H., Jiang, H., Xue, R., Qin, B., Lü, J., Zhu, Z., Cai, C., Han, J., Zhang, J., et al. (2023) · Chemical Engineering Journal · doi:10.1016/j.cej.2023.144686 · Cited by 6
Vanier, C. H., Santhanam, P., Rochester, N., Carter, L. B., Lim, M., Kilani, A., Venkatesh, S., Azad, S., Knoblauch, T., Surti, T., et al. (2024) · Journal of Clinical Medicine · doi:10.3390/jcm13175154 · Cited by 6
Bai, S., Lu, X., Xu, Y., Su, H., Lin, Y., Jiang, Z., Zong, Z., Wang, H., Yan, L. Y. C., Zhang, X., et al. (2025) · Advanced Science · doi:10.1002/advs.202504467 · Cited by 5
Khabibov, M., Гарифуллин, А., Sadreeva, A., Fernandez, M. F., Шамилевич, К. М., Topchu, I., Kharin, L. V., & Boumber, Y. (2025) · Current Neuropharmacology · doi:10.2174/011570159x359861250224051857 · Cited by 5
Zhao, X., & He, Z. (2025) · Neuroscience Research · doi:10.1016/j.neures.2025.104979 · Cited by 5
Lee, E. C., & Oh, J. S. (2025) · Cells · doi:10.3390/cells14211739 · Cited by 5
Molecular mechanisms of age-related vulnerability to traumatic brain injury
Joshi, P., & Vemuganti, R. (2026) · Progress in Neurobiology · doi:10.1016/j.pneurobio.2026.102890 · Cited by 5
Glymphatic system impairment in neurological disorders: potential mechanisms and therapeutic targets
Wang, N., Liu, Z. H., Wang, Y., Cao, F., & Xu, D. (2026) · Molecular Biomedicine · doi:10.1186/s43556-026-00489-2 · Cited by 5
Blokina, I., Iluykov, E., Myagkov, D., Tuktarov, D., Popov, S., Inozemzev, T., Fedosov, I. V., Shirokov, A. A., Terskov, A. V., Dmitrenko, A. V., et al. (2024) · Journal of Visualized Experiments · doi:10.3791/67035 · Cited by 5
Designed Biomaterial‐Enhanced Cell Transplantation for Neural Tissue Engineering
Tang, Y., Friec, A. L., Chen, M., & Sun, D. (2025) · Aggregate · doi:10.1002/agt2.70022 · Cited by 5
Translationally Relevant Magnetic Resonance Imaging Markers in a Ferret Model of Closed Head Injury
Hutchinson, E., Romero-Lozano, A., Johnson, H. R., Knutsen, A. K., Bosomtwi, A., Korotcov, A., Shunmugavel, A., King, S., Schwerin, S., Juliano, S., et al. (2022) · Frontiers in Neuroscience · doi:10.3389/fnins.2021.779533 · Cited by 4
Poblete, R. A., Arenas, M., Sanossian, N., Hong, Y., Freeman, W. D., Lyden, P. D., & Louie, S. G. (2022) · PubMed Central · Cited by 5
Gao, M., Dong, Q., Zou, D., Yang, Z., Guo, L., Chen, Z., & Xu, R. (2024) · Neural Regeneration Research · doi:10.4103/nrr.nrr-d-23-01495 · Cited by 6
Czerpaniak, K., do Nascimento, L. F., Guo, T., Zhang, J., Liu, X., Sarzaeim, M., Fine, Z. D., & Cao, Y. (2024) · Annals of Neurology · doi:10.1002/ana.26998 · Cited by 6
Interaction Between Innate Lymphoid Cells and the Nervous System
Zhang, Y., Grazda, R., & Yang, Q. (2022) · Advances in experimental medicine and biology · doi:10.1007/978-981-16-8387-9_9 · Cited by 5
Dorsal skull meningeal lymphatic vessels drain blood-solutes after intracerebral hemorrhagePreprint
Virenque, A., Balin, R., & Noè, F. M. (2021) · bioRxiv (Cold Spring Harbor Laboratory) · doi:10.1101/2021.03.09.434530 · Cited by 5
An integrative layer-resolved atlas of the adult human meningesPreprint
Degenhard, T., Groh, A. M. R., Afanasiev, E., Luo, M., Yaqubi, M., Stratton, J. A., & Petrecca, K. (2024) · bioRxiv (Cold Spring Harbor Laboratory) · doi:10.1101/2024.11.13.623440 · Cited by 5
GFAP degradation in TBI: linking novel modified products to astrocyte pathology and patient outcome
Wanner, I. B., Halford, J., Lopez, J., Shen, S., Chen, Y., Zhao, H., Salas, C., Loo, R. R. O., Robicsek, S. A., Ellingson, B. M., et al. (2026) · Acta Neuropathologica Communications · doi:10.1186/s40478-026-02240-y · Cited by 5
Kollarik, S., Humer, S. K., Zurfluh, C. E., Gousopoulos, E., & Lindenblatt, N. (2025) · Cellular and Molecular Neurobiology · doi:10.1007/s10571-025-01611-8 · Cited by 4
Cai, Y., Shao, Y., Yuan, H., Feng, L., Wang, J., Yang, M., Li, C., Sun, B., & Mao, L. (2025) · Neurotherapeutics · doi:10.1016/j.neurot.2025.e00819 · Cited by 4
Feng, X., Liu, J., Liang, Z., Du, X., Zhao, L., Xie, N., Chen, C., Ding, L., Xia, X., Zheng, J. C., et al. (2026) · Cell Communication and Signaling · doi:10.1186/s12964-026-02751-0 · Cited by 4
Noninvasive whole-brain imaging of glymphatic dynamics
Wang, N., YU, X., Lowerison, M. R., Li, Q., Canning, A. J., He, P., Dang, L., Degan, S., Mace, B. E., Xu, Y., et al. (2026) · Science Advances · doi:10.1126/sciadv.aee4926 · Cited by 5
Spinal Lymphatic Dysfunction Aggravates the Recovery Process After Spinal Cord Injury
Zhang, R., Zheng, B.-W., Zhang, J., Hao, M.-Y., Diao, Y., Hu, X.-J., Liu, Y.-F., Liu, X., Zhu, T., Zhao, Z., et al. (2024) · Neuroscience · doi:10.1016/j.neuroscience.2024.03.005 · Cited by 4
Force and energy transmission at the brain-skull interface of the minipig in vivo and post-mortem
Wang, S., Eckstein, K. N., Okamoto, R. J., McGarry, M., Johnson, C. L., & Bayly, P. V. (2024) · Journal of the mechanical behavior of biomedical materials/Journal of mechanical behavior of biomedical materials · doi:10.1016/j.jmbbm.2024.106775 · Cited by 4
Liu, Y., Tian, J., Xie, J., Tian, S., Ren, R., Fan, H., Fang, Y., Wang, X., Wang, K., Chen, T., et al. (2025) · Chemical Engineering Journal · doi:10.1016/j.cej.2025.166490 · Cited by 4
Esmaeli, M. (2025) · Cell and Tissue Biology · doi:10.1134/s1990519x24600637 · Cited by 3
Non-invasive therapeutics for neurotrauma: a mechanistic overview
O’Leary, J. D., Main, B. S., & Burns, M. P. (2025) · Frontiers in Neurology · doi:10.3389/fneur.2025.1560777 · Cited by 3
Semyichkina-Glushkovskaia, A., Blokhina, I., Fedosov, I. V., Shirokov, A. A., Tsoy, M. O., Dubrovsky, A. I., Dmitrenko, A. V., Terskov, A. V., Zlatogorskaya, D., Adushkina, V., et al. (2025) · Biomedical Optics Express · doi:10.1364/boe.577347 · Cited by 3
Marco, A. R., Bruch, K. R., Cowan, M. N., Dill, J. G., Moore, K. A., Bolte, A. C., & Lukens, J. R. (2025) · Cell Reports · doi:10.1016/j.celrep.2025.116521 · Cited by 4
Sleep is a therapeutic window for photostimulation of drainage of aging brain
Terskov, A. V., Adushkina, V., Alexander, S., Наволокин, Н. А., Blokhina, I., Zlatogorskaya, D., Anastasiia, S.-G., Sonina, K., Evsukova, A., Elizarova, I. V., et al. (2025) · Frontiers of Optoelectronics · doi:10.1007/s12200-025-00168-0 · Cited by 5
Review of research advances in the cerebral lymphatic system and neurological disorders
Xie, Z., Wei, J., & Wang, J. (2026) · Journal of Advanced Research · doi:10.1016/j.jare.2026.02.032 · Cited by 3
Wang, H., Wang, X., Liu, N., Wang, H., & Feng, C. (2026) · Frontiers in Immunology · doi:10.3389/fimmu.2026.1828809 · Cited by 3
Li, Z., Wang, S., Yang, J., Hu, H., Zheng, Y., Li, C., & Ding, Z. (2026) · Neuroscience · doi:10.1016/j.neuroscience.2026.04.021 · Cited by 3
Ready for Prime Time? Dendritic Cells in High-Grade Gliomas
Conarroe, C. A., & Bullock, T. N. J. (2023) · Cancers · doi:10.3390/cancers15112902 · Cited by 3
Sleep Disturbances Following Traumatic Brain Injury
Mathews, A. A., Halsey, S. L., & Bell, K. R. (2022) · Current Physical Medicine and Rehabilitation Reports · doi:10.1007/s40141-022-00351-w · Cited by 3
Pathobiology of the Glymphatic System in the Traumatic Brain Injury: A Narrative Review
Moscote‐Salazar, L. R., Beltran-Ruiz, J. J., Bello, J. S. R., & Lugo, C. M. R. (2022) · Panamerican Journal of Trauma Critical Care & Emergency Surgery · doi:10.5005/jp-journals-10030-1389 · Cited by 3
Meningeal lymphatics stem cognitive decline in craniosynostosis
Stevenson, T. J., Romero, K. H., & Rustenhoven, J. (2023) · Cell stem cell · doi:10.1016/j.stem.2023.10.004 · Cited by 3
LYMPHATIC DRAINAGE SYSTEM OF THE BRAIN: A NEW PLAYER IN NEUROSCIENCE
Semyachkina-Glushkovskaya, O. V., Postnov, D. E., Khorovodov, A. P., Наволокин, Н. А., & Kurthz, Y. G. G. (2023) · Журнал эволюционной биохимии и физиологии · doi:10.31857/s0044452923010084 · Cited by 3
The Regulation of Cerebral Lymphatic Drainage in the Transverse Sinus Region of the Mouse Brain
Xie, Z., He, Z., Yuan, Z., Wang, M., & Zhou, F. (2024) · Journal of Biophotonics · doi:10.1002/jbio.202400250 · Cited by 2
Chen, P., Zheng, W., Wang, W., Shu, D., Xu, D., Zhang, Q., Wang, B., Zhuo, Y., Yuan, R., & Cheng, S. (2025) · Medicine · doi:10.1097/md.0000000000041699 · Cited by 2
Roberts, L. M., Hammel, J. H., Jin, P., Cunningham, J. J., Schumaecker, S., Davis, S., Azar, F. N., Feng, T.-Y., Wang, M., Rutkowski, M. R., et al. (2025) · Communications Biology · doi:10.1038/s42003-025-08784-4 · Cited by 2
Guyo, G. A., Trofimov, A. O., Volkova, E., Pavlova, O. N., Павлов, А. Н., & Semyachkina-Glushkovskaya, O. V. (2025) · Chaos An Interdisciplinary Journal of Nonlinear Science · doi:10.1063/5.0301587 · Cited by 2
Umehana, M., Fushimi, Y., Okuchi, S., Otani, S., Yamamoto, T., Sakata, A., Nakajima, S., Ikeda, S., Ito, S., Grinstead, J. W., et al. (2025) · Japanese Journal of Radiology · doi:10.1007/s11604-025-01908-0 · Cited by 3
Cooperative dynamics of EEG rhythms in adolescents with traumatic brain injuries
Adushkina, V. V., Trofimov, A. O., Volkova, E. D., Pavlova, O. N., Guyo, G. A., & Pavlov, A. N. (2026) · The European Physical Journal Special Topics · doi:10.1140/epjs/s11734-026-02160-x · Cited by 2
Meningeal lymphatic-associated brain swelling in acute stroke
Patil, R. M., Back, D. B., Hamanaka, G., Desai, R., Hayakawa, A., Chan, S. J., Ahn, B. J., Pignataro, G., Hayakawa, K., & Esposito, E. (2026) · PLoS ONE · doi:10.1371/journal.pone.0342643 · Cited by 2
Zhang, J., Zhang, J., Ding, J., Zhang, X., Wang, Y., Wei, W., Chai, Y., Zhang, S., & Chen, X. (2026) · Alzheimer s & Dementia · doi:10.1002/alz.71451 · Cited by 3
Immunity in the brain and surrounding tissues
Kanamori, M., & Ito, M. (2023) · The Journal of Biochemistry · doi:10.1093/jb/mvad010 · Cited by 2
Corneal injury is associated with stromal and vascular alterations within cranial dura mater
Glinskii, O. V., Glinsky, V. V., Xie, L., Bunyak, F., Glinskii, V. V., Sinha, S., Gupta, S., Iozzo, R. V., & Mohan, R. R. (2023) · PLoS ONE · doi:10.1371/journal.pone.0284082 · Cited by 2
Beatty, A. E., Barnes‐Tompkins, T. M., Long, K. M., & Tobiansky, D. J. (2024) · The Anatomical Record · doi:10.1002/ar.25583 · Cited by 2
Bundle structures inside the deep cervical lymphatic vessels of mice
Shin, J., & Kim, S. (2024) · Scientific Reports · doi:10.1038/s41598-024-80155-1 · Cited by 2
Kim, D., & Tithof, J. (2024) · Fluids and Barriers of the CNS · doi:10.1186/s12987-024-00605-w · Cited by 2
Wang, Y., Fang, J., Yuan, Q., Yu, J. L., & Hu, J. (2025) · Journal of Inflammation Research · doi:10.2147/jir.s506891 · Cited by 2
On Intersectionalities and Employer Concerns in the Context of Becker’s Model of Discrimination
Jonsson, P. O. (2025) · Theoretical Economics Letters · doi:10.4236/tel.2025.152032 · Cited by 2
The lymphatic vasculature associated with the peripheral nervous system: structures and functions
Li, S., & Zhou, N. (2022) · Diagnostics and Therapeutics · doi:10.55976/dt.120221606-12 · Cited by 3
Meningeal Lymphatic vasculature in health and disease
Busch, N. L., O’Reilly, L., & Louveau, A. (2022) · Current Opinion in Hematology · doi:10.1097/moh.0000000000000711 · Cited by 2
The brain’s glymphatic system: significance for physiology and pathology
Chupashko, O., & Sulyma, M. (2023) · Experimental and Clinical Physiology and Biochemistry · doi:10.25040/ecpb2023.04.005 · Cited by 1
Advancements in Brain Lymphatic System and Its Involvement in Neurological Diseases
Bari, D., Das, U., Shevalkar, G. B., Kapadia, R., Singhai, V., & Pardeshi, C. V. (2024) · Springer eBooks · doi:10.1007/978-3-031-64828-1_2 · Cited by 2
Thoracic lymph collection impacts the level of endogenous macromolecules in rat biological fluids
Abdallah, M., Styles, I. K., Quinn, J. F., Whittaker, M. R., & Trevaskis, N. L. (2025) · International Journal of Pharmaceutics · doi:10.1016/j.ijpharm.2025.125633 · Cited by 1
Shi, C., Zhou, Y., Zhang, Q., Jin, W., & Dong, H. (2025) · Mediators of Inflammation · doi:10.1155/mi/4288671 · Cited by 1
Jessup, M., Iglesias, N. J., Tadisina, K. K., Xu, K. Y., Mella, J. R., Pinchuk, L., Singh, D. P., Tse, D. T., Nayak, V. V., & Coelho, P. G. (2025) · Biomaterials and Biosystems · doi:10.1016/j.bbiosy.2025.100117 · Cited by 1
Skull base foramina provide a route for the exit of brain lymphatic vessels from the human skull
Altınöz, D., Rahimova, Z., Gürses, İ. A., Kurtoğlu, F., & Çavdar, S. (2025) · Surgical and Radiologic Anatomy · doi:10.1007/s00276-025-03796-5 · Cited by 1
Xu, L., Zhou, Y., Yang, H. K., Chen, X., & Ouyang, Q. (2025) · Experimental Neurology · doi:10.1016/j.expneurol.2025.115596 · Cited by 2
Differences in brain drainage and cognitive function between BALB/c and C57Bl/6 mice
Evsukova, A., Zlatogorskaya, D., Adushkina, V. V., Saranceva, E. I., & Дмитриевна, И. Т. (2026) · The European Physical Journal Special Topics · doi:10.1140/epjs/s11734-026-02179-0 · Cited by 1
Chen, W., Wu, Z., Lin, L., Huang, S., Jiang, Q., Huang, H., Xie, Y.-C., Huang, L.-X., Li, G., Fu, Q.-L., et al. (2026) · International Immunopharmacology · doi:10.1016/j.intimp.2026.116415 · Cited by 2
Tsoy, M. O., Merkulova, K. O., Evsukova, A., & Zlatogorskaya, D. (2026) · The European Physical Journal Special Topics · doi:10.1140/epjs/s11734-026-02210-4 · Cited by 1
Mechanisms of glymphatic system dysfunction in central nervous system diseases
Ouyang, Q., Luo, L., Li, J., Chen, Z., & Xu, Y. (2026) · Brain Research · doi:10.1016/j.brainres.2026.150267 · Cited by 2
Huang, B., Tu, W., Zhou, H., Mo, L., Yang, Q., Sheng, Y., Sun, D., Meng, B., Chi, Z., Lv, Y., et al. (2026) · Journal of Neuroinflammation · doi:10.1186/s12974-026-03784-5 · Cited by 1
Dynamic management of traumatic brain injury in rat: injectable hydrogels and future directions
Jiang, H., Luo, X., Li, H., Guo, Z., Cao, Y. J., Yang, L., Wu, H., & Li, P. (2026) · Frontiers in Neurology · doi:10.3389/fneur.2026.1824220 · Cited by 1
Liu, L., Li, J.-H., Bai, Y.-D., Wang, Y., & Bu, X. (2026) · Molecular Neurodegeneration · doi:10.1186/s13024-026-00962-0 · Cited by 1
Arun, N., Frederick, N. M., Tavares, G. A., Vicchiarelli, A., Swaminathan, D., Powers, J., Davalos, D., Bergmann, C. C., & Louveau, A. (2026) · Journal of Neuroinflammation · doi:10.1186/s12974-026-04046-0 · Cited by 1
Stevenson, T. J., Vinnell, L., McCullough, S. J., Flyger, D. X., Highet, B., Wiseman, J. A., Watkin, B., Romero, K. H., Low, V. F., Smith, A. M., et al. (2026) · The Journal of Experimental Medicine · doi:10.1084/jem.20251245 · Cited by 1
Pérez, M. F., Saravia, F., Castro, M. G., & Bregonzio, C. (2021) · Frontiers in Pharmacology · doi:10.3389/fphar.2021.771610 · Cited by 1
Altered meningeal immunity contributing to the autism-like behavior of BTBR T + Itpr3 tf /J micePreprint
Uddin, M. N., MANLEY, K. M., & Lawrence, D. A. (2022) · bioRxiv (Cold Spring Harbor Laboratory) · doi:10.1101/2022.01.29.478292 · Cited by 1
Cramer, S. W., Haley, S. P., Popa, L. S., Carter, R. E., Scott, E. P., Flaherty, E. B., Dominguez, J., Aronson, J. D., Sabal, L., Surinach, D. A., et al. (2022) · bioRxiv (Cold Spring Harbor Laboratory) · doi:10.1101/2022.02.22.481459 · Cited by 1
Cortical-wide impairment of “The Glymphatic system” after focal brain injuryPreprint
Azuma, M., Lee, H., Shinzaki, K., Yamane, R., & Morita, M. (2022) · bioRxiv (Cold Spring Harbor Laboratory) · doi:10.1101/2022.10.05.510560 · Cited by 1
Metadata
- Authors
- Bolte, A. C., Dutta, A. B., Hurt, M. E., Smirnov, I., Kovacs, M. A., McKee, C. A., Ennerfelt, H. E., Shapiro, D., Nguyen, B. H., Frost, E. L., Lammert, C. R., Kipnis, J., & Lukens, J. R.
- Affiliations
- University of Virginia (US)
- Corresponding author
- Lukens, John R.
- ORCID
- Venue
- Nature Communications
- Published
- 2020-09-10
- Volume
- 11
- Issue
- 1
- Pages
- 4524-4524
- ISSN
- 2041-1723 (ISSN-L)
- PMC
- PMC7483525
- OpenAlex
- W3084255308
- Cited by
- 357
- References
- 83
- Citations by year
- 2026: 52 · 2025: 60 · 2024: 83 · 2023: 67 · 2022: 59 · 2021: 32 · 2020: 4
- FWCI
- 17.54
- Type
- journal article
- Language
- en
- Open access
- gold
- doi.org
- Locations
- Nature Communications (publishedVersion, cc-by)
- PubMed Central (publishedVersion, cc-by)
- PubMed (publishedVersion)
- DOAJ (DOAJ: Directory of Open Access Journals) (submittedVersion, cc-by-sa)
- Funders
- National Multiple Sclerosis Society (FG-1707-28590)
- Topics
- Health Sciences › Medicine › Clinical Neurology › Traumatic Brain Injury and Neurovascular Disturbances
- Health Sciences › Medicine › Clinical Neurology › Cerebrospinal fluid and hydrocephalus
- Health Sciences › Medicine › Clinical Neurology › Traumatic Brain Injury Research
- Keywords
- traumatic brain injury, meningeal lymphatic drainage, lymphatic dysfunction, intracranial pressure, neuroinflammation, cognitive impairment, gliosis, aging, meningeal lymphatic system
- MeSH terms
- Glymphatic System, Dependovirus, Animals, Brain Injuries, Disease Models, Animal, Female, Genetic Vectors, Gliosis, Humans, Male, Meninges, Vascular Endothelial Growth Factor C, Mice
About these checks
Registry, retraction, Cites and statistics results are computed, not judged, with one exception: a printed reference that no index lists is read once by a model before it counts as a citation error. Claims are extracted by a model and kept only when their quote appears verbatim in the text; each cited source is then checked, with a model’s help, for whether it says what the claim relies on. Those verdicts can be wrong — read the claim’s quote and the cited source before relying on one.
Statistics and arithmetic are recomputed, not judged.
Confidence bands are shown only for fields calibrated on our annotated test set. None is calibrated yet, so no band is shown.
What counts as a claim ›How we measure confidence ›How we check this ›
Are you an author, or do you see a problem with this page? Request a review
