

The DOI matches its Crossref record; 52 of the 52 references it cites were found in a registry or an index.
Temporal and spatial heterogeneity of host response to SARS-CoV-2 pulmonary infection
Open accessPublished version of a preprint
Abstract
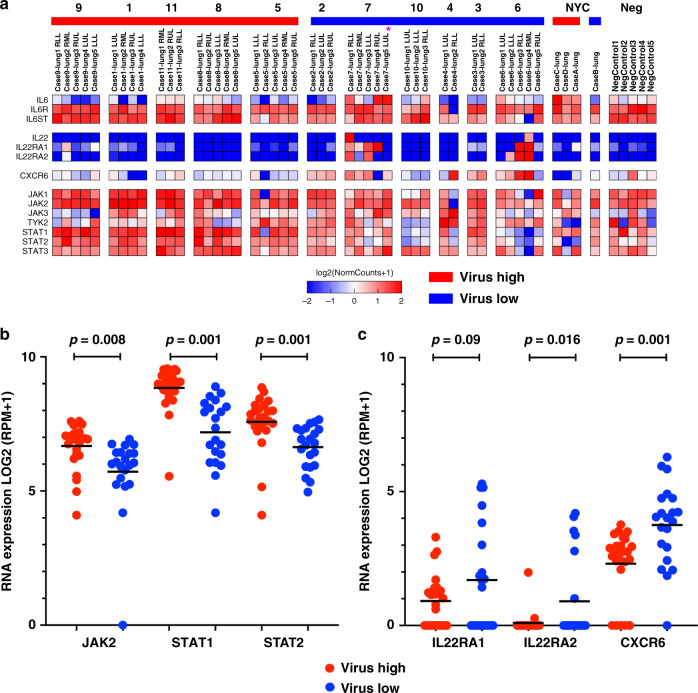
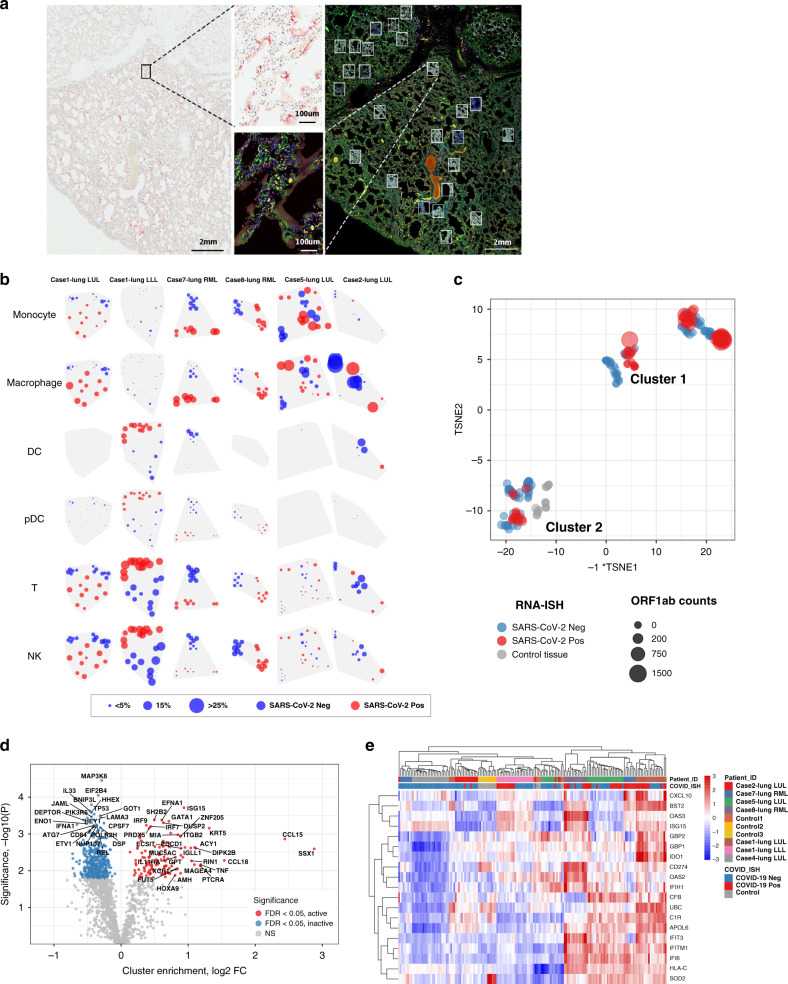
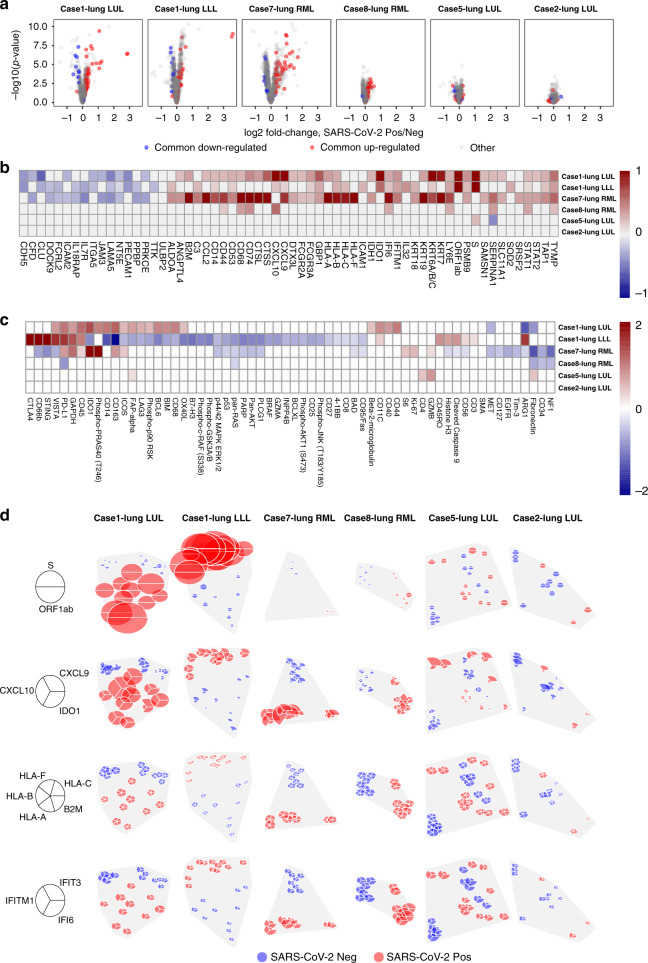
The relationship of SARS-CoV-2 pulmonary infection and severity of disease is not fully understood. Here we show analysis of autopsy specimens from 24 patients who succumbed to SARS-CoV-2 infection using a combination of different RNA and protein analytical platforms to characterize inter-patient and intra-patient heterogeneity of pulmonary virus infection. There is a spectrum of high and low virus cases associated with duration of disease. High viral cases have high activation of interferon pathway genes and a predominant M1-like macrophage infiltrate. Low viral cases are more heterogeneous likely reflecting inherent patient differences in the evolution of host response, but there is consistent indication of pulmonary epithelial cell recovery based on napsin A immunohistochemistry and RNA expression of surfactant and mucin genes. Using a digital spatial profiling platform, we find the virus corresponds to distinct spatial expression of interferon response genes demonstrating the intra-pulmonary heterogeneity of SARS-CoV-2 infection.
Overview
The claims and statistics of this paper haven’t been checked yet.
Run the check — free, no account needed. It reads the open-access text and checks the sources it cites.
Integrity signals
Registry
Cites
Statistics
Figures
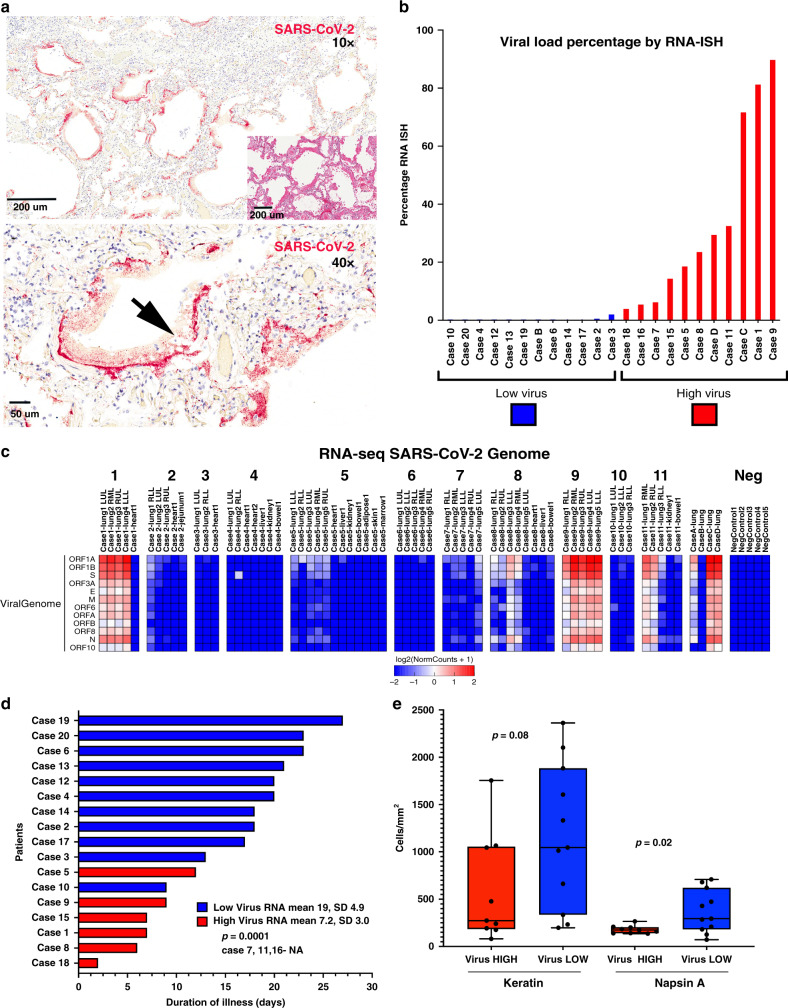
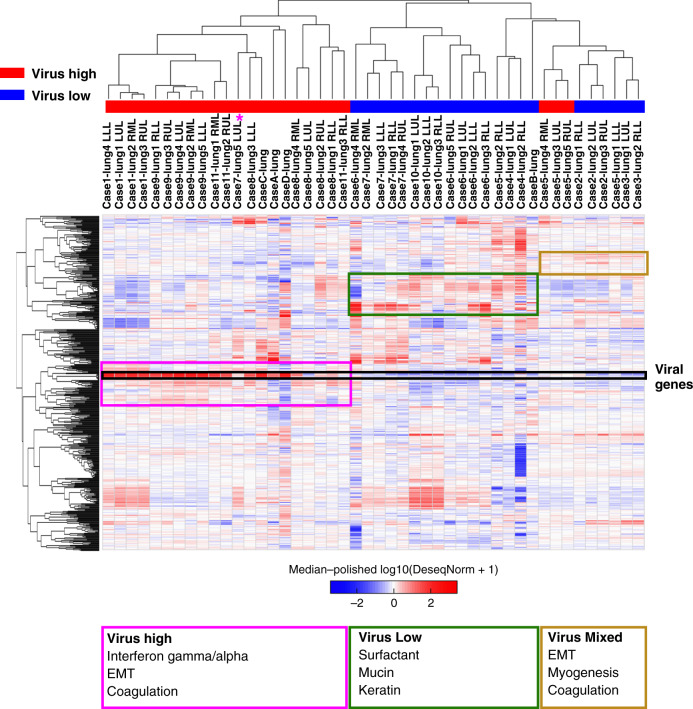
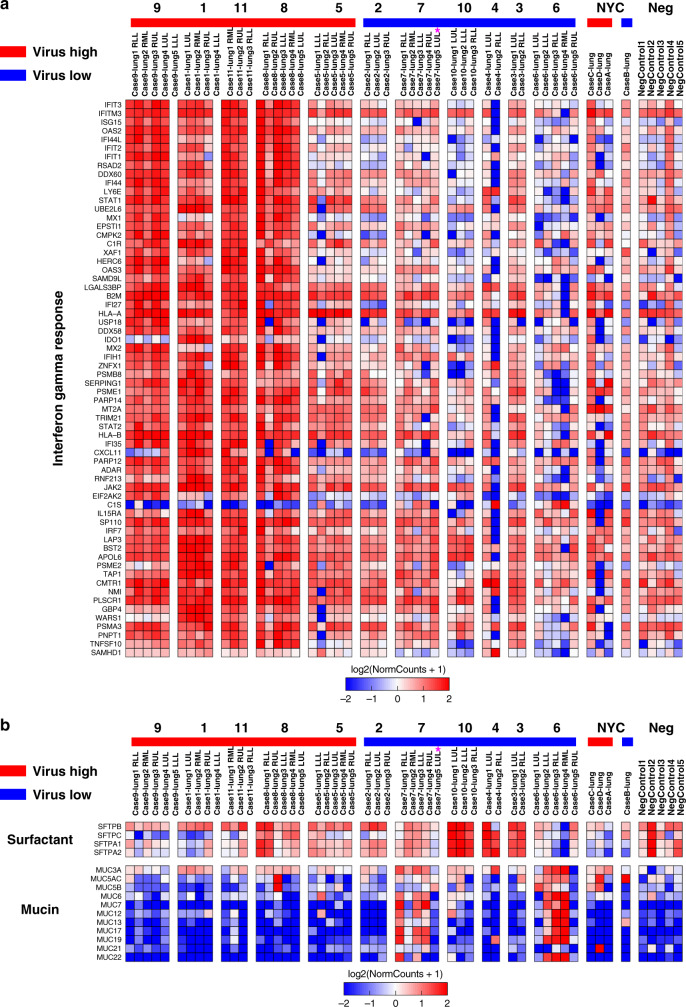
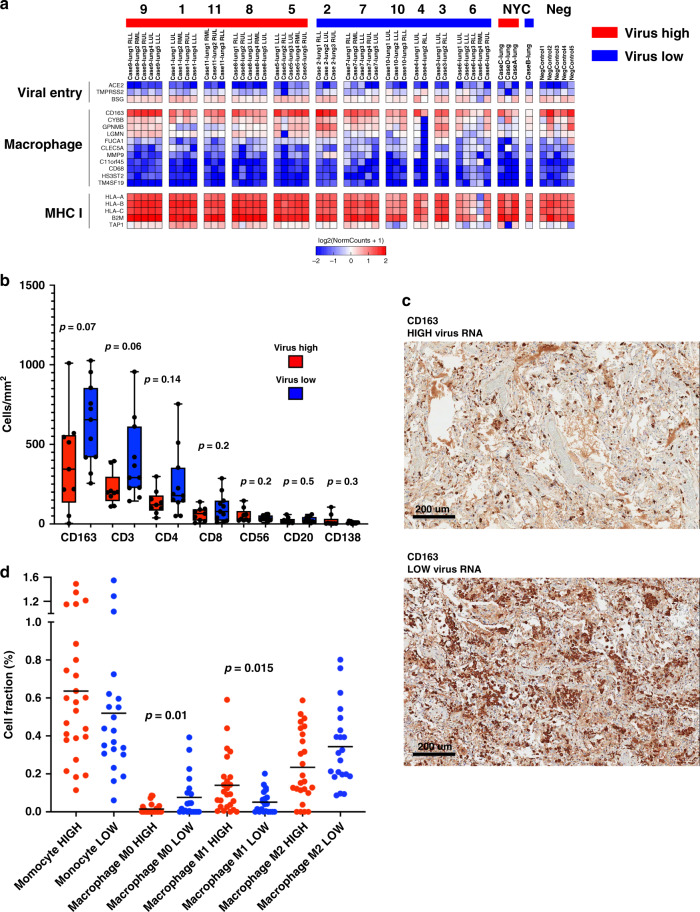
Verification
Claims the paper makes
The claims and statistics of this paper haven’t been checked yet.
Run the check — free, no account needed. It reads the open-access text and checks the sources it cites.
Claims other papers make about this one
Each is checked against this paper’s own text: does it say what the citing paper says it does?
In the citing paper
“SARS-CoV-2 mRNA was detectable by in situ hybridization in many but not all VIS-positive samples, suggesting that VIS may persist beyond the initial infection28,61,62”
From COVID-19 and cellular senescence (2023) · cites this paper as [61]
In the citing paper
“lungs from patients with severe COVID-19 exhibited much higher levels of infiltration by CD86+ macrophages and much stronger SASP-reminiscent cytokine expression compared to lungs from patients who died without notable signs of a respiratory infection and who were not infected with SARS-CoV-2 (refs.28,61).”
From COVID-19 and cellular senescence (2023) · cites this paper as [61]
In the citing paper
“During COVID-19, ARDS manifests as a diffuse alveolar damage pattern seen on autopsies of COVID-19 patients, and is linked to a combination of lung immune cell infiltration, cytokine storm, and tissue damage from secreted proteases, reactive oxygen species (ROS), and viral killing 49,50.”
From SARS-CoV-2, COVID-19 and the aging immune system (2021) · cites this paper as [50]
Self-check
Percentages, sums and reported differences re-computed from the paper’s own numbers.
The self-check needs the paper’s full text.
Citations
Cites
Moderated estimation of fold change and dispersion for RNA-seq data with DESeq2
Love, M. I., Huber, W., & Anders, S. (2014) · Genome Biology · doi:10.1186/s13059-014-0550-8 · Cited by 95,106
STAR: ultrafast universal RNA-seq aligner
Dobin, A., Davis, C. A., Schlesinger, F., Drenkow, J., Zaleski, C., Jha, S., Batut, P., Chaisson, M., & Gingeras, T. R. (2013) · Bioinformatics · doi:10.1093/bioinformatics/bts635 · Cited by 51,709
Clinical features of patients infected with 2019 novel coronavirus in Wuhan, China
Huang, C., Wang, Y., Li, X., Ren, L., Zhao, J., Hu, Y., Zhang, L., Fan, G., Xu, J., Gu, X., et al. (2020) · The Lancet · doi:10.1016/s0140-6736(20)30183-5 · Cited by 48,884
A novel coronavirus from patients with pneumonia in China, 2019
Zhu, N., Zhang, D., Wang, W., Li, X., Yang, B., Song, J., Zhao, X., Huang, B., Shi, W., Lu, R., et al. (2020) · New England Journal of Medicine · doi:10.1056/nejmoa2001017 · Cited by 28,244
Hoffmann, M., Kleine-Weber, H., Schroeder, S., Krüger, N., Herrler, T., Erichsen, S., Schiergens, T. S., Herrler, G., Wu, N.-H., Nitsche, A., et al. (2020) · Cell · doi:10.1016/j.cell.2020.02.052 · Cited by 20,286
Dexamethasone in Hospitalized Patients with Covid-19
The RECOVERY Collaborative Group (2021) · New England Journal of Medicine · doi:10.1056/nejmoa2021436 · Cited by 11,477
COVID-19: consider cytokine storm syndromes and immunosuppression
Mehta, P., McAuley, D. F., Brown, M., Sanchez, E., Tattersall, R. S., & Manson, J. J. (2020) · The Lancet · doi:10.1016/s0140-6736(20)30628-0 · Cited by 9,664
Clinical and immunological features of severe and moderate coronavirus disease 2019
Chen, G., Wu, D., Guo, W., Cao, Y., Huang, D., Wang, H., Wang, T., Zhang, X., Chen, H., Yu, H., et al. (2020) · Journal of Clinical Investigation · doi:10.1172/jci137244 · Cited by 4,750
Determining cell type abundance and expression from bulk tissues with digital cytometry
Newman, A. M., Steen, C. B., Liu, C. L., Gentles, A. J., Chaudhuri, A. A., Scherer, F., Khodadoust, M. S., Esfahani, M. S., Luca, B. A., Steiner, D. F., et al. (2019) · Nature Biotechnology · doi:10.1038/s41587-019-0114-2 · Cited by 4,586
Imbalanced Host Response to SARS-CoV-2 Drives Development of COVID-19
Blanco-Melo, D., Nilsson-Payant, B. E., Liu, W.-C., Uhl, S., Hoagland, D., Møller, R., Jordan, T. X., Oishi, K., Panis, M., Sachs, D., et al. (2020) · Cell · doi:10.1016/j.cell.2020.04.026 · Cited by 4,222
Cited by
Sorted by citations
Items 101–200 of 263
Viable SARS-CoV-2 Omicron sub-variants isolated from autopsy tissues
Maffia‐Bizzozero, S., Cevallos, C. G., Lenicov, F. R., Freiberger, R. N., López, C. A. M., Guano, A. D., Sviercz, F. A., Jarmoluk, P., Bustos, C. A., D’Addario, A. C., et al. (2023) · Frontiers in Microbiology · doi:10.3389/fmicb.2023.1192832 · Cited by 20
Hammoudeh, S. M., Hammoudeh, A. M., Bhamidimarri, P. M., Mahboub, B. H., Halwani, R., Hamid, Q. A., Rahmani, M., & Hamoudi, R. (2021) · World Journal of Gastroenterology · doi:10.3748/wjg.v27.i21.2850 · Cited by 21
Kazachenka, A., & Kassiotis, G. (2021) · Frontiers in Microbiology · doi:10.3389/fmicb.2021.676693 · Cited by 21
Is Nuclear Factor Erythroid 2-Related Factor 2 a Target for the Intervention of Cytokine Storms?
Liu, Z., Deng, P., Liu, S., Bian, Y., Xu, Y., Zhang, Q., Wang, H., & Pi, J. (2023) · Antioxidants · doi:10.3390/antiox12010172 · Cited by 21
Roberts, K., Aivazidis, A., Kleshchevnikov, V., Li, T., Fropf, R., Rhodes, M., Beechem, J., Hemberg, M., & Bayraktar, O. A. (2021) · bioRxiv (Cold Spring Harbor Laboratory) · doi:10.1101/2021.03.20.436265 · Cited by 19
Luebbert, L., Sullivan, D. K., Carilli, M., Hjörleifsson, K. E., Winnett, A. V., Chari, T., & Pachter, L. S. (2025) · Nature Biotechnology · doi:10.1038/s41587-025-02614-y · Cited by 18
Upregulation of interleukin-19 in saliva of patients with COVID-19
Sharif‐Askari, F. S., Sharif‐Askari, N. S., Hafezi, S., Goel, S., Alsayed, H. A. H., Ansari, A. W., Mahboub, B. H., Al‐Muhsen, S., Temsah, M.-H. A., Hamid, Q. A., et al. (2022) · Scientific Reports · doi:10.1038/s41598-022-20087-w · Cited by 18
The nervous system during COVID ‐19: Caught in the crossfire
Natale, N. R., Lukens, J. R., & Petri, W. A. (2022) · Immunological Reviews · doi:10.1111/imr.13114 · Cited by 19
Park, J., Foox, J., HETHER, T. D., Danko, D., Warren, S. E., Kim, Y., Reeves, J., Butler, D., Mozsary, C., Rosiene, J. A., et al. (2021) · bioRxiv (Cold Spring Harbor Laboratory) · doi:10.1101/2021.03.08.434433 · Cited by 17
Self-citationAishwarya, S., Gunasekaran, K., & Margret, A. A. (2020) · Journal of Biomolecular Structure and Dynamics · doi:10.1080/07391102.2020.1850360 · Cited by 16
Gagiannis, D., Umathum, V. G., Bloch, W., Rother, C., Stahl, M., Witte, H. M., Djudjaj, S., Boor, P., & Steinestel, K. (2021) · American Journal of Clinical Pathology · doi:10.1093/ajcp/aqab087 · Cited by 16
LRR-protein RNH1 dampens the inflammasome activation and is associated with COVID-19 severity
Bombaci, G., Sarangdhar, M. A., Andina, N. D., Tardivel, A., Yu, E. C.-W., Mackie, G. M., Pugh, M., Ozan, V. B., Banz, Y., Spinetti, T., et al. (2022) · Life Science Alliance · doi:10.26508/lsa.202101226 · Cited by 15
Discrete Immune Response Signature to SARS-CoV-2 mRNA Vaccination Versus InfectionPreprint
Ivanova, E. N., Devlin, J. C., Buus, T. B., Koide, A., Cornelius, A. R., Samanovic, M. I., Herrera, A. M., Zhang, C., Desvignes, L., Ødum, N., et al. (2021) · SSRN Electronic Journal · doi:10.2139/ssrn.3838993 · Cited by 14
Dinnon, K. H., Leist, S. R., Okuda, K., Dang, H., Fritch, E. J., Gully, K. L., la Cruz, G. D., Evangelista, M. D., Asakura, T., Gilmore, R. C., et al. (2022) · bioRxiv (Cold Spring Harbor Laboratory) · doi:10.1101/2022.02.15.480515 · Cited by 16
Inside-out assembly of viral antigens for the enhanced vaccination
Cao, F., Peng, S., An, Y., Xu, K., Zheng, T., Dai, L., Ogino, K., Ngai, T., Xia, Y., & Ma, G. (2023) · Signal Transduction and Targeted Therapy · doi:10.1038/s41392-023-01414-7 · Cited by 16
Self-citationCollins, D. P., & Steer, C. J. (2021) · Hepatic Medicine Evidence and Research · doi:10.2147/hmer.s301979 · Cited by 14
Role of ACE2-Ang (1–7)-Mas axis in post-COVID-19 complications and its dietary modulation
Sahu, S., Patil, C. R., Kumar, S., Apparsundaram, S., & Goyal, R. K. (2021) · Molecular and Cellular Biochemistry · doi:10.1007/s11010-021-04275-2 · Cited by 17
Sperry, M. M., Oskotsky, T., Marić, I., Kaushal, S., Takeda, T., Horváth, V., Powers, R. K., Rodas, M. J., Furlong, B. A., Soong, M., et al. (2023) · PLoS Computational Biology · doi:10.1371/journal.pcbi.1011050 · Cited by 15
A comprehensive review of the analysis and integration of omics data for SARS-CoV-2 and COVID-19
Zhu, Z., Zhang, S., Wang, P., Chen, X., Bi, J., Cheng, L., & Zhang, X. (2021) · Briefings in Bioinformatics · doi:10.1093/bib/bbab446 · Cited by 14
Liver disorders in COVID-19, nutritional approaches and the use of phytochemicals
Vargas-Mendoza, N., García‐Machorro, J., Ángeles-Valencia, M., Martínez‐Archundia, M., Madrigal‐Santillán, E., Morales‐González, Á., Anguiano‐Robledo, L., & Morales‐González, J. A. (2021) · World Journal of Gastroenterology · doi:10.3748/wjg.v27.i34.5630 · Cited by 14
Transcriptomics and RNA-Based Therapeutics as Potential Approaches to Manage SARS-CoV-2 Infection
Arriaga-Canon, C., Contreras‐Espinosa, L., Rebollar‐Vega, R., Montiel-Manríquez, R., Cedro‐Tanda, A., García-Gordillo, J. A., Álvarez-Gómez, R. M., Jiménez-Trejo, F. J., Hernández, C. C., & Herrera, L. A. (2022) · International Journal of Molecular Sciences · doi:10.3390/ijms231911058 · Cited by 14
Applications of Deep Learning and Machine Learning in Computational Medicine
Adiga, R., Biswas, T., & Shyam, P. (2023) · Journal Of Biochemical Technology · doi:10.51847/iw1dfvoxvw · Cited by 14
Carrau, L., Frere, J. J., Golynker, I., Fajardo, Á., Rivera, C. F., Horiuchi, S., Roonprapunt, T., Minkoff, J. M., Blanco-Melo, D., & tenOever, B. R. (2023) · Science Signaling · doi:10.1126/scisignal.adg5470 · Cited by 12
Benhamouda, N., Besbes, A., Bauer, R., Mabrouk, N., Gadouas, G., Desaint, C., Chevrier, L., Lefebvre, M., Radenne, A., Roelens, M., et al. (2024) · iScience · doi:10.1016/j.isci.2024.110441 · Cited by 13
Strati, A. D., Zavridou, M., Paraskevis, D. N., Magiorkinis, G., Sapounas, S., Λάγιου, Π., Τhomaidis, Ν. S., & Lianidou, E. S. (2022) · Analytical Chemistry · doi:10.1021/acs.analchem.2c00868 · Cited by 13
Li, Y., & Niu, L. (2022) · Scientific Reports · doi:10.1038/s41598-022-20040-x · Cited by 13
Apelin as a new therapeutic target for COVID-19 treatment
Park, J., Park, M. Y., Kim, Y., Jun, Y., Lee, U., & Oh, C. (2022) · QJM · doi:10.1093/qjmed/hcac229 · Cited by 13
Resnick, J. D., Beer, M., & Pekosz, A. S. (2023) · Pathogens · doi:10.3390/pathogens12030480 · Cited by 13
Guan, C., Tan, J., Hall, B. J., Liu, C., Li, Y., & Cai, Z. (2022) · Sustainability · doi:10.3390/su14063417 · Cited by 13
Visualising SARS-CoV-2 infection of the lung in deceased COVID-19 patients
Slambrouck, J. V., Khan, M., Verbeken, E. K., Choi, S., Geudens, V., Vanluyten, C., Feys, S., Vanhulle, E., Wollants, E., Vermeire, K., et al. (2023) · EBioMedicine · doi:10.1016/j.ebiom.2023.104608 · Cited by 13
Werid, G. M., Miller, D. S., Hemmatzadeh, F., Messele, Y. E., & Petrovski, K. R. (2023) · Journal of Veterinary Diagnostic Investigation · doi:10.1177/10406387231210489 · Cited by 12
Chen, T., Ma, W., Wang, X., Ye, Q., Hou, X., Wang, Y., Jiang, C., Meng, X., Sun, Y., & Cai, J. (2024) · Journal of Advanced Research · doi:10.1016/j.jare.2024.07.033 · Cited by 12
Jiménez, D., & Arias, M. T. (2022) · Immunological Medicine · doi:10.1080/25785826.2022.2066251 · Cited by 12
Shih, H.-J. S., Winstein, C. J., & Kulig, K. (2021) · Experimental Brain Research · doi:10.1007/s00221-021-06106-8 · Cited by 11
LRRC15 is an inhibitory receptor blocking SARS-CoV-2 spike-mediated entry in transPreprint
Song, J., Chow, R. D.-W., Peña-Hernández, M. A., Zhang, L., Loeb, S. A., So, E. Y., Liang, O. D., Wilen, C. B., & Lee, S. (2021) · bioRxiv (Cold Spring Harbor Laboratory) · doi:10.1101/2021.11.23.469714 · Cited by 11
Xing, J., Shankar, R., Ko, M., Zhang, K., Zhang, S., Drelich, A. K., Paithankar, S., Chekalin, E., Chua, M., Rajasekaran, S., et al. (2022) · iScience · doi:10.1016/j.isci.2022.105068 · Cited by 9
Passi, R., Brittan, M., & Baker, A. H. (2023) · Current Opinion in Physiology · doi:10.1016/j.cophys.2023.100670 · Cited by 10
High Dimensional Proteomic Multiplex Imaging of the Central Nervous System Using the COMET™ SystemPreprint
Najem, H., Pacheco, S., Turunen, J. R., Tripathi, S., Steffens, A., McCortney, K., Walshon, J. P., Chandler, J., Stupp, R., Lesniak, M. S., et al. (2025) · bioRxiv (Cold Spring Harbor Laboratory) · doi:10.1101/2025.02.14.638299 · Cited by 12
Spatial Omics Sequencing Based on Microfluidic Array Chips
Shi, J., Pan, Y., Liu, X., Cao, W., Mu, Y., & Zhu, Q. (2023) · Biosensors · doi:10.3390/bios13070712 · Cited by 9
Huang, X., Zhang, K.-J., Jiang, J., Jiang, S., Lin, J.-B., & Lou, Y. (2022) · Frontiers in Endocrinology · doi:10.3389/fendo.2022.801260 · Cited by 9
Immune and epithelial determinants of age-related risk and alveolar injury in fatal COVID-19
Chait, M., Yilmaz, M., Shakil, S., Ku, A. W., Dogra, P., Connors, T. J., Szabo, P. A., Gray, J. I., Wells, S. B., Kubota, M., et al. (2022) · JCI Insight · doi:10.1172/jci.insight.157608 · Cited by 9
Lau, M. C., Yang, Y., Goh, D. L. M., Cheung, C. C. L., Tan, B., Lim, J. C. T., Joseph, C. R., Wee, F. Y. T., Lee, J. N., Lim, X., et al. (2022) · Frontiers in Immunology · doi:10.3389/fimmu.2022.978760 · Cited by 9
A novel insight on SARS-CoV-2 S-derived fragments in the control of the host immunity
Bastos, T. S. B., de Paula, A. G. P., Luz, R. B. D. S., Garnique, A. M. B., Belo, M. A. D. A., Eto, S. F., Fernandes, D. C., Ferraris, F. K., de Pontes, L. G., França, T. T., et al. (2023) · Scientific Reports · doi:10.1038/s41598-023-29588-8 · Cited by 9
Fraga‐Silva, T. F. D. C., Cipriano, U. G., Fumagalli, M. J., Corrêa, G. F., Fuzo, C. A., dos-Santos, D., Mestriner, F., Becari, C., Teixeira‐Carvalho, A., Coelho-dos-Reis, J. G. A., et al. (2023) · iScience · doi:10.1016/j.isci.2023.108366 · Cited by 9
Milross, L., Hunter, B., McDonald, D., Merces, G., Thomson, A., Hilkens, C. M. U., Wills, J. W., Rees, P. C. T., Jiwa, K., Cooper, N. G. F., et al. (2023) · EBioMedicine · doi:10.1016/j.ebiom.2023.104945 · Cited by 8
Fernández‐Soto, D., García-Jiménez, Á. F., Casasnovas, J. M., Valés‐Gómez, M., & Reyburn, H. T. (2024) · Frontiers in Immunology · doi:10.3389/fimmu.2024.1273942 · Cited by 8
Alvarez, C. R., Kee, C., Sharma, A. K., Thomas, L., Schmidt, F. I., Stanifer, M. L., Boulant, S., & Herrmann, C. (2021) · PLoS Pathogens · doi:10.1371/journal.ppat.1009687 · Cited by 8
Oh, T., Kim, G., Baek, S. H., Woo, Y., Koo, B., Hwang, E.-H., Shim, K., An, Y. J., Kim, Y.-J., Won, J., et al. (2023) · Communications Biology · doi:10.1038/s42003-023-05253-8 · Cited by 9
Cholinergic and lipid mediators crosstalk in Covid-19 and the impact of glucocorticoid therapyPreprint
Pérez, M. M., Pimentel, V. E., Fuzo, C. A., Silva-Neto, P. V. D., Toro, D. M., Souza, C. O. S., Fraga‐Silva, T. F. D. C., Gardinassi, L. G., de Carvalho, J. C. S., Neto, N. T., et al. (2021) · medRxiv · doi:10.1101/2021.01.07.20248970 · Cited by 8
Meta-analysis of Transcriptomic Data from Lung Autopsy and Cellular Models of SARS-CoV-2 Infection
Cadore, N. A., Lord, V. O., Recamonde‐Mendoza, M., Kowalski, T. W., & Vianna, F. S. L. (2023) · Biochemical Genetics · doi:10.1007/s10528-023-10453-2 · Cited by 7
Ng, A. H. C., Hu, H., Wang, K., Scherler, K., Warren, S. E., Zollinger, D. R., McKay-Fleisch, J., Sorg, K., Beechem, J., Ragaglia, E., et al. (2023) · Cell Reports · doi:10.1016/j.celrep.2023.113212 · Cited by 7
Self-citationDisruption of immune responses by type 1 diabetes exacerbates SARS-CoV-2 mediated lung injury
Kass-Gergi, S., Gan, Z., Wong, J., Weiner, A. I., Adams‐Tzivelekidis, S., Gentile, M. E., Mendoza, M., Holcomb, N. P., Li, X., Singh, M., et al. (2024) · American Journal of Physiology-Lung Cellular and Molecular Physiology · doi:10.1152/ajplung.00250.2024 · Cited by 7
Peng, H., Zheng, B., Yang, S., Du, J., Cao, L., Liu, L., Ma, Z., Wu, J., Li, C., Zhang, H., et al. (2022) · Journal of Medical Virology · doi:10.1002/jmv.28021 · Cited by 7
deAndrés‐Galiana, E. J., Fernández‐Martínez, J. L., Álvarez-Machancoses, Ó., Bea, G., Galmarini, C. M., & Kloczkowski, A. (2022) · Computers in Biology and Medicine · doi:10.1016/j.compbiomed.2022.106029 · Cited by 7
Oh, T., Kim, G., Baek, S. H., Woo, Y., Koo, B., Hwang, E., Shim, K., An, Y. J., Kim, Y., Park, J., et al. (2023) · Journal of Medical Virology · doi:10.1002/jmv.28847 · Cited by 8
Shivshankar, P., Mueller‐Ortiz, S. L., Domozhirov, A. Y., Bi, W., Collum, S. D., Doursout, M., Patel, M. K., LeFebvre, I. N., Akkanti, B. H., Yau, S., et al. (2025) · Respiratory Research · doi:10.1186/s12931-025-03152-6 · Cited by 7
Jankowski, J., Lee, H., Wilflingseder, J., & Hennighausen, L. G. (2021) · iScience · doi:10.1016/j.isci.2021.102928 · Cited by 6
Generation of 2.5D lung bud organoids from human induced pluripotent stem cells
Xu, X., Nie, Y. G., Wang, W., Ullah, I., Tung, W. T., Ma, N., & Lendlein, A. (2021) · Clinical Hemorheology and Microcirculation · doi:10.3233/ch-219111 · Cited by 6
Cell tropism and viral clearance during SARS-CoV-2 lung infection
Schwab, C., Domke, L. M., Rose, F., Haußer, I., Schirmacher, P., & Longerich, T. (2022) · Pathology - Research and Practice · doi:10.1016/j.prp.2022.154000 · Cited by 6
Potamias, G., Gkoublia, P., & Kanterakis, A. (2023) · Frontiers in Immunology · doi:10.3389/fimmu.2023.1251067 · Cited by 6
Aguilar, D., Bosacoma, A., Blanco, I., Tura-Ceide, O., Serrano‐Mollar, A., Barberà, J. A., & Peinado, V. I. (2022) · Life · doi:10.3390/life12060887 · Cited by 6
Protein Arginylation Is Regulated during SARS-CoV-2 Infection
Macedo-da-Silva, J., Rosa-Fernandes, L., Gomes, V. M., Santiago, V. F., Santos, D. M., Molnár, C. M. S., Barboza, B. R., de Souza, E. E., Marques, R. F., Boscardin, S. B., et al. (2023) · Viruses · doi:10.3390/v15020290 · Cited by 6
Spatial resolution of SARS-CoV-2 lung infection
Pia, L. (2020) · Nature reviews. Immunology · doi:10.1038/s41577-020-00432-8 · Cited by 5
Han, Y., Leng, D., Zhang, T., Ge, J., Fang, Y., Lu, T., Dong, X., Nair, M. S., de Silva, N., Han, Z., et al. (2025) · Advanced Science · doi:10.1002/advs.202503932 · Cited by 6
Sun, Y., Saito, K., Ushiki, A., Abe, M., Saito, Y., Kashiwada, T., Horimasu, Y., Gemma, A., Tatsumi, K., Hattori, N., et al. (2024) · Respiratory Research · doi:10.1186/s12931-023-02653-6 · Cited by 6
Elevated blood anandamide levels in acute COVID-19 pneumonia with respiratory failure
Basu, A., Pommerolle, L., Arif, M., Meliton, A. Y., Udofia, I. A., Wu, D., Mutlu, G. M., Gochuico, B. R., Summer, R. S., Adegunsoye, A., et al. (2025) · The American Journal of the Medical Sciences · doi:10.1016/j.amjms.2025.06.003 · Cited by 4
Özbek, M., Toy, H. I., Takan, I., Asfa, S., Bonab, R. A., Karakülah, G., Kontou, P. I., Geronikolou, S. A., & Pavlopoulou, A. (2022) · Viruses · doi:10.3390/v15010104 · Cited by 4
Yang, D., Chan, J. F., Yoon, C., Luk, T., Shuai, H., Hou, Y., Huang, X., Hu, B., Chai, Y., Yuen, T. T., et al. (2024) · Journal of Medical Virology · doi:10.1002/jmv.29472 · Cited by 4
Highlights from a year in a pandemic
Mérad, M., & Vabret, N. (2021) · The Journal of Experimental Medicine · doi:10.1084/jem.20210220 · Cited by 5
Background modeling, Quality Control and Normalization for GeoMx RNA data with GeoDiffPreprint
Yang, L., Yang, Z. G., Danaher, P. J., Zimmerman, S. M., HETHER, T. D., Henderson, D., & Beechem, J. (2022) · bioRxiv (Cold Spring Harbor Laboratory) · doi:10.1101/2022.05.26.493637 · Cited by 4
Self-citationCOVID-19 immune signatures in Uganda persist in HIV co-infection and diverge by pandemic phase
Cummings, M. J., Bakamutumaho, B., Lutwama, J. J., Owor, N., Che, X., Astorkia, M., Postler, T. S., Kayiwa, J. T., Kiconco, J., Muwanga, M., et al. (2024) · Nature Communications · doi:10.1038/s41467-024-45204-3 · Cited by 3
Prabahar, A., & Palanisamy, A. (2022) · Methods in molecular biology · doi:10.1007/978-1-0716-2305-3_11 · Cited by 3
Bukhari, A. H., Ahmed, E., Raja, M. A. Z., Chen, Y., & Shoaib, M. (2023) · Waves in Random and Complex Media · doi:10.1080/17455030.2023.2186713 · Cited by 3
Chowdhury, R., Taguchi, A. T., Kelbauskas, L., Stafford, P., Diehnelt, C. W., Zhao, Z., Williamson, P. C., Green, V., & Woodbury, N. W. (2023) · PLoS Computational Biology · doi:10.1371/journal.pcbi.1010773 · Cited by 3
Rosani, U., Vecchio, C. D., Franchin, E., Brun, P., Ferrari, S., Ponzin, D., & Leonardi, A. (2022) · Experimental Eye Research · doi:10.1016/j.exer.2022.108975 · Cited by 3
Copin, M., Gibier, J., Hofman, V., & Hofman, P. M. (2021) · European Respiratory Society eBooks · doi:10.1183/2312508x.10024220 · Cited by 3
Lung lipid deposition in pneumonias of different etiologiesPreprint
Potashnikova, D. M., Tvorogova, A. V., Komissarov, A. A., Saidova, A. A., Sotnikova, T. N., Makarova, V. O., Arifulin, E. A., Lipina, T., Shirokova, O. M., Melnikov, E. S., et al. (2023) · bioRxiv (Cold Spring Harbor Laboratory) · doi:10.1101/2022.12.30.522299 · Cited by 3
Peripheral blood, lung and brain gene signatures in recovered and deceased patients with COVID-19
Twum, E., Baranova, A. V., & Ullah, A. (2025) · In Silico Pharmacology · doi:10.1007/s40203-025-00450-1 · Cited by 2
Liu, C., & Yuan, X. (2026) · Virology · doi:10.1016/j.virol.2026.110913 · Cited by 2
Mapping Immunity With Cutting‐Edge Spatial Biology and Tissue Cytometry Innovations
Cárdenas-Piedra, L., Samuel, S. G., Mungenast, F., Yasothkumar, D., Ecker, R., & Batra, J. (2026) · MedComm · doi:10.1002/mco2.70775 · Cited by 2
Single‐cell analytical technologies: uncovering the mechanisms behind variations in immune responses
Kashima, Y., Reteng, P., Haga, Y., Yamagishi, J., & Suzuki, Y. (2022) · FEBS Journal · doi:10.1111/febs.16622 · Cited by 2
COVID-19: detection methods in post-mortem samples
Tedesco, I., Marino, F. Z., Ronchi, A., Neto, A. N. D., Dolhnikoff, M., Municinò, M., Campobasso, C. P., Pannone, G., & Franco, R. (2023) · Pathologica · doi:10.32074/1591-951x-933 · Cited by 2
Pan, R., Meyerholz, D. K., & Perlman, S. M. (2025) · mBio · doi:10.1128/mbio.03693-24 · Cited by 2
Bai, Y., Cui, X., Gao, X., Liu, C., Lv, X., & Zheng, S. (2021) · Molecular Immunology · doi:10.1016/j.molimm.2021.05.013 · Cited by 2
COVID-19 Impact on Host at Pathophysiological and Cellular Level
Indari, O., Jakhmola, S., Kashyap, D., Baral, B., Verma, T., Jain, K., & Jha, H. C. (2022) · Springer eBooks · doi:10.1007/978-3-031-08045-6_5 · Cited by 2
Li, P., Liu, M., & He, W.-M. (2024) · Life · doi:10.3390/life14080960 · Cited by 2
Cong, B., Dong, X., Yang, Z., Yü, P., Chai, Y., Liu, J., Zhang, M., Zang, Y., Kang, J., Feng, Y., et al. (2022) · bioRxiv (Cold Spring Harbor Laboratory) · doi:10.1101/2022.05.03.490381 · Cited by 2
Pugh, M., Fennell, É., Leahy, C. I., Perry, T., Hargitai, B., Marton, T., Hunter, K. J., Halford, G., Yilmaz, H. O., Stamataki, Z., et al. (2022) · bioRxiv (Cold Spring Harbor Laboratory) · doi:10.1101/2022.11.14.516398 · Cited by 2
Self-inhibiting percolation and viral spreading in epithelial tissue
Xu, X., Nielsen, B. F., & Sneppen, K. (2024) · eLife · doi:10.7554/elife.94056 · Cited by 1
Self-inhibiting percolation and viral spreading in epithelial tissue
Xu, X., Nielsen, B. F., & Sneppen, K. (2024) · eLife · doi:10.7554/elife.94056.3 · Cited by 1
Severe COVID-19 and Telomere Shortening: Overview of Roles and Effects
Chen, S. (2024) · Journal of Biosciences and Medicines · doi:10.4236/jbm.2024.1212015 · Cited by 2
TROPPO: tissue-specific reconstruction and phenotype prediction using omics data
Oliveira, A., Ferreira, J., Vieira, V., Sá, B., & Rocha, M. (2024) · Bioinformatics Advances · doi:10.1093/bioadv/vbaf113 · Cited by 1
Xu, J., Kuniya, T., Fan, G., Jin, Z., & Song, H. (2026) · Mathematics and Computers in Simulation · doi:10.1016/j.matcom.2026.01.012 · Cited by 1
Hadžić, S., Gredic, M., Nebel, V., Weißmann, N., & Wu, C. (2026) · Cells · doi:10.3390/cells15080737 · Cited by 1
Multimodal data integration to determine viral and innate immune kinetics in human airway epithelium
Lukas, P., Gibeaud, A., Schumer, C., Arruda, J., Guedj, J., Terrier, O., & Graw, F. (2026) · PLoS Computational Biology · doi:10.1371/journal.pcbi.1014248 · Cited by 1
Macedo-da-Silva, J., Coutinho, J. V. P., Rosa-Fernandes, L., Marie, S. K. N., & Palmisano, G. (2022) · Advances in protein chemistry and structural biology · doi:10.1016/bs.apcsb.2022.04.002 · Cited by 1
Ghosh, B., Das, T., Das, G., Chowdhury, N., Bagchi, A., & Ghosh, Z. (2023) · Current Bioinformatics · doi:10.2174/1574893618666230605120640 · Cited by 1
Lou, S., Yang, M., Li, T., Zhao, W., Cevasco, H., Yang, Y., & Gerstein, M. (2023) · PLoS Computational Biology · doi:10.1371/journal.pcbi.1011222 · Cited by 1
Translational and clinical applications of the GeoMx digital spatial profiling platform
Church, S., Perez, J., Murphy, B., Sato, H., Warren, S. E., & Beechem, J. (2023) · Elsevier eBooks · doi:10.1016/b978-0-12-822824-1.00034-1 · Cited by 1
Self-citationSpatial microenvironments tune immune response dynamics in the Drosophila larval fat body
Schlomann, B. H., Pai, T.-W., Sandhu, J., Imbert, G. F., Graham, T. G. W., & García, H. G. (2026) · PLoS Genetics · doi:10.1371/journal.pgen.1012029 · Cited by 1
Metadata
- Authors
- Desai, N., Neyaz, A., Szabolcs, A., Shih, A. R., Chen, J. H., Thapar, V., Nieman, L. T., Solovyov, A., Mehta, A., Lieb, D. J., Kulkarni, A. S., Jaicks, C., Xu, K. H., Raabe, M. J., Pinto, C. J., Juric, D., Chebib, I., Colvin, R. B., Kim, A. Y., Monroe, R., Warren, S. E., Danaher, P., Reeves, J. W., Gong, J., Rueckert, E. H., Greenbaum, B. D., Hacohen, N., Lagana, S. M., Rivera, M. N., Sholl, L. M., Stone, J. R., Ting, D. T., & Deshpande, V.
- Affiliations
- Massachusetts General Hospital (US)
- Memorial Sloan Kettering Cancer Center (US)
- Broad Institute (US)
- Advanced Cell Diagnostics (United States) (US)
- Nanostring Technologies (United States) (US)
- Columbia University Irving Medical Center (US)
- Brigham and Women's Hospital (US)
- Harvard University (US)
- Corresponding author
- Stone, James R.
- Ting, David T.
- Deshpande, Vikram
- ORCID
- Desai, Niyati
- Neyaz, Azfar
- Szabolcs, Annamaria
- Shih, Angela R.
- Chen, Jonathan H.
- Thapar, Vishal
- Nieman, Linda T.
- Solovyov, Alexander
- Mehta, Arnav
- Lieb, David J.
- Kulkarni, Anupriya S.
- Jaicks, Christopher
- Xu, Katherine H.
- Raabe, Michael J.
- Juric, Dejan
- Chebib, Ivan
- Colvin, Robert B.
- Kim, Arthur Y.
- Warren, Sarah E.
- Danaher, Patrick
- Reeves, Jason W.
- Gong, Jingjing
- Greenbaum, Benjamin D.
- Hacohen, Nir
- Lagana, Stephen M.
- Rivera, Miguel N.
- Sholl, Lynette M.
- Stone, James R.
- Ting, David T.
- Deshpande, Vikram
- Venue
- Nature Communications
- Published
- 2020-12-09
- Volume
- 11
- Issue
- 1
- Pages
- 6319-6319
- ISSN
- 2041-1723 (ISSN-L)
- PMC
- PMC7725958
- OpenAlex
- W3112860625
- Cited by
- 245
- References
- 51
- Citations by year
- 2026: 17 · 2025: 9 · 2024: 27 · 2023: 45 · 2022: 70 · 2021: 70 · 2020: 7
- FWCI
- 6.45
- Type
- journal article
- Language
- en
- Open access
- gold
- doi.org
- Locations
- Nature Communications (publishedVersion, cc-by)
- medRxiv (acceptedVersion, cc-by)
- PubMed Central (publishedVersion, cc-by)
- PubMed (publishedVersion)
- PubMed Central (submittedVersion, cc-by)
- RePEc: Research Papers in Economics (submittedVersion)
- DOAJ (DOAJ: Directory of Open Access Journals) (submittedVersion, cc-by-sa)
- Funders
- U.S. Department of Health & Human Services | NIH | National Cancer Institute (R01CA240924, 7R01AI081848-04)
- ACD/Biotechne, The MGH Research Scholars Program, The Pershing Square Sohn Prize—Mark Foundation Fellow, The V Foundation, SU2C-Lustgarten
- Topics
- Health Sciences › Medicine › Infectious Diseases › SARS-CoV-2 and COVID-19 Research
- Health Sciences › Medicine › Infectious Diseases › COVID-19 Clinical Research Studies
- Life Sciences › Immunology and Microbiology › Immunology › interferon and immune responses
- Keywords
- SARS-CoV-2, COVID-19 pandemic, pulmonary infection, interferon pathway, M1 macrophages, spatial transcriptomics, digital spatial profiling, Napsin A, mucin genes, disease severity, autopsy specimens
About these checks
Registry, retraction, Cites and statistics results are computed, not judged, with one exception: a printed reference that no index lists is read once by a model before it counts as a citation error. Claims are extracted by a model and kept only when their quote appears verbatim in the text; each cited source is then checked, with a model’s help, for whether it says what the claim relies on. Those verdicts can be wrong — read the claim’s quote and the cited source before relying on one.
Statistics and arithmetic are recomputed, not judged.
Confidence bands are shown only for fields calibrated on our annotated test set. None is calibrated yet, so no band is shown.
What counts as a claim ›How we measure confidence ›How we check this ›
Are you an author, or do you see a problem with this page? Request a review
