

‘MINFLUX nanometer-scale 3D imaging and microsecond-range tracking on a common fluorescence microscope’
Open accessThe DOI matches its Crossref record; 33 of the 34 references it cites were found in a registry or an index.
Abstract
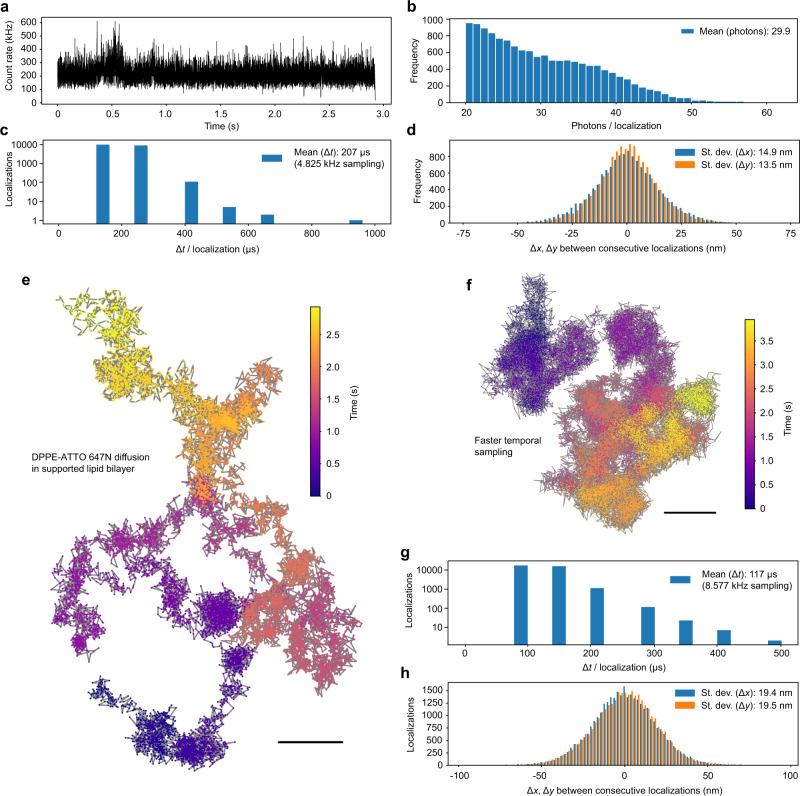
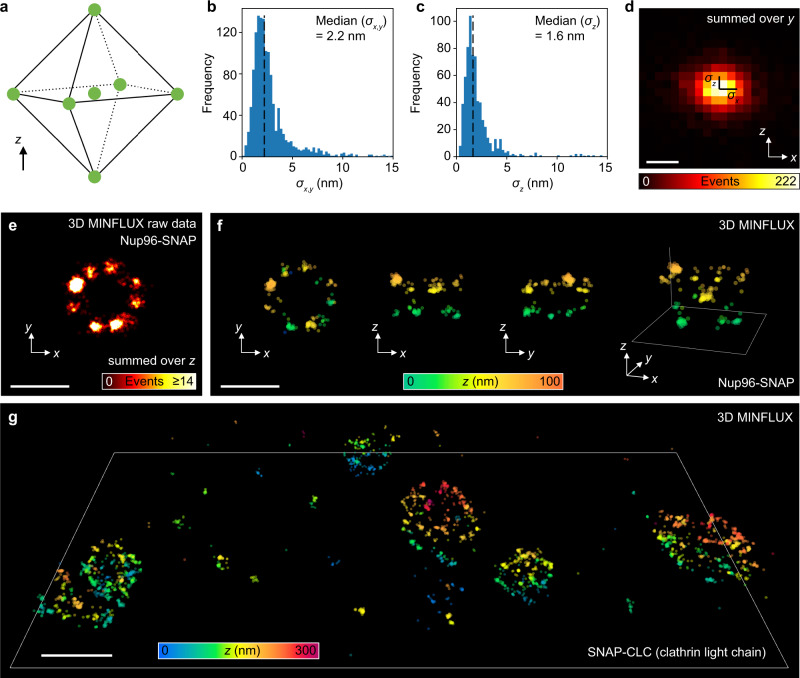
The recently introduced minimal photon fluxes (MINFLUX) concept pushed the resolution of fluorescence microscopy to molecular dimensions. Initial demonstrations relied on custom made, specialized microscopes, raising the question of the method’s general availability. Here, we show that MINFLUX implemented with a standard microscope stand can attain 1–3 nm resolution in three dimensions, rendering fluorescence microscopy with molecule-scale resolution widely applicable. Advances, such as synchronized electro-optical and galvanometric beam steering and a stabilization that locks the sample position to sub-nanometer precision with respect to the stand, ensure nanometer-precise and accurate real-time localization of individually activated fluorophores. In our MINFLUX imaging of cell- and neurobiological samples, ~800 detected photons suffice to attain a localization precision of 2.2 nm, whereas ~2500 photons yield precisions <1 nm (standard deviation). We further demonstrate 3D imaging with localization precision of ~2.4 nm in the focal plane and ~1.9 nm along the optic axis. Localizing with a precision of <20 nm within ~100 µs, we establish this spatio-temporal resolution in single fluorophore tracking and apply it to the diffusion of single labeled lipids in lipid-bilayer model membranes.
Overview
The claims and statistics of this paper haven’t been checked yet.
Free: it reads the open-access text and checks the first 5 claims that cite a source we can check. Create a free account to check every claim.
Integrity signals
Registry
Cites
Statistics
Figures


Verification
Claims the paper makes
The claims and statistics of this paper haven’t been checked yet.
Free: it reads the open-access text and checks the first 5 claims that cite a source we can check. Create a free account to check every claim.
Claims other papers make about this one
Each is checked against this paper’s own text: does it say what the citing paper says it does?
The source backs part of the claim, not all of it — or backs it for a different population, condition or comparison.
In the citing paper
“For example, advanced MINFLUX microscopy from the Hell lab enables the tracking of particles as small as 1–2 nm for 100 s of microseconds (Eilers et al., 2018; Schmidt et al., 2021).”
From Molecular dynamics simulation of an entire cell (2023) · cites this paper as Schmidt et al., 2021
Experimental — accuracy not yet measured
Self-check
Percentages, sums and reported differences re-computed from the paper’s own numbers.
The self-check needs the paper’s full text.
Citations
Cites
Imaging Intracellular Fluorescent Proteins at Nanometer Resolution
Betzig, E., Patterson, G. H., Sougrat, R., Lindwasser, O. W., Olenych, S., Bonifacino, J. S., Davidson, M. W., Lippincott-Schwartz, J., & Hess, H. F. (2006) · Science · doi:10.1126/science.1127344 · Cited by 8,772
Sub-diffraction-limit imaging by stochastic optical reconstruction microscopy (STORM)
Rust, M. J., Bates, M., & Zhuang, X. (2006) · Nature Methods · doi:10.1038/nmeth929 · Cited by 8,078
Hell, S. W., & Wichmann, J. (1994) · Optics Letters · doi:10.1364/ol.19.000780 · Cited by 6,065
Self-citationUltra-High Resolution Imaging by Fluorescence Photoactivation Localization Microscopy
Hess, S. T., Girirajan, T. P. K., & Mason, M. D. (2006) · Biophysical Journal · doi:10.1529/biophysj.106.091116 · Cited by 3,605
Hell, S. W. (2007) · Science · doi:10.1126/science.1137395 · Cited by 2,967
Self-citationFluorescence microscopy with diffraction resolution barrier broken by stimulated emission
Klar, T. A., Jakobs, S., Dyba, M., Egner, A., & Hell, S. W. (2000) · Proceedings of the National Academy of Sciences · doi:10.1073/pnas.97.15.8206 · Cited by 1,869
Self-citationThe ParaView Guide: A Parallel Visualization Application
Ayachit, U. (2015) · Cited by 1,805
Direct observation of the nanoscale dynamics of membrane lipids in a living cell
Eggeling, C., Ringemann, C., Medda, R., Schwarzmann, G., Sandhoff, K., Polyakova, S., Belov, V. N., Hein, B., von Middendorff, C., Schönle, A., et al. (2009) · Nature · doi:10.1038/nature07596 · Cited by 1,520
Self-citationNanometer resolution imaging and tracking of fluorescent molecules with minimal photon fluxes
Balzarotti, F., Eilers, Y., Gwosch, K. C., Gynnå, A. H., Westphal, V., Stefani, F. D., Elf, J., & Hell, S. W. (2017) · Science · doi:10.1126/science.aak9913 · Cited by 1,225
Self-citationWide-field subdiffraction imaging by accumulated binding of diffusing probes
Sharonov, A., & Hochstrasser, R. M. (2006) · Proceedings of the National Academy of Sciences · doi:10.1073/pnas.0609643104 · Cited by 1,151
Cited by
Super-Resolution Microscopy for Structural Cell Biology
Liu, S., Hoess, P., & Ries, J. (2022) · Annual Review of Biophysics · doi:10.1146/annurev-biophys-102521-112912 · Cited by 220
MINFLUX dissects the unimpeded walking of kinesin-1
Wolff, J. O., Scheiderer, L., Engelhardt, T., Engelhardt, J., Matthias, J., & Hell, S. W. (2023) · Science · doi:10.1126/science.ade2650 · Cited by 188
“For a given NN, MINFLUX (17-20) typically renders a STR of σσ √ττ ⁄ with about 10-fold”
Self-citationDirect observation of motor protein stepping in living cells using MINFLUX
Deguchi, T., Iwanski, M. K., Schentarra, E.-M., Heidebrecht, C., Schmidt, L., Heck, J., Weihs, T., Schnorrenberg, S., Hoess, P., Liu, S., et al. (2023) · Science · doi:10.1126/science.ade2676 · Cited by 167
“The pHTN-HaloTag-KIF5B[1-560] construct (Halo-K560) was generated equivalently, except using different primers to obtain the truncated KIF5B gene (1-560).”
Self-citationMolecular dynamics simulation of an entire cell
Stevens, J. A., Grünewald, F., van Tilburg, P. A. M., König, M., Gilbert, B. R., Brier, T. A., Thornburg, Z. R., Luthey-Schulten, Z., & Marrink, S. J. (2023) · Frontiers in Chemistry · doi:10.3389/fchem.2023.1106495 · Cited by 156
“For example, advanced MINFLUX microscopy from the Hell lab enables the tracking of particles as small as 1 – 2 nm for 100 s of microseconds (Eilers et al., 2018; Schmidt et al., 2021).”
MethodDirect observation of the conformational states of PIEZO1
Mulhall, E. M., Gharpure, A., Lee, R. M., Dubin, A. E., Aaron, J. S., Marshall, K. L., Spencer, K. R., Reiche, M. A., Henderson, S. C., Chew, T.-L., et al. (2023) · Nature · doi:10.1038/s41586-023-06427-4 · Cited by 159
“To accomplish this, we used MINFLUX, a 3D super-resolution fluorescence microscopy method capable of true isotropic resolution with only 5-to 6-nm localization error 30–32 .”
Influential
Metadata
- Authors
- Schmidt, R., Weihs, T., Wurm, C. A., Jansen, I., Rehman, J., Sahl, S. J., & Hell, S. W.
- Affiliations
- Max Planck Institute for Biophysical Chemistry (DE)
- Max Planck Institute for Medical Research (DE)
- Corresponding author
- Schmidt, Roman
- Hell, Stefan W.
- ORCID
- Venue
- Nature Communications
- Published
- 2021-03-05
- Volume
- 12
- Issue
- 1
- Pages
- 1478-1478
- ISSN
- 2041-1723 (ISSN-L)
- PMC
- PMC7935904
- OpenAlex
- W3133879440
- Cited by
- 306
- References
- 34
- Citations by year
- 2026: 41 · 2025: 94 · 2024: 57 · 2023: 58 · 2022: 41 · 2021: 15
- FWCI
- 19.49
- Type
- journal article
- Language
- en
- Open access
- gold
- doi.org
- Licence
- cc-by
- creativecommons.org/licenses/by/4.0 (tdm)
- creativecommons.org/licenses/by/4.0 (vor)
- Locations
- Nature Communications (publishedVersion, cc-by)
- PubMed Central (publishedVersion, cc-by)
- PubMed (publishedVersion)
- RePEc: Research Papers in Economics (submittedVersion)
- DOAJ (DOAJ: Directory of Open Access Journals) (submittedVersion, cc-by-sa)
- GoeScholar The Publication Server of the Georg-August-Universität Göttingen (Georg-August-Universität Göttingen) (submittedVersion, cc-by)
- MPG.PuRe (Max Planck Society) (submittedVersion)
- Funders
- European Molecular Biology Laboratory
- Bundesministerium für Bildung und Forschung (13N14122)
- Max-Planck-Gesellschaft
- Freie Universität Berlin
- Topics
- Life Sciences › Biochemistry, Genetics and Molecular Biology › Biophysics › Advanced Fluorescence Microscopy Techniques
- Physical Sciences › Physics and Astronomy › Atomic and Molecular Physics, and Optics › Force Microscopy Techniques and Applications
- Life Sciences › Biochemistry, Genetics and Molecular Biology › Biophysics › Cell Image Analysis Techniques
- Keywords
- MINFLUX, single-molecule localization, single-molecule fluorescence microscopy, beam steering, sample stabilization, single-molecule tracking
- MeSH terms
- Diffusion, Equipment Design, Fluorescence, Fluorescent Dyes, Image Processing, Computer-Assisted, Microscopy, Fluorescence, Photons, Imaging, Three-Dimensional
About these checks
Registry, retraction, Cites and statistics results are computed, not judged, with one exception: a printed reference that no index lists is read once by a model before it counts as a citation error. Claims are extracted by a model and kept only when their quote appears verbatim in the text; each cited source is then checked, with a model’s help, for whether it says what the claim relies on. Those verdicts can be wrong — read the claim’s quote and the cited source before relying on one.
Statistics and arithmetic are recomputed, not judged.
Confidence bands are shown only for fields calibrated on our annotated test set. None is calibrated yet, so no band is shown.
What counts as a claim ›How we measure confidence ›How we check this ›
Are you an author, or do you see a problem with this page? Request a review
How to cite
Cite CoChat for the checks on this page, and the paper for its own findings.
- This page
- CoChat. (2026). Citation check: ‘MINFLUX nanometer-scale 3D imaging and microsecond-range tracking on a common fluorescence microscope’. https://app.cochat.ai/papers/10.1038/s41467-021-21652-z
- The paper
- Schmidt, R., Weihs, T., Wurm, C. A., Jansen, I., Rehman, J., Sahl, S. J., & Hell, S. W. (2021). ‘MINFLUX nanometer-scale 3D imaging and microsecond-range tracking on a common fluorescence microscope’. Nature Communications. https://doi.org/10.1038/s41467-021-21652-z
Data sources
Bibliographic data: Semantic Scholar, OpenAlex, Crossref.
Contains information from the Semantic Scholar Academic Graph Datasets, made available under the ODC Attribution License (ODC-BY 1.0).
Semantic Scholar’s data is described in: Kinney, R., et al. (2023). The Semantic Scholar Open Data Platform. arXiv:2301.10140.
