

A molecular timescale for eukaryote evolution with implications for the origin of red algal-derived plastids
Open accessPublished version of a preprint
The DOI matches its Crossref record; 126 of the 126 references it cites were found in a registry or an index.
Abstract
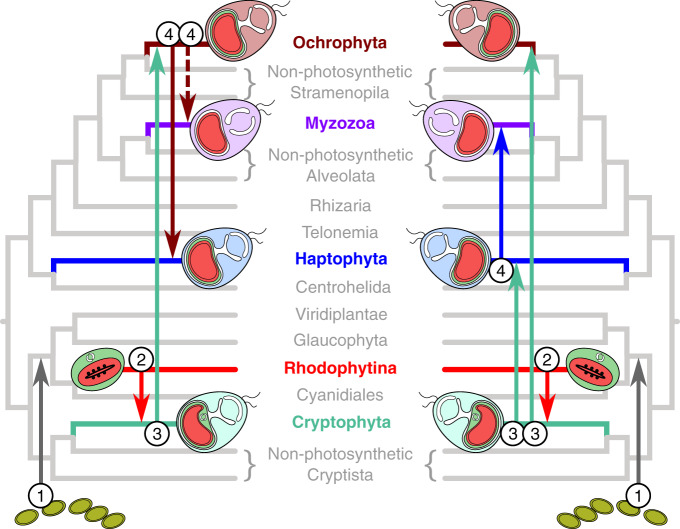
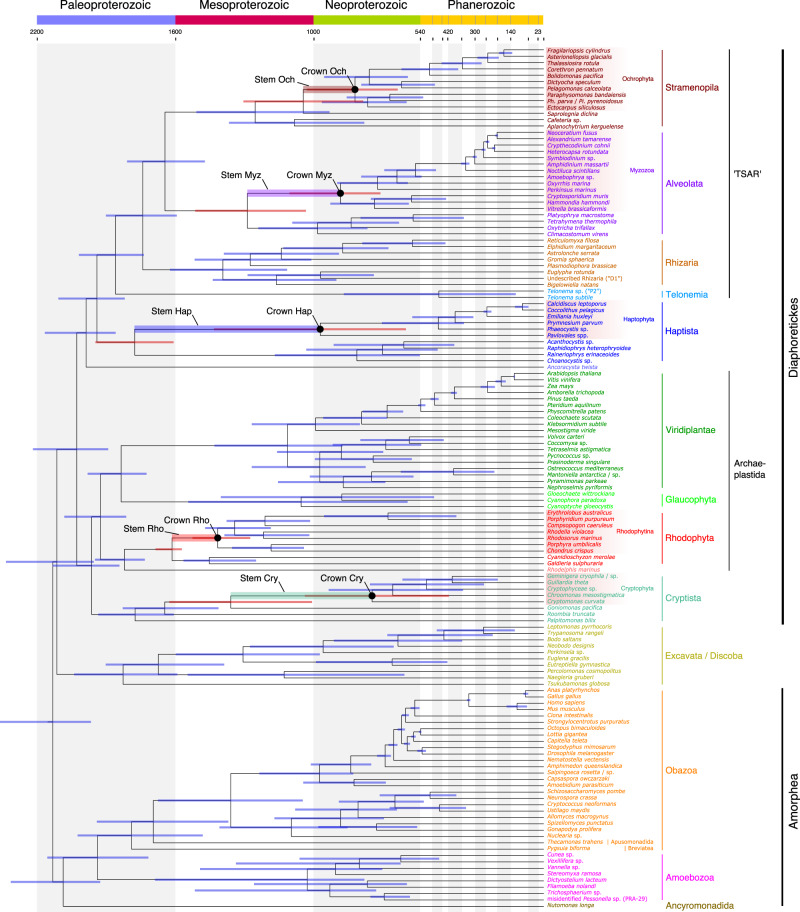
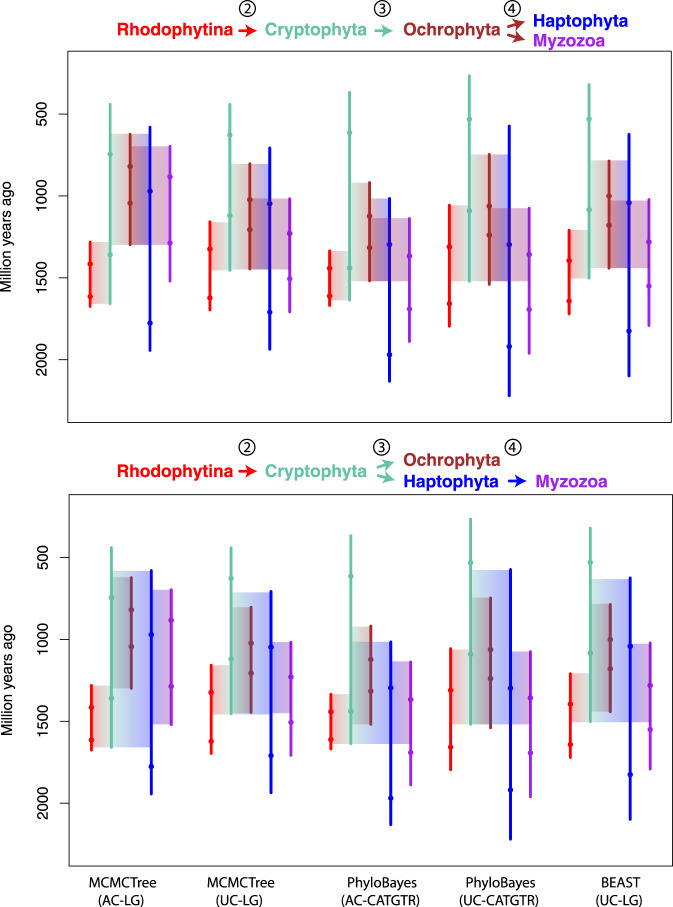
In modern oceans, eukaryotic phytoplankton is dominated by lineages with red algal-derived plastids such as diatoms, dinoflagellates, and coccolithophores. Despite the ecological importance of these groups and many others representing a huge diversity of forms and lifestyles, we still lack a comprehensive understanding of their evolution and how they obtained their plastids. New hypotheses have emerged to explain the acquisition of red algal-derived plastids by serial endosymbiosis, but the chronology of these putative independent plastid acquisitions remains untested. Here, we establish a timeframe for the origin of red algal-derived plastids under scenarios of serial endosymbiosis, using Bayesian molecular clock analyses applied on a phylogenomic dataset with broad sampling of eukaryote diversity. We find that the hypotheses of serial endosymbiosis are chronologically possible, as the stem lineages of all red plastid-containing groups overlap in time. This period in the Meso- and Neoproterozoic Eras set the stage for the later expansion to dominance of red algal-derived primary production in the contemporary oceans, which profoundly altered the global geochemical and ecological conditions of the Earth.
Overview
The claims and statistics of this paper haven’t been checked yet.
Free: it reads the open-access text and checks the first 5 claims that cite a source we can check. Create a free account to check every claim.
Integrity signals
Registry
Cites
Statistics
Figures
Verification
Claims the paper makes
The claims and statistics of this paper haven’t been checked yet.
Free: it reads the open-access text and checks the first 5 claims that cite a source we can check. Create a free account to check every claim.
Claims other papers make about this one
Each is checked against this paper’s own text: does it say what the citing paper says it does?
The source backs part of the claim, not all of it — or backs it for a different population, condition or comparison.
In the citing paper
“The LECA estimate (1.93–1.84 Ga, 95% highest posterior density) from our species tree analysis falls within published molecular clock estimates, placing LECA within a broad interval ~1–2.4 Ga25–27,97–99 (Fig. 5A, C, Supplementary Fig. 16, Supplementary Data 10).”
From ATP synthase evolution on a cross-braced dated tree of life (2023) · cites this paper as [99]
Experimental — accuracy not yet measuredThe source backs part of the claim, not all of it — or backs it for a different population, condition or comparison.
In the citing paper
“Some chromosomes in these lineages appear to have not undergone major fusions or translocations since their ancestor existed more than 600 million years ago (99), such as those of the myriazoan ALGs G, H, and P (69).”
From Topological Approaches in Animal Comparative Genomics (2026) · cites this paper as [99]
Experimental — accuracy not yet measuredThe check wasn’t confident either way, so it gives no verdict — never disputed.
In the citing paper
“Notably, the ancestor of this clade likely existed more than 600 million years ago (99).”
From Topological Approaches in Animal Comparative Genomics (2026) · cites this paper as [99]
Experimental — accuracy not yet measured
Self-check
Percentages, sums and reported differences re-computed from the paper’s own numbers.
The self-check needs the paper’s full text.
Citations
Cites
Basic local alignment search tool
Altschul, S. F., Gish, W., Miller, W., Myers, E. W., & Lipman, D. J. (1990) · Journal of Molecular Biology · doi:10.1006/jmbi.1990.9999 · Cited by 98,669
MAFFT Multiple Sequence Alignment Software Version 7: Improvements in Performance and Usability
Katoh, K., & Standley, D. M. (2013) · Molecular Biology and Evolution · doi:10.1093/molbev/mst010 · Cited by 46,209
RAxML version 8: a tool for phylogenetic analysis and post-analysis of large phylogenies
Stamatakis, A. (2014) · Bioinformatics · doi:10.1093/bioinformatics/btu033 · Cited by 32,291
IQ-TREE: A Fast and Effective Stochastic Algorithm for Estimating Maximum-Likelihood Phylogenies
Nguyen, L.-T., Schmidt, H. A., von Haeseler, A., & Minh, B. Q. (2015) · Molecular Biology and Evolution · doi:10.1093/molbev/msu300 · Cited by 26,046
PAML 4: Phylogenetic Analysis by Maximum Likelihood
Yang, Z. (2007) · Molecular Biology and Evolution · doi:10.1093/molbev/msm088 · Cited by 13,879
trimAl: a tool for automated alignment trimming in large-scale phylogenetic analyses
Capella-Gutiérrez, S., Silla-Martínez, J. M., & Gabaldón, T. (2009) · Bioinformatics · doi:10.1093/bioinformatics/btp348 · Cited by 12,751
Cd-hit: Accelerated for clustering the next-generation sequencing data
Fu, L., Niu, B., Zhu, Z., Wu, S., & Li, W. (2012) · Bioinformatics · doi:10.1093/bioinformatics/bts565 · Cited by 11,175
Posterior summarization in Bayesian phylogenetics using tracer 1.7
Rambaut, A., Drummond, A. J., Xie, D., Baele, G., & Suchard, M. A. (2018) · Systematic Biology · doi:10.1093/sysbio/syy032 · Cited by 11,159
UFBoot2: Improving the Ultrafast Bootstrap Approximation
Hoang, D. T., Chernomor, O., von Haeseler, A., Minh, B. Q., & Vinh, L. S. (2018) · Molecular Biology and Evolution · doi:10.1093/molbev/msx281 · Cited by 10,881
FastTree: Computing Large Minimum Evolution Trees with Profiles instead of a Distance Matrix
Price, M. N., Dehal, P. S., & Arkin, A. P. (2009) · Molecular Biology and Evolution · doi:10.1093/molbev/msp077 · Cited by 5,602
Cited by
Ancient gene linkages support ctenophores as sister to other animals
Schultz, D. T., Haddock, S. H. D., Bredeson, J. V., Green, R. E., Simakov, O., & Rokhsar, D. S. (2023) · Nature · doi:10.1038/s41586-023-05936-6 · Cited by 362
Diversity and ecology of protists revealed by metabarcoding
Burki, F., Sandin, M. M., & Jamy, M. (2021) · Current Biology · doi:10.1016/j.cub.2021.07.066 · Cited by 245
Self-citationBacterial and archaeal symbioses with protists
Husnik, F., Tashyreva, D., Boscaro, V., George, E. E., Lukeš, J., & Keeling, P. J. (2021) · Current Biology · doi:10.1016/j.cub.2021.05.049 · Cited by 163
The pyrenoid: the eukaryotic CO2-concentrating organelle
He, S., Crans, V. L., & Jonikas, M. C. (2023) · The Plant Cell · doi:10.1093/plcell/koad157 · Cited by 126
Single cell genomics reveals plastid-lacking Picozoa are close relatives of red algae
Schön, M. E., Zlatogursky, V. V., Singh, R. P., Poirier, C. L., Wilken, S., Mathur, V., Strassert, J. F. H., Pinhassi, J., Worden, A. Z., Keeling, P. J., et al. (2021) · Nature Communications · doi:10.1038/s41467-021-26918-0 · Cited by 118
Self-citation
Metadata
- Authors
- Strassert, J. F. H., Irisarri, I., Williams, T. A., & Burki, F.
- Affiliations
- Uppsala University (SE)
- University of Bristol (GB)
- Corresponding author
- Burki, Fabien
- Venue
- Nature Communications
- Published
- 2021-03-25
- Volume
- 12
- Issue
- 1
- Pages
- 1879-1879
- ISSN
- 2041-1723 (ISSN-L)
- PMC
- PMC7994803
- OpenAlex
- W3138022174
- Semantic Scholar
- 60f49d09119b55067e06207bcdb6011001f34075
- Cited by
- 298
- References
- 124
- Citations by year
- 2026: 40 · 2025: 61 · 2024: 77 · 2023: 53 · 2022: 53 · 2021: 14
- FWCI
- 15.78
- Type
- journal article
- Language
- en
- Update notices
- correction (2021-06-07)
- Open access
- gold
- doi.org
- Licence
- cc-by
- creativecommons.org/licenses/by/4.0 (tdm)
- creativecommons.org/licenses/by/4.0 (vor)
- Locations
- Nature Communications (publishedVersion, cc-by)
- bioRxiv (Cold Spring Harbor Laboratory) (acceptedVersion, cc-by-nc-nd)
- PubMed Central (publishedVersion, cc-by)
- PubMed (publishedVersion)
- Bristol Research (University of Bristol) (acceptedVersion, cc-by)
- Uppsala University Publications (Uppsala University) (submittedVersion, other-oa)
- RePEc: Research Papers in Economics (submittedVersion)
- DIGITAL.CSIC (Spanish National Research Council (CSIC)) (submittedVersion, cc-by)
- DOAJ (DOAJ: Directory of Open Access Journals) (submittedVersion, cc-by-sa)
- GoeScholar The Publication Server of the Georg-August-Universität Göttingen (Georg-August-Universität Göttingen) (submittedVersion)
- Explore Bristol Research (submittedVersion, cc-by)
- Funders
- Science for Life Laboratory
- Topics
- Life Sciences › Agricultural and Biological Sciences › Ecology, Evolution, Behavior and Systematics › Protist diversity and phylogeny
- Physical Sciences › Earth and Planetary Sciences › Paleontology › Evolution and Paleontology Studies
- Physical Sciences › Earth and Planetary Sciences › Paleontology › Paleontology and Stratigraphy of Fossils
- Keywords
- plastid origin, eukaryotic evolution, molecular clock, phylogenomics, diatoms, dinoflagellates, coccolithophores, primary production, red algae, eukaryotic phytoplankton
- MeSH terms
- Rhodophyta, Dinoflagellida, Biological Evolution, Oceans and Seas, Photosynthesis, Symbiosis, Diatoms, Plastids, Evolution, Molecular, Haptophyta
About these checks
Registry, retraction, Cites and statistics results are computed, not judged, with one exception: a printed reference that no index lists is read once by a model before it counts as a citation error. Claims are extracted by a model and kept only when their quote appears verbatim in the text; each cited source is then checked, with a model’s help, for whether it says what the claim relies on. Those verdicts can be wrong — read the claim’s quote and the cited source before relying on one.
Statistics and arithmetic are recomputed, not judged.
Confidence bands are shown only for fields calibrated on our annotated test set. None is calibrated yet, so no band is shown.
What counts as a claim ›How we measure confidence ›How we check this ›
Are you an author, or do you see a problem with this page? Request a review
How to cite
Cite CoChat for the checks on this page, and the paper for its own findings.
- This page
- CoChat. (2026). Citation check: A molecular timescale for eukaryote evolution with implications for the origin of red algal-derived plastids. https://app.cochat.ai/papers/10.1038/s41467-021-22044-z
- The paper
- Strassert, J. F. H., Irisarri, I., Williams, T. A., & Burki, F. (2021). A molecular timescale for eukaryote evolution with implications for the origin of red algal-derived plastids. Nature Communications. https://doi.org/10.1038/s41467-021-22044-z
Data sources
Bibliographic data: Semantic Scholar, OpenAlex, Crossref.
Contains information from the Semantic Scholar Academic Graph Datasets, made available under the ODC Attribution License (ODC-BY 1.0).
Semantic Scholar’s data is described in: Kinney, R., et al. (2023). The Semantic Scholar Open Data Platform. arXiv:2301.10140.
