

The DOI matches its Crossref record; 21 of the 22 references it cites were found in a registry or an index.
Heterologous vaccination regimens with self-amplifying RNA and adenoviral COVID vaccines induce robust immune responses in mice
Open accessPublished version of a preprint
Abstract
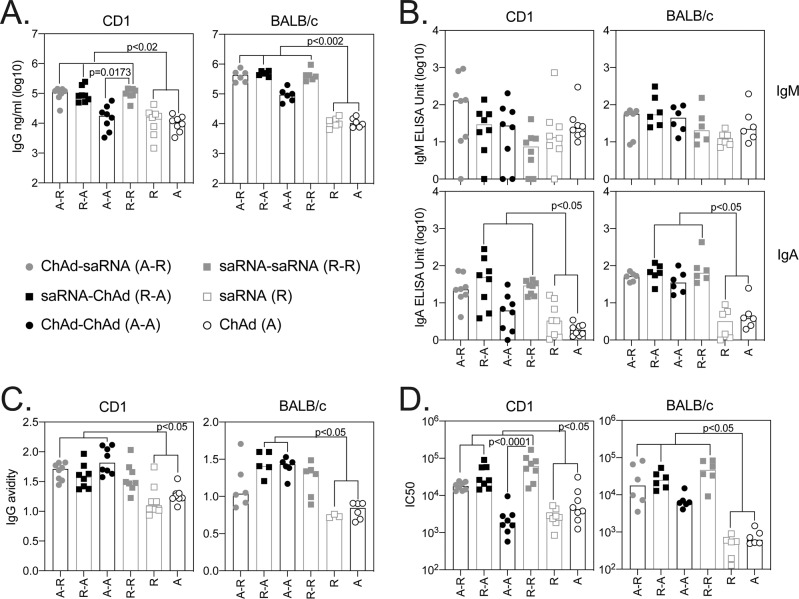
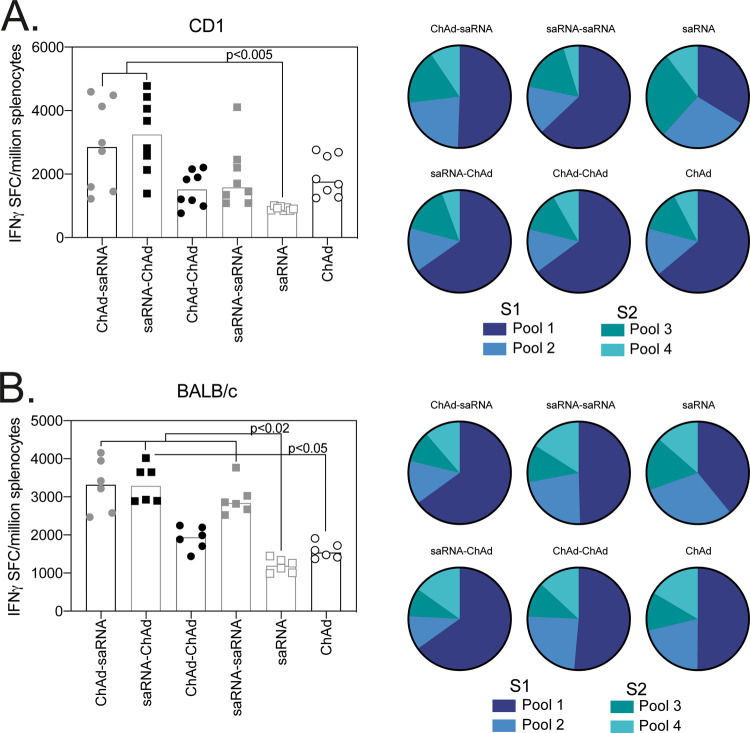
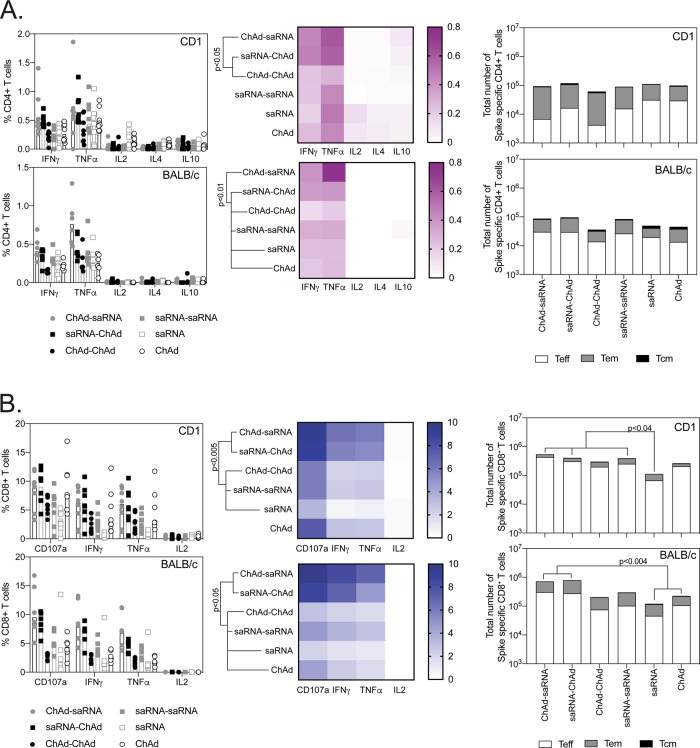
Abstract Several vaccines have demonstrated efficacy against SARS-CoV-2 mediated disease, yet there is limited data on the immune response induced by heterologous vaccination regimens using alternate vaccine modalities. Here, we present a detailed description of the immune response, in mice, following vaccination with a self-amplifying RNA (saRNA) vaccine and an adenoviral vectored vaccine (ChAdOx1 nCoV-19/AZD1222) against SARS-CoV-2. We demonstrate that antibody responses are higher in two-dose heterologous vaccination regimens than single-dose regimens. Neutralising titres after heterologous prime-boost were at least comparable or higher than the titres measured after homologous prime boost vaccination with viral vectors. Importantly, the cellular immune response after a heterologous regimen is dominated by cytotoxic T cells and Th1 + CD4 T cells, which is superior to the response induced in homologous vaccination regimens in mice. These results underpin the need for clinical trials to investigate the immunogenicity of heterologous regimens with alternate vaccine technologies.
Overview
The claims and statistics of this paper haven’t been checked yet.
Run the check — free, no account needed. It reads the open-access text and checks the sources it cites.
Integrity signals
Registry
Cites
Statistics
Figures
Verification
Claims the paper makes
The claims and statistics of this paper haven’t been checked yet.
Run the check — free, no account needed. It reads the open-access text and checks the sources it cites.
Self-check
Percentages, sums and reported differences re-computed from the paper’s own numbers.
The self-check needs the paper’s full text.
Citations
Cites
Voysey, M., Clemens, S. A. C., Madhi, S. A., Weckx, L. Y., Folegatti, P. M., Aley, P. K., Angus, B., Baillie, V. L., Barnabas, S. L., Bhorat, Q. E., et al. (2021) · The Lancet · doi:10.1016/s0140-6736(20)32661-1 · Cited by 4,616
Rydyznski Moderbacher, C., Ramirez, S. I., Dan, J. M., Grifoni, A., Hastie, K. M., Weiskopf, D., Belanger, S., Abbott, R. K., Kim, C., Choi, J., et al. (2020) · Cell · doi:10.1016/j.cell.2020.09.038 · Cited by 1,790
Ramasamy, M. N., Minassian, A. M., Ewer, K. J., Flaxman, A. L., Folegatti, P. M., Owens, D. R., Voysey, M., Aley, P. K., Angus, B., Babbage, G., et al. (2020) · The Lancet · doi:10.1016/s0140-6736(20)32466-1 · Cited by 1,324
ChAdOx1 nCoV-19 vaccine prevents SARS-CoV-2 pneumonia in rhesus macaques
van Doremalen, N., Lambe, T., Spencer, A., Belij-Rammerstorfer, S., Purushotham, J. N., Port, J. R., Avanzato, V. A., Bushmaker, T., Flaxman, A., Ulaszewska, M., et al. (2020) · Nature · doi:10.1038/s41586-020-2608-y · Cited by 914
Single-Shot Ad26 Vaccine Protects Against SARS-CoV-2 in Rhesus Macaques
Mercado, N. B., Zahn, R., Wegmann, F., Loos, C., Chandrashekar, A., Yu, J., Liu, J., Peter, L., McMahan, K., Tostanoski, L. H., et al. (2020) · Nature · doi:10.1038/s41586-020-2607-z · Cited by 789
Antibody-dependent enhancement and SARS-CoV-2 vaccines and therapies
Lee, W. S., Wheatley, A. K., Kent, S. J., & DeKosky, B. J. (2020) · Nature Microbiology · doi:10.1038/s41564-020-00789-5 · Cited by 676
Ewer, K., Barrett, J. R., Belij‐Rammerstorfer, S., Sharpe, H., Makinson, R., Morter, R., Flaxman, A. L., Wright, D., Bellamy, D. G., Bittaye, M., et al. (2020) · Nature Medicine · doi:10.1038/s41591-020-01194-5 · Cited by 587
Tseng, C.-T. K., Sbrana, E., Iwata‐Yoshikawa, N., Newman, P. C., Garron, T. M., Atmar, R. L., Peters, C. J., & Couch, R. B. (2012) · PLoS ONE · doi:10.1371/journal.pone.0035421 · Cited by 562
McKay, P. F., Hu, K., Blakney, A. K., Samnuan, K., Brown, J. C., Penn, R., Zhou, J., Bouton, C. R., Rogers, P., Polra, K., et al. (2020) · Nature Communications · doi:10.1038/s41467-020-17409-9 · Cited by 462
Antibody-dependent SARS coronavirus infection is mediated by antibodies against spike proteins
Wang, S., Tseng, S., Yen, C., Yang, J.-Y., Tsao, C.-H., Shen, C.-W., Chen, K.-H., Liu, F., Liu, W.-T., Chen, Y. A., et al. (2014) · Biochemical and Biophysical Research Communications · doi:10.1016/j.bbrc.2014.07.090 · Cited by 417
Cited by
Sorted by citations
Liu, X., Shaw, R. H., Stuart, A. S. V., Greenland, M., Aley, P. K., Andrews, N. J., Cameron, J. C., Charlton, S., Clutterbuck, E., Collins, A. M., et al. (2021) · The Lancet · doi:10.1016/s0140-6736(21)01694-9 · Cited by 480
Clemens, S. A. C., Weckx, L. Y., Clemens, R. L., Mendes, A. V. A., Souza, A. R., Silveira, M. B. V., da Guarda, S. N. F., de Nobrega, M. M., Pinto, M. I. D. M., Gonzalez, I. G. S., et al. (2022) · The Lancet · doi:10.1016/s0140-6736(22)00094-0 · Cited by 421
Borobia, A. M., Carcas, A. J., Pérez‐Olmeda, M., Castaño, L. A., Bertran, M. J., García‐Pérez, J., Campins, M., Portolés, A., González-Pérez, M., Morales, M. T. G., et al. (2021) · The Lancet · doi:10.1016/s0140-6736(21)01420-3 · Cited by 348
Hillus, D., Schwarz, T., Tober‐Lau, P., Vanshylla, K., Hastor, H., Thibeault, C., Jentzsch, S., Helbig, E. T., Lippert, L. J., Tscheak, P., et al. (2021) · The Lancet Respiratory Medicine · doi:10.1016/s2213-2600(21)00357-x · Cited by 336
Immunogenicity and reactogenicity of heterologous ChAdOx1 nCoV-19/mRNA vaccination
Schmidt, T., Klemis, V., Schub, D., Mihm, J., Hielscher, F., Marx, S., Abu‐Omar, A., Ziegler, L., Guckelmus, C., Urschel, R., et al. (2021) · Nature Medicine · doi:10.1038/s41591-021-01464-w · Cited by 340
COVID-19 mRNA vaccines: Platforms and current developments
Szabó, G. T., Mahiny, A. J., & Vlatkovic, I. (2022) · Molecular Therapy · doi:10.1016/j.ymthe.2022.02.016 · Cited by 308
Immunogenicity and efficacy of heterologous ChAdOx1–BNT162b2 vaccination
Pozzetto, B., Legros, V., Djebali, S., Barateau, V., Guibert, N., Villard, M., Peyrot, L., Allatif, O., Fassier, J., Massardier-Pilonchery, A., et al. (2021) · Nature · doi:10.1038/s41586-021-04120-y · Cited by 213
Lapuente, D., Fuchs, J., Willar, J., Antão, A. V., Eberlein, V., Uhlig, N., Issmail, L., Schmidt, A. P., Oltmanns, F., Peter, A. S., et al. (2021) · Nature Communications · doi:10.1038/s41467-021-27063-4 · Cited by 218
Fendler, A., Shepherd, S. T. C., Au, L., Wilkinson, K. A., Wu, M., Byrne, F., Cerrone, M., Schmitt, A. M., Joharatnam‐Hogan, N., Shum, B., et al. (2021) · Nature Cancer · doi:10.1038/s43018-021-00274-w · Cited by 172
Nanotechnology-based mRNA vaccines
Chen, S., Huang, X., Xue, Y., Álvarez‐Benedicto, E., Shi, Y., Chen, W., Koo, S., Siegwart, D. J., Dong, Y., & Tao, W. (2023) · Nature Reviews Methods Primers · doi:10.1038/s43586-023-00246-7 · Cited by 177
Does infection with or vaccination against SARS-CoV-2 lead to lasting immunity?
Milne, G., Hames, T., Scotton, C. J., Gent, N., Johnsen, A., Anderson, R. M., & Ward, T. (2021) · The Lancet Respiratory Medicine · doi:10.1016/s2213-2600(21)00407-0 · Cited by 123
Quality by Design for enabling RNA platform production processes
Daniel, S., Kis, Z., Kontoravdi, C., & Shah, N. (2022) · Trends in biotechnology · doi:10.1016/j.tibtech.2022.03.012 · Cited by 129
Immunogenicity and Reactogenicity of Vaccine Boosters after Ad26.COV2.S Priming
Sablerolles, R. S. G., Rietdijk, W. J. R., Goorhuis, A., Postma, D. F., Visser, L. G., Geers, D., Schmitz, K. S., Garrido, H. M. G., Koopmans, M., Dalm, V. A. S. H., et al. (2022) · New England Journal of Medicine · doi:10.1056/nejmoa2116747 · Cited by 127
Reindl‐Schwaighofer, R., Heinzel, A., Mayrdorfer, M., Jabbour, R., Hofbauer, T. M., Merrelaar, A. E., Eder, M., Regele, F., Doberer, K., Spechtl, P., et al. (2021) · JAMA Internal Medicine · doi:10.1001/jamainternmed.2021.7372 · Cited by 127
McCann, N. S., O’Connor, D., Lambe, T., & Pollard, A. J. (2022) · Current Opinion in Immunology · doi:10.1016/j.coi.2022.102210 · Cited by 128
To mix or not to mix? A rapid systematic review of heterologous prime–boost covid-19 vaccination
Chiu, N., Chi, H., Tu, Y., Huang, Y.-N., Tai, Y., Weng, S.-L., Chang, L., Huang, D. T., Huang, F.-Y., & Lin, C. (2021) · Expert Review of Vaccines · doi:10.1080/14760584.2021.1971522 · Cited by 117
COVID‐19 vaccines mix‐and‐match: The concept, the efficacy and the doubts
Rashedi, R., Samieefar, N., Masoumi, N., Mohseni, S., & Rezaei, N. (2021) · Journal of Medical Virology · doi:10.1002/jmv.27463 · Cited by 118
Montero, C. G., Fraile‐Μartinez, O., Bravo, C., Torres‐Carranza, D., Sánchez‐Trujillo, L., Gomez-Lahoz, A. M., Guijarro, L. G., García‐Honduvilla, N., Asúnsolo, Á., Buján, J., et al. (2021) · Vaccines · doi:10.3390/vaccines9050433 · Cited by 112
Animal models for COVID-19: advances, gaps and perspectives
Fan, C., Wu, Y., Xiong, R., Yang, Y., Ling, C., Liu, S., Liu, S., & Wang, Y. (2022) · Signal Transduction and Targeted Therapy · doi:10.1038/s41392-022-01087-8 · Cited by 110
Viral Vectors for COVID-19 Vaccine Development
Lundstrom, K. H. (2021) · Viruses · doi:10.3390/v13020317 · Cited by 94
Fendler, A., Au, L., Shepherd, S. T. C., Byrne, F., Cerrone, M., Boos, L. A., Rzeniewicz, K., Gordon, W., Shum, B., Gerard, C. L., et al. (2021) · Nature Cancer · doi:10.1038/s43018-021-00275-9 · Cited by 89
Self-Amplifying RNA Approach for Protein Replacement Therapy
Papukashvili, D., Rcheulishvili, N., Liu, C., Ji, Y., He, Y., & Wang, P. G. (2022) · International Journal of Molecular Sciences · doi:10.3390/ijms232112884 · Cited by 76
A ‘mix and match’ approach to SARS-CoV-2 vaccination
Deming, M. E., & Lyke, K. E. (2021) · Nature Medicine · doi:10.1038/s41591-021-01463-x · Cited by 71
COVID ‐19: vaccination problems
Brüssow, H. (2021) · Environmental Microbiology · doi:10.1111/1462-2920.15549 · Cited by 69
Humoral immune response after different SARS-CoV-2 vaccination regimens
Rose, R., Neumann, F., Grobe, O., Lorentz, T., Fickenscher, H., & Krumbholz, A. (2022) · BMC Medicine · doi:10.1186/s12916-021-02231-x · Cited by 62
Powell, A. A., Power, L., Westrop, S. J., McOwat, K., Campbell, H., Simmons, R., Ramsay, M. E., Brown, K. E., Ladhani, S. N., & Amirthalingam, G. (2021) · Eurosurveillance · doi:10.2807/1560-7917.es.2021.26.28.2100634 · Cited by 58
Rappaport, A., Hong, S., Scallan, C. D., Gitlin, L., Akoopie, A., Boucher, G. R., Egorova, M., Espinosa, J. A., Fidanza, M., Kachura, M. A., et al. (2022) · Nature Communications · doi:10.1038/s41467-022-31005-z · Cited by 57
Self-Amplifying RNA: A Second Revolution of mRNA Vaccines against COVID-19
Silva-Pilipich, N., Beloki, U., Salaberry, L., & Smerdou, C. (2024) · Vaccines · doi:10.3390/vaccines12030318 · Cited by 64
Cafferty, S. M., Haque, A. K. M. A., Vandierendonck, A., Weidensee, B., Plovyt, M., Stuchlíková, M., François, N., Valembois, S., Heyndríckx, L., Míchiels, J., et al. (2022) · Molecular Therapy · doi:10.1016/j.ymthe.2022.04.014 · Cited by 56
Acute Transverse Myelitis after COVID-19 Vaccination
Hsiao, Y.-T., Tsai, M., Chen, Y.-H., & Hsu, C.-F. (2021) · Medicina · doi:10.3390/medicina57101010 · Cited by 53
Khoo, N. K. H., Lim, J. M. E., Gill, U. S., de Alwis, R., Tan, N., Toh, J. Z. N., Abbott, J. E., Usai, C., Ooi, E. E., Low, J. G. H., et al. (2022) · Med · doi:10.1016/j.medj.2021.12.004 · Cited by 49
Meir, J., Abid, M. A., & Abid, M. B. (2021) · Transplantation and Cellular Therapy · doi:10.1016/j.jtct.2021.09.016 · Cited by 51
Efficacy of mRNA, adenoviral vector, and perfusion protein COVID-19 vaccines
Zinatizadeh, M. R., Zarandi, P. K., Zinatizadeh, M., Yousefi, M. H., Amani, J., & Rezaei, N. (2021) · Biomedicine & Pharmacotherapy · doi:10.1016/j.biopha.2021.112527 · Cited by 51
Mix-and-Match COVID-19 Vaccinations (Heterologous Boost): A Review
Garg, I., Sheikh, A. B., Pal, S., & Shekhar, R. (2022) · Infectious Disease Reports · doi:10.3390/idr14040057 · Cited by 47
Reactogenicity and immunogenicity of heterologous prime-boost immunization with COVID-19 vaccine
Nguyen, T. T., Quach, T. H. T., Tran, T. M., Phuoc, H. N., Nguyen, H. T., Vo, T. K., & Vo, G. V. (2022) · Biomedicine & Pharmacotherapy · doi:10.1016/j.biopha.2022.112650 · Cited by 41
Komori, M., Nogimori, T., Morey, A. L., Sekida, T., Ishimoto, K., Hassett, M. R., Masuta, Y., Ode, H., Tamura, T., Suzuki, R., et al. (2023) · Nature Communications · doi:10.1038/s41467-023-38457-x · Cited by 39
Bánki, Z., Mateus, J., Rössler, A., Schäfer, H., Bante, D., Riepler, L., Grifoni, A., Sette, A., Simon, V. R., Falkensammer, B., et al. (2022) · EBioMedicine · doi:10.1016/j.ebiom.2022.104073 · Cited by 34
Qin, Z., Bouteau, A., Herbst, C., & Igyártó, B. Z. (2022) · PLoS Pathogens · doi:10.1371/journal.ppat.1010830 · Cited by 51
DNA-Based Nonviral Gene Therapy─Challenging but Promising
Guan, X., Pei, Y., & Song, J. (2024) · Molecular Pharmaceutics · doi:10.1021/acs.molpharmaceut.3c00907 · Cited by 35
Heterologous vaccine regimens against COVID-19
Duarte‐Salles, T., & Prieto‐Alhambra, D. (2021) · The Lancet · doi:10.1016/s0140-6736(21)01442-2 · Cited by 33
Potential of Microneedle Systems for COVID-19 Vaccination: Current Trends and Challenges
Hassan, J., Haigh, C., Ahmed, T., Uddin, M. J., & Das, D. B. (2022) · Pharmaceutics · doi:10.3390/pharmaceutics14051066 · Cited by 36
Saunders, J. E., Gilbride, C., Dowall, S., Morris, S. J., Ulaszewska, M., Spencer, A. J., Rayner, E. L., Graham, V., Kennedy, E., Thomas, K. M., et al. (2023) · EBioMedicine · doi:10.1016/j.ebiom.2023.104523 · Cited by 33
Booster vaccination strategy: Necessity, immunization objectives, immunization strategy, and safety
Meng, H., Mao, J., & Ye, Q. (2022) · Journal of Medical Virology · doi:10.1002/jmv.27590 · Cited by 35
Doherty, J., Fennessy, S., Stack, R., Morain, N. O., Cullen, G. J., Ryan, E. J., Gascun, C. F. D., & Doherty, G. A. (2021) · Alimentary Pharmacology & Therapeutics · doi:10.1111/apt.16590 · Cited by 29
Spencer, A. J., Morris, S. J., Ulaszewska, M., Powers, C., Kailath, R., Bissett, C., Truby, A., Thakur, N., Newman, J., Allen, E. R., et al. (2022) · EBioMedicine · doi:10.1016/j.ebiom.2022.103902 · Cited by 31
The challenge of emerging SARS-CoV-2 mutants to vaccine development
Li, R., Liu, J., & Zhang, H. (2021) · Journal of genetics and genomics/Journal of Genetics and Genomics · doi:10.1016/j.jgg.2021.03.001 · Cited by 25
SARS-CoV-2 immunity and vaccine strategies in people with HIV
Mullender, C., da Costa, K., Alrubayyi, A., Pett, S. L., & Peppa, D. (2022) · Oxford Open Immunology · doi:10.1093/oxfimm/iqac005 · Cited by 23
D’Amelio, R., Asero, R., Cassatella, M. A., Laganà, B., Lunardi, C., Migliorini, P., Nisini, R., Parronchi, P., Quinti, I., Racanelli, V., et al. (2021) · Biomedicines · doi:10.3390/biomedicines9091163 · Cited by 22
Hollstein, M. M., Münsterkötter, L., Schön, M. P., Bergmann, A., Husar, T. M., Abratis, A., Eidizadeh, A., Schaffrinski, M., Zachmann, K., Schmitz, Ä., et al. (2022) · Allergy · doi:10.1111/all.15247 · Cited by 21
The importance of booster vaccination in the context of Omicron wave
Wei, Z., He, J., Wang, C., Bao, J., Leng, T., & Chen, F. (2022) · Frontiers in Immunology · doi:10.3389/fimmu.2022.977972 · Cited by 23
Gómez, C. E., Perdiguero, B., Usero, L., Marcos-Villar, L., Miralles, L., Leal, L., Sorzano, C. Ó. S., Sánchez-Corzo, C., Plana, M., García, F., et al. (2021) · Vaccines · doi:10.3390/vaccines9090959 · Cited by 21
The Effect of the COVID-19 Vaccine on Daily Cases and Deaths Based on Global Vaccine Data
Li, Z., Liu, X., Liu, M., Wu, Z., Liu, Y., Li, W., Liu, M., Wang, X., Gao, B., Luo, Y., et al. (2021) · Vaccines · doi:10.3390/vaccines9111328 · Cited by 20
Elliott, T., Cheeseman, H. M., Evans, A. B., Day, S., McFarlane, L. R., O’Hara, J., Kalyan, M., Amini, F., Cole, T., Winston, A., et al. (2022) · PLoS Pathogens · doi:10.1371/journal.ppat.1010885 · Cited by 21
Keikha, R., Hashemi-Shahri, S. M., & Jebali, A. (2021) · Scientific Reports · doi:10.1038/s41598-021-00830-5 · Cited by 19
Casmil, I. C., Bathula, N. V., Huang, C., Wayne, C. J., Cairns, E. S., Friesen, J. J., Soriano, S. K. V., Liao, S., Ho, C., Kong, K. Y. S., et al. (2024) · Molecular Therapy · doi:10.1016/j.ymthe.2024.12.055 · Cited by 18
In the era of rapid mRNA-based vaccines: Why is there no effective hepatitis C virus vaccine yet?
Echeverría, N., Comas, V., Aldunate, F., Perbolianachis, P., Moreno, P., & Cristina, J. (2021) · World Journal of Hepatology · doi:10.4254/wjh.v13.i10.1234 · Cited by 22
Cai, S., Liao, G., Yu, T., Gao, Q., Zou, L., Zhang, H., Xu, X., Chen, J., Lu, A., Wu, Y., et al. (2022) · Journal of Medical Virology · doi:10.1002/jmv.27872 · Cited by 18
Fiorino, F., Ciabattini, A., Sicuranza, A., Pastore, G., Santoni, A., Simoncelli, M., Polvere, J., Galimberti, S., Baratè, C., Sammartano, V., et al. (2022) · Frontiers in Immunology · doi:10.3389/fimmu.2022.1017863 · Cited by 18
Reinke, S., Pantazi, E. D., Chappell, G. R., Sánchez-Martínez, A., Guyon, R., Fergusson, J. R., Salman, A. M., Aktar, A., Mukhopadhyay, E. S., Ventura, R., et al. (2023) · Cell Reports Medicine · doi:10.1016/j.xcrm.2023.101245 · Cited by 18
Marcellus, Voss, C. J. D., Li, S., Richard, A., Almujri, S. S., Ateere, A., Frank, G., Lemoine, C., McShane, H., & Stylianou, E. (2025) · Scientific Reports · doi:10.1038/s41598-024-84667-8 · Cited by 17
Sales-Moioli, A. I. L., Galvão-Lima, L. J., Pinto, T. K. B., Cardoso, P. H., Silva, R. D., Fernandes, F. R. D. S., Barbalho, I. M. P., Farias, F. L. D. O., Veras, N. V. R., Souza, G. F. D. A., et al. (2022) · International Journal of Environmental Research and Public Health · doi:10.3390/ijerph192113902 · Cited by 17
Utrilla-Trigo, S., Jiménez-Cabello, L., Calvo-Pinilla, E., Marín-López, A., Lorenzo, G., Sánchez-Cordón, P., Moreno, S., Benavides, J., Gilbert, S., Nogales, A., et al. (2021) · Journal of Virology · doi:10.1128/jvi.01614-21 · Cited by 19
Rice, A., Verma, M., Voigt, E. A., Battisti, P., Beaver, S., Reed, S., Dinkins, K., Mody, S., Zakin, L., Tanaka, S., et al. (2022) · Frontiers in Immunology · doi:10.3389/fimmu.2022.910136 · Cited by 15
Utrilla-Trigo, S., Jiménez-Cabello, L., Calvo-Pinilla, E., Marín-López, A., Lorenzo, G., Sánchez-Cordón, P. J., Moreno, S., Benavides, J., Gilbert, S. C., Nogales, A., et al. (2022) · DIGITAL.CSIC (Spanish National Research Council (CSIC)) · Cited by 15
Agrati, C., Capone, S., Castilletti, C., Cimini, E., Matusali, G., Meschi, S., Tartaglia, E., Camerini, R., Lanini, S., Milleri, S., et al. (2021) · npj Vaccines · doi:10.1038/s41541-021-00394-5 · Cited by 15
Mohammadi, G., Koranni, Z. S., & Jebali, A. (2021) · International Immunopharmacology · doi:10.1016/j.intimp.2021.108231 · Cited by 15
Qin, Z., Bouteau, A., Herbst, C., & Igyártó, B. Z. (2022) · bioRxiv (Cold Spring Harbor Laboratory) · doi:10.1101/2022.03.16.484616 · Cited by 15
Farahmand, B., Larijani, M. S., Fotouhi, F., Biglari, A., Sorouri, R., Amiri, F. B., Eslamifar, A., Jalali, T., Salehi-Vaziri, ., Banifazl, M., et al. (2023) · Heliyon · doi:10.1016/j.heliyon.2023.e20555 · Cited by 14
Debie, Y., Audenaerde, J. R. M. V., Vandamme, T., Croes, L., Teuwen, L.-A. M. N., Verbruggen, L., Vanhoutte, G., Marcq, E., Verheggen, L., Blon, D. L., et al. (2022) · Clinical Cancer Research · doi:10.1158/1078-0432.ccr-22-2185 · Cited by 14
Sablerolles, R. S. G., Goorhuis, A., GeurtsvanKessel, C. H., de Vries, R. D., Huckriede, A. L. W., Koopmans, M., Lafeber, M., Postma, D. F., van Baarle, D., Visser, L. G., et al. (2021) · Frontiers in Immunology · doi:10.3389/fimmu.2021.753319 · Cited by 12
Warkentin, L., Zeschick, N., Kühlein, T., Steininger, P. A., Überla, K., Kaiser, I., Gall, C. M., Sebastião, M., & Hueber, S. (2021) · BMC Infectious Diseases · doi:10.1186/s12879-022-07443-x · Cited by 13
Heinzel, A., Schrezenmeier, E. V., Regele, F., Hu, K., Raab, L., Eder, M., Aigner, C., Jabbour, R., Aschauer, C., Stefanski, A., et al. (2022) · Frontiers in Medicine · doi:10.3389/fmed.2022.936126 · Cited by 13
Nikoubin, A., Mahnam, M., & Moslehi, G. (2022) · Applied Soft Computing · doi:10.1016/j.asoc.2022.109862 · Cited by 13
Tavares, A. C. F. M. G., de Melo, A. K. G., Cruz, V. A., de Souza, V. A., de Carvalho, J. S., Machado, K. L. L. L., Valadares, L. D. D. A., Neto, E. T. D. R., de Rezende, R. P. V., Guimarães, M. F. B. D. R., et al. (2022) · Revista Brasileira de Reumatologia · doi:10.1186/s42358-022-00234-7 · Cited by 13
Andersson, N. W., Thiesson, E. M., Laursen, M. V., Mogensen, S. H., Kjær, J., & Hviid, A. P. (2022) · BMJ · doi:10.1136/bmj-2022-070483 · Cited by 12
Chu, C., Schönbrunn, A., Fischer, D., Liu, Y., Hocher, J.-G., Weinerth, J., Klemm, K., von Baehr, V., Krämer, B. K., Elitok, S., et al. (2023) · Frontiers in Immunology · doi:10.3389/fimmu.2023.1187880 · Cited by 13
Kant, R., Dwivedi, G. R., Zaman, K., Sahay, R. R., Sapkal, G. N., Kaushal, H., Nyayanit, D. A., Yadav, P. D., Deshpande, G. R., Singh, R., et al. (2021) · medRxiv · doi:10.1101/2021.08.06.21261716 · Cited by 12
Song, Y., Wang, J., Yang, Z., He, Q., Bao, C., Xie, Y., Sun, Y., Li, S., Quan, Y., Yang, H., et al. (2024) · Frontiers in Immunology · doi:10.3389/fimmu.2024.1406138 · Cited by 11
Marcos-Villar, L., Perdiguero, B., López‐Bravo, M., Zamora, C., Sin, L., Álvarez, E., Sorzano, C. Ó. S., Sánchez-Cordón, P. J., Casasnovas, J. M., Astorgano, D., et al. (2024) · Emerging Microbes & Infections · doi:10.1080/22221751.2024.2387906 · Cited by 11
Manzoni, T. B., Westover, J. B., Lundgreen, K. A., Hicks, P. D., Petch, R. J., Ort, J. T., Weissman, D., Fan, S. H. Y., Hensley, S. E., Pardi, N., et al. (2025) · Viruses · doi:10.3390/v17081095 · Cited by 11
COVID-19 vaccination challenges: A mini-review
Afshar, Z. M., Barary, M., Hosseinzadeh, R., Karim, B., Ebrahimpour, S., Nazary, K., Sio, T. T. W., Sullman, M. J. M., Carson‐Chahhoud, K., Moudi, E., et al. (2022) · Human Vaccines & Immunotherapeutics · doi:10.1080/21645515.2022.2066425 · Cited by 14
Designing an integrated sustainable-resilient mix-and-match vaccine supply chain network
Jahed, A., Molana, S. M. H., Tavakkoli-Moghaddam, R. R., & Valizadeh, V. (2024) · Annals of Operations Research · doi:10.1007/s10479-024-06211-1 · Cited by 12
Jahed, A., Molana, S. M. H., & Tavakkoli-Moghaddam, R. R. (2024) · Socio-Economic Planning Sciences · doi:10.1016/j.seps.2024.102113 · Cited by 10
Tabll, A. A., Sohrab, S. S., Ali, A. A., Petrovic, A., Srdarević, S. S., Siber, S., Glasnović, M., Smolić, R., & Smolić, M. (2023) · Pathogens · doi:10.3390/pathogens13010038 · Cited by 10
Bauswein, M., Peterhoff, D., Plentz, A., Hiergeist, A., Wagner, R., Gessner, A., Salzberger, B., Schmidt, B., & Bauernfeind, S. (2022) · iScience · doi:10.1016/j.isci.2021.103694 · Cited by 9
Balasubramaniyam, A., Ryan, E. C., Brown, D. R., Hamza, T., Harrison, W., Gan, M., Sankhala, R. S., Chen, W., Martinez, E. J., Jensen, J. L., et al. (2022) · Vaccines · doi:10.3390/vaccines11010042 · Cited by 9
Gerhards, C., Thiaucourt, M., Hetjens, M., Haselmann, V., Neumaier, M., & Kittel, M. (2023) · Vaccines · doi:10.3390/vaccines11030701 · Cited by 10
Barocci, S., Orlandi, C., Diotallevi, A., Buffi, G., Ceccarelli, M., Vandini, D., Carlotti, E., Galluzzi, L., Rocchi, M., Magnani, M., et al. (2022) · Vaccines · doi:10.3390/vaccines10040491 · Cited by 8
Applications of self-replicating RNA
Lundstrom, K. H. (2022) · International review of cytology · doi:10.1016/bs.ircmb.2022.03.006 · Cited by 7
Vargas‐Herrera, N., Fernández-Navarro, M., Cabezudo, N. E., Soto-Becerra, P., Solis, G., Escobar-Agreda, S., Valencia, J. S., Pampa-Espinoza, L., Bado, R., Solari, L., et al. (2022) · PLoS ONE · doi:10.1371/journal.pone.0268419 · Cited by 8
Narongkiatikhun, P., Noppakun, K., Chaiwarith, R., Winichakoon, P., Vongsanim, S., Suteeka, Y., Pongsuwan, K., Kusirisin, P., Wongsarikan, N., Fanhchaksai, K., et al. (2023) · Vaccines · doi:10.3390/vaccines11040715 · Cited by 7
Heterologous ChAdOx1-nCoV19–BNT162b2 vaccination provides superior immunogenicity against COVID-19
Richardson, C. D. (2021) · The Lancet Respiratory Medicine · doi:10.1016/s2213-2600(21)00366-0 · Cited by 7
Romero-Ibarguengoitia, M. E., González‐Cantú, A., Hernández-Ruíz, Y. G., Armendariz-Vázquez, A. G., Rivera-Salinas, D., Montelongo-Cruz, L. P., Rio-Parra, G. F. D., Barco-Flores, I. A., González-Facio, R., & Sanz‐Sánchez, M. Á. (2022) · Vaccines · doi:10.3390/vaccines10030392 · Cited by 5
Rose, R., Neumann, F., Grobe, O., Lorentz, T., Fickenscher, H., & Krumbholz, A. (2021) · medRxiv · doi:10.1101/2021.07.09.21260251 · Cited by 5
Wongnak, R., Brindha, S., Oba, M., Yoshizue, T., Islam, M. D., Islam, M. M., Takemae, H., Mizutani, T., & Kuroda, Y. (2024) · Molecules · doi:10.3390/molecules29112676 · Cited by 4
Kim, D. K., Jung, S. W., Moon, J., Jeong, K. H., Hwang, H. S., Kim, J. S., Lee, S. H., Kang, S.-Y., & Kim, Y. (2022) · Frontiers in Immunology · doi:10.3389/fimmu.2022.894700 · Cited by 4
The fast-track development of COVID-19 vaccines
El‐Maradny, Y. A., Ramadan, A. A., Chavda, V. P., Balar, P. C., & Redwan, E. M. M. M. (2024) · Elsevier eBooks · doi:10.1016/b978-0-443-18564-9.00027-8 · Cited by 5
Cai, S., Liao, G., Yu, T., Gao, Q., Zou, L., Zhang, H., Xu, X., Chen, J., Lu, A., Wu, Y., et al. (2021) · SSRN Electronic Journal · doi:10.2139/ssrn.3912536 · Cited by 4
Clemens, S. A. C., Weckx, L. Y., Clemens, R. L., Mendes, A. V. A., Souza, A. R., Silveira, M. V., da Guarda, S. N. F., de Nobrega, M. M., Pinto, M. I. D. M., Gonzalez, I. G. S., et al. (2021) · SSRN Electronic Journal · doi:10.2139/ssrn.3989848 · Cited by 4
Reguzova, A., Haug, V., Müller, M., Fandrich, M., Dulovic, A., & Amann, R. (2025) · Frontiers in Immunology · doi:10.3389/fimmu.2025.1715442 · Cited by 3
Metadata
- Authors
- Spencer, A. J., McKay, P. F., Belij-Rammerstorfer, S., Ulaszewska, M., Bissett, C. D., Hu, K., Samnuan, K., Blakney, A. K., Wright, D., Sharpe, H. R., Gilbride, C., Truby, A., Allen, E. R., Gilbert, S. C., Shattock, R. J., & Lambe, T.
- Affiliations
- University of Oxford (GB)
- Imperial College London (GB)
- Corresponding author
- Spencer, Alexandra J.
- ORCID
- Venue
- Nature Communications
- Published
- 2021-05-17
- Volume
- 12
- Issue
- 1
- Pages
- 2893-2893
- ISSN
- 2041-1723 (ISSN-L)
- PMC
- PMC8129084
- OpenAlex
- W3160352759
- Cited by
- 125
- References
- 22
- Citations by year
- 2026: 3 · 2025: 6 · 2024: 14 · 2023: 16 · 2022: 44 · 2021: 42
- FWCI
- 9.19
- Type
- journal article
- Language
- en
- Open access
- gold
- doi.org
- Locations
- Nature Communications (publishedVersion, cc-by)
- PubMed Central (publishedVersion, cc-by)
- PubMed (publishedVersion)
- DOAJ (DOAJ: Directory of Open Access Journals) (submittedVersion, cc-by-sa)
- Spiral (Imperial College London) (submittedVersion, cc-by)
- Funders
- UK Research and Innovation (MC_PC_19055)
- National Institute for Health and Care Research (COV19 OxfordVacc-01, COVID-19, OxfordVacc-01, COV19OxfordVaccine01, MC_PC_19055)
- University of Oxford
- Topics
- Health Sciences › Medicine › Infectious Diseases › SARS-CoV-2 and COVID-19 Research
- Life Sciences › Immunology and Microbiology › Immunology › Immune responses and vaccinations
- Life Sciences › Agricultural and Biological Sciences › Animal Science and Zoology › Animal Virus Infections Studies
- Keywords
- heterologous vaccination, self-amplifying RNA vaccine, adenovirus vector vaccine, SARS-CoV-2, COVID-19 vaccines, prime-boost vaccination, antibody response, neutralizing antibodies, cell-mediated immunity, cytotoxic T lymphocytes, Th1 cells, immunogenicity
- MeSH terms
- Immunogenicity, Vaccine, COVID-19, SARS-CoV-2, COVID-19 Vaccines, ChAdOx1 nCoV-19, Animals, Antibodies, Viral, Immunization, Secondary, RNA, Viral, T-Lymphocytes, Cytotoxic, Vaccination, Vaccines, Synthetic, Th1 Cells, Mice, Antibodies, Neutralizing, Spike Glycoprotein, Coronavirus
About these checks
Registry, retraction, Cites and statistics results are computed, not judged, with one exception: a printed reference that no index lists is read once by a model before it counts as a citation error. Claims are extracted by a model and kept only when their quote appears verbatim in the text; each cited source is then checked, with a model’s help, for whether it says what the claim relies on. Those verdicts can be wrong — read the claim’s quote and the cited source before relying on one.
Statistics and arithmetic are recomputed, not judged.
Confidence bands are shown only for fields calibrated on our annotated test set. None is calibrated yet, so no band is shown.
What counts as a claim ›How we measure confidence ›How we check this ›
Are you an author, or do you see a problem with this page? Request a review
