CoChat

Object representations in the human brain reflect the co-occurrence statistics of vision and language

Open access
Bonner, Michael F., Epstein, Russell A. · 2021 · Nature Communications

Published version of a preprint

The DOI matches its Crossref record; 76 of the 76 references it cites were found in a registry or an index.

Abstract

A central regularity of visual perception is the co-occurrence of objects in the natural environment. Here we use machine learning and fMRI to test the hypothesis that object co-occurrence statistics are encoded in the human visual system and elicited by the perception of individual objects. We identified low-dimensional representations that capture the latent statistical structure of object co-occurrence in real-world scenes, and we mapped these statistical representations onto voxel-wise fMRI responses during object viewing. We found that cortical responses to single objects were predicted by the statistical ensembles in which they typically occur, and that this link between objects and their visual contexts was made most strongly in parahippocampal cortex, overlapping with the anterior portion of scene-selective parahippocampal place area. In contrast, a language-based statistical model of the co-occurrence of object names in written text predicted responses in neighboring regions of object-selective visual cortex. Together, these findings show that the sensory coding of objects in the human brain reflects the latent statistics of object context in visual and linguistic experience.

Overview

The claims and statistics of this paper haven’t been checked yet.

Free: it reads the open-access text and checks the first 5 claims that cite a source we can check. Create a free account to check every claim.

A few free checks a day · papers already verified open instantly · results are public

Integrity signals

Registry

Crossref · 10.1038/s41467-021-24368-2

Cites

76 of 76 references verified0 citation errors · 0 not checkable

Statistics

Figures

Fig. 1 Statistical model of visual object context. A Object context was modeled using the ADE20K data set27, which contains 22,210 images in which every pixel is associated with an object label provided by an expert human annotator. An adaptation of the word2vec machine-learning algorithm for distributional semantics—which we call object2vec—was applied to this corpus of image annotations to model the statistical regularities of object-label co-occurrence in a large sample of real-world scenes. Using this approach, we generated a set of 8-dimensional object2vec representations for the object labels in the ADE20K data set. These representations capture the co-occurrence statistics of objects in the visual environment, such that objects that occur in similar scene contexts will have similar object2vec representations. B The panel on the left shows a two-dimensional visualization of the object2vec representations for the 81 object categories in the fMRI experiment. This visualization shows that the object2vec representations contain information about the scene contexts in which objects are typically encountered (e.g., indoor vs. outdoor, urban vs. natural, kitchen vs. office). The panel on the right shows a similar plot for the language-based word2vec representations of the same object categories. These plots were created using t-distributed stochastic neighbor embedding (tSNE). The colors reflect cluster assignments from k-means clustering and are included for illustration purposes only. K-means clustering was performed on the tSNE embeddings for object2vec, and the same cluster assignments were applied to the word2vec embeddings in the right panel for comparison. Source data are provided as a Source Data file.
Fig. 1 Statistical model of visual object context. A Object context was modeled using the ADE20K data set27, which contains 22,210 images in which every pixel is associated with an object label provided by an expert human annotator. An adaptation of the word2vec machine-learning algorithm for distributional semantics—which we call object2vec—was applied to this corpus of image annotations to model the statistical regularities of object-label co-occurrence in a large sample of real-world scenes. Using this approach, we generated a set of 8-dimensional object2vec representations for the object labels in the ADE20K data set. These representations capture the co-occurrence statistics of objects in the visual environment, such that objects that occur in similar scene contexts will have similar object2vec representations. B The panel on the left shows a two-dimensional visualization of the object2vec representations for the 81 object categories in the fMRI experiment. This visualization shows that the object2vec representations contain information about the scene contexts in which objects are typically encountered (e.g., indoor vs. outdoor, urban vs. natural, kitchen vs. office). The panel on the right shows a similar plot for the language-based word2vec representations of the same object categories. These plots were created using t-distributed stochastic neighbor embedding (tSNE). The colors reflect cluster assignments from k-means clustering and are included for illustration purposes only. K-means clustering was performed on the tSNE embeddings for object2vec, and the same cluster assignments were applied to the word2vec embeddings in the right panel for comparison. Source data are provided as a Source Data file.CC BY · PubMed Central
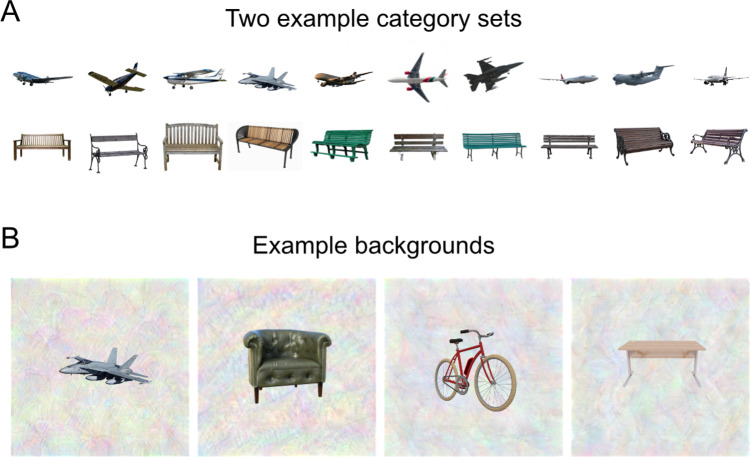
Fig. 2 Experimental stimuli. A In an fMRI experiment, subjects viewed images of isolated objects from 81 different categories. There were 10 unique tokens for each category (for a total of 810 unique stimuli). This panel shows 10 illustrative stimuli for two categories. B In the fMRI scanner, images were presented on complex, textured backgrounds to reduce the saliency of low-level features related to object shape and size. This panel shows four illustrative stimuli on textured backgrounds. All stimuli in this figure are shown for illustration purposes using images that we have the license to publish. They closely resemble the actual stimuli used in the fMRI experiment. Airplane image THY 9983 Nevit transparent by Nevit Dilmen is licensed under CC BY-SA 3.0.
Fig. 2 Experimental stimuli. A In an fMRI experiment, subjects viewed images of isolated objects from 81 different categories. There were 10 unique tokens for each category (for a total of 810 unique stimuli). This panel shows 10 illustrative stimuli for two categories. B In the fMRI scanner, images were presented on complex, textured backgrounds to reduce the saliency of low-level features related to object shape and size. This panel shows four illustrative stimuli on textured backgrounds. All stimuli in this figure are shown for illustration purposes using images that we have the license to publish. They closely resemble the actual stimuli used in the fMRI experiment. Airplane image THY 9983 Nevit transparent by Nevit Dilmen is licensed under CC BY-SA 3.0.CC BY · PubMed Central
Fig. 3 Encoding model of visual object context. Voxel-wise encoding models were used to assess whether our statistical model of visual object context (object2vec) could reliably explain variance in the fMRI responses to the experimental object categories. Linear regression was used to map the representations of object2vec onto fMRI responses. We assessed the out-of-sample prediction accuracy of these regression models through a 9-fold cross-validation procedure. Each fold of the cross-validation design contains a set of object categories that do not appear in any other fold. These folds were shown in separate fMRI runs. Parameters for the voxel-wise linear regression models were estimated using the fMRI data for 8 folds of the object categories and the learned regression weights were then applied to the held-out object categories in the remaining fold to generate a set of predicted fMRI responses. This procedure was repeated for each fold of the cross-validation design, and the predicted fMRI responses from each fold were concatenated together. Prediction accuracy was assessed by calculating the voxel-wise correlations of the predicted and actual fMRI responses across all object categories.
Fig. 3 Encoding model of visual object context. Voxel-wise encoding models were used to assess whether our statistical model of visual object context (object2vec) could reliably explain variance in the fMRI responses to the experimental object categories. Linear regression was used to map the representations of object2vec onto fMRI responses. We assessed the out-of-sample prediction accuracy of these regression models through a 9-fold cross-validation procedure. Each fold of the cross-validation design contains a set of object categories that do not appear in any other fold. These folds were shown in separate fMRI runs. Parameters for the voxel-wise linear regression models were estimated using the fMRI data for 8 folds of the object categories and the learned regression weights were then applied to the held-out object categories in the remaining fold to generate a set of predicted fMRI responses. This procedure was repeated for each fold of the cross-validation design, and the predicted fMRI responses from each fold were concatenated together. Prediction accuracy was assessed by calculating the voxel-wise correlations of the predicted and actual fMRI responses across all object categories.CC BY · PubMed Central
Fig. 4 Encoding models of visual and linguistic context predict fMRI responses to objects in PPA. This plot shows the average prediction accuracies for encoding models in voxels from the anterior third and posterior third of the PPA using either image-based object2vec representations as regressors or language-based word2vec representations. The violin plots show the mean prediction accuracies (central black dots) and bootstrap standard deviations. The gray lines above each violin plot indicate the average voxel-wise split-half reliability of the fMRI responses in each ROI. Prediction accuracies for both models were above chance, but the highest accuracy was observed for object2vec in the anterior PPA. The image on the left shows the PPA parcel on a ventral view of a cortical surface rendering. PPA parahippocampal place area. **p < 0.01, ***p < 0.001, uncorrected, one-sided permutation test. Exact p-values for object2vec: anterior PPA p-value = 2.0e−04; posterior PPA p-value = 2.4e−03. Exact p-values for word2vec: anterior PPA p-value = 4.0e−04; posterior PPA p-value = 2.0e−04. Source data are provided as a Source Data file.
Fig. 4 Encoding models of visual and linguistic context predict fMRI responses to objects in PPA. This plot shows the average prediction accuracies for encoding models in voxels from the anterior third and posterior third of the PPA using either image-based object2vec representations as regressors or language-based word2vec representations. The violin plots show the mean prediction accuracies (central black dots) and bootstrap standard deviations. The gray lines above each violin plot indicate the average voxel-wise split-half reliability of the fMRI responses in each ROI. Prediction accuracies for both models were above chance, but the highest accuracy was observed for object2vec in the anterior PPA. The image on the left shows the PPA parcel on a ventral view of a cortical surface rendering. PPA parahippocampal place area. **p < 0.01, ***p < 0.001, uncorrected, one-sided permutation test. Exact p-values for object2vec: anterior PPA p-value = 2.0e−04; posterior PPA p-value = 2.4e−03. Exact p-values for word2vec: anterior PPA p-value = 4.0e−04; posterior PPA p-value = 2.0e−04. Source data are provided as a Source Data file.CC BY · PubMed Central
Fig. 5 Encoding models of visual and linguistic context predict fMRI responses to objects in functionally defined ROIs. This plot shows the average prediction accuracies for encoding models in voxels from multiple regions of interest using either image-based object2vec representations as regressors or language-based word2vec representations. Object-selective ROIs are plotted in orange and scene-selective ROIs are plotted in cyan. The violin plots show the mean prediction accuracies (central black dots) and bootstrap standard deviations. The gray lines above each violin plot indicate the average voxel-wise split-half reliability of the fMRI responses in each ROI. The highest prediction accuracy for object2vec was in the PPA, whereas the highest prediction accuracy for word2vec was in LO and pFS. EVC early visual cortex, LO lateral occipital, pFs posterior fusiform, OPA occipital place area, PPA parahippocampal place area, RSComp retrosplenial complex. **p < 0.01, ***p < 0.001, uncorrected, one-sided permutation test. Exact p-values for object2vec: EVC p-value = 3.8e−01; LO p-value = 4.0e−01; pFs p-value = 8.0e−04; OPA p-value = 4.0e-04; PPA p-value = 2.0e−04; RSComp p-value = 2.0e−04. Exact p-values for word2vec: EVC p-value = 2.4e−03; LO p-value = 2.0e−04; pFs p-value = 2.0e−04; OPA p-value = 2.0e−04; PPA p-value = 4.0e−04; RSComp p-value = 2.0e−04. Source data are provided as a Source Data file.
Fig. 5 Encoding models of visual and linguistic context predict fMRI responses to objects in functionally defined ROIs. This plot shows the average prediction accuracies for encoding models in voxels from multiple regions of interest using either image-based object2vec representations as regressors or language-based word2vec representations. Object-selective ROIs are plotted in orange and scene-selective ROIs are plotted in cyan. The violin plots show the mean prediction accuracies (central black dots) and bootstrap standard deviations. The gray lines above each violin plot indicate the average voxel-wise split-half reliability of the fMRI responses in each ROI. The highest prediction accuracy for object2vec was in the PPA, whereas the highest prediction accuracy for word2vec was in LO and pFS. EVC early visual cortex, LO lateral occipital, pFs posterior fusiform, OPA occipital place area, PPA parahippocampal place area, RSComp retrosplenial complex. **p < 0.01, ***p < 0.001, uncorrected, one-sided permutation test. Exact p-values for object2vec: EVC p-value = 3.8e−01; LO p-value = 4.0e−01; pFs p-value = 8.0e−04; OPA p-value = 4.0e-04; PPA p-value = 2.0e−04; RSComp p-value = 2.0e−04. Exact p-values for word2vec: EVC p-value = 2.4e−03; LO p-value = 2.0e−04; pFs p-value = 2.0e−04; OPA p-value = 2.0e−04; PPA p-value = 4.0e−04; RSComp p-value = 2.0e−04. Source data are provided as a Source Data file.CC BY · PubMed Central
Fig. 6 Encoding models of visual and linguistic context predict fMRI responses in distinct but overlapping regions of high-level visual cortex. Voxel-wise encoding models were estimated and assessed using the 9-fold cross-validation procedure described in Fig. 3. These analyses were performed for all voxels with split-half reliability scores greater than or equal to r = 0.1841, which corresponds to a one-sided, uncorrected p-value of 0.05 (see split-half reliability mask in Supplementary Fig. 8). Encoding model accuracy scores are plotted for voxels that show significant effects (p < 0.05, FDR-corrected, one-sided permutation test). The left panel shows prediction accuracy for the image-based object2vec encoding model, and the right panel shows prediction accuracy for the language-based word2vec encoding model. There is a cluster of high prediction accuracy for the object2vec model overlapping with the anterior portion of the PPA, mostly in the right hemisphere. There are also several other smaller clusters of significant prediction accuracy throughout high-level visual cortex, including clusters in the OPA and RSComp. The word2vec model produced a cluster of high prediction accuracy that partially overlapped with the significant voxels for the object2vec model in the right PPA but extended into a more lateral portion of ventral temporal cortex as well as the lateral occipital cortex. ROI parcels are shown for scene-selective ROIs. PPA parahippocampal place area, OPA occipital place area, RSComp retrosplenial complex.
Fig. 6 Encoding models of visual and linguistic context predict fMRI responses in distinct but overlapping regions of high-level visual cortex. Voxel-wise encoding models were estimated and assessed using the 9-fold cross-validation procedure described in Fig. 3. These analyses were performed for all voxels with split-half reliability scores greater than or equal to r = 0.1841, which corresponds to a one-sided, uncorrected p-value of 0.05 (see split-half reliability mask in Supplementary Fig. 8). Encoding model accuracy scores are plotted for voxels that show significant effects (p < 0.05, FDR-corrected, one-sided permutation test). The left panel shows prediction accuracy for the image-based object2vec encoding model, and the right panel shows prediction accuracy for the language-based word2vec encoding model. There is a cluster of high prediction accuracy for the object2vec model overlapping with the anterior portion of the PPA, mostly in the right hemisphere. There are also several other smaller clusters of significant prediction accuracy throughout high-level visual cortex, including clusters in the OPA and RSComp. The word2vec model produced a cluster of high prediction accuracy that partially overlapped with the significant voxels for the object2vec model in the right PPA but extended into a more lateral portion of ventral temporal cortex as well as the lateral occipital cortex. ROI parcels are shown for scene-selective ROIs. PPA parahippocampal place area, OPA occipital place area, RSComp retrosplenial complex.CC BY · PubMed Central
Fig. 7 Whole-brain voxel-wise preference map for visual vs. linguistic context and relationship to category selectivity. A This preference map shows differences in model performance for the object2vec (visual context) encoding model and the word2vec (linguistic context) encoding model. Voxel-wise difference scores were calculated by subtracting prediction accuracy for the word2vec model from prediction accuracy for the object2vec model. Warm colors indicate voxels that were better explained by object2vec and cool colors indicate voxels that were better explained by word2vec. Difference scores are plotted for voxels that show a significant preference for either model (p < 0.05, FDR-corrected, one-sided permutation test). There are clusters of significantly greater prediction accuracy for object2vec relative to word2vec overlapping with anterior PPA, mostly in the right hemisphere. There are clusters of significantly greater prediction accuracy for word2vec relative to object2vec in regions lateral to the PPA, extending to the lateral occipital cortex. ROI parcels are shown for scene-selective ROIs. PPA parahippocampal place area, OPA occipital place area, RSComp retrosplenial complex. B Category selectivity of individual voxels is plotted as a function of their encoding-model preferences. For each subject, all voxels with significant effects for either the image-based object2vec encoding model or the language-based word2vec encoding model are plotted. The x axis plots the difference in prediction accuracy between the object2vec encoding model and the word2vec encoding model. The y axis plots the difference in activation between scenes and objects, based on data from a separate set of functional localizer runs. Positive linear trends suggest that voxels that are better predicted by object2vec than word2vec tend to be more scene-selective and voxels that are better predicted by word2vec than object2vec tend to be more object-selective (Pearson r values = 0.51, 0.20, −0.17, 0.29 for subjects 1–4). Source data are provided as a Source Data file.
Fig. 7 Whole-brain voxel-wise preference map for visual vs. linguistic context and relationship to category selectivity. A This preference map shows differences in model performance for the object2vec (visual context) encoding model and the word2vec (linguistic context) encoding model. Voxel-wise difference scores were calculated by subtracting prediction accuracy for the word2vec model from prediction accuracy for the object2vec model. Warm colors indicate voxels that were better explained by object2vec and cool colors indicate voxels that were better explained by word2vec. Difference scores are plotted for voxels that show a significant preference for either model (p < 0.05, FDR-corrected, one-sided permutation test). There are clusters of significantly greater prediction accuracy for object2vec relative to word2vec overlapping with anterior PPA, mostly in the right hemisphere. There are clusters of significantly greater prediction accuracy for word2vec relative to object2vec in regions lateral to the PPA, extending to the lateral occipital cortex. ROI parcels are shown for scene-selective ROIs. PPA parahippocampal place area, OPA occipital place area, RSComp retrosplenial complex. B Category selectivity of individual voxels is plotted as a function of their encoding-model preferences. For each subject, all voxels with significant effects for either the image-based object2vec encoding model or the language-based word2vec encoding model are plotted. The x axis plots the difference in prediction accuracy between the object2vec encoding model and the word2vec encoding model. The y axis plots the difference in activation between scenes and objects, based on data from a separate set of functional localizer runs. Positive linear trends suggest that voxels that are better predicted by object2vec than word2vec tend to be more scene-selective and voxels that are better predicted by word2vec than object2vec tend to be more object-selective (Pearson r values = 0.51, 0.20, −0.17, 0.29 for subjects 1–4). Source data are provided as a Source Data file.CC BY · PubMed Central
Fig. 8 Encoding model of object spatial properties predicts fMRI responses in functionally defined ROIs. This plot shows the average prediction accuracies for encoding models in voxels from multiple regions of interest using object-wise spatial property ratings as regressors (i.e., real-world size and spatial stability). Object-selective ROIs are plotted in orange and scene-selective ROIs are plotted in cyan. The violin plots show the mean prediction accuracies (central black dots) and bootstrap standard deviations. The gray lines above each violin plot indicate the average voxel-wise split-half reliability of the fMRI responses in each ROI. As expected from previous results, object-wise spatial properties were good predictors of fMRI responses in scene regions. EVC early visual cortex, LO lateral occipital, pFs posterior fusiform, OPA occipital place area, PPA parahippocampal place area, RSComp retrosplenial complex. ***p < 0.001, uncorrected, one-sided permutation test. Exact p-values: EVC p-value = 1.4e−01; LO p-value = 8.7e−01; pFs p-value = 2.0e−04; OPA p-value = 2.0e−04; PPA p-value = 2.0e−04; RSComp p-value = 2.0e−04. Source data are provided as a Source Data file.
Fig. 8 Encoding model of object spatial properties predicts fMRI responses in functionally defined ROIs. This plot shows the average prediction accuracies for encoding models in voxels from multiple regions of interest using object-wise spatial property ratings as regressors (i.e., real-world size and spatial stability). Object-selective ROIs are plotted in orange and scene-selective ROIs are plotted in cyan. The violin plots show the mean prediction accuracies (central black dots) and bootstrap standard deviations. The gray lines above each violin plot indicate the average voxel-wise split-half reliability of the fMRI responses in each ROI. As expected from previous results, object-wise spatial properties were good predictors of fMRI responses in scene regions. EVC early visual cortex, LO lateral occipital, pFs posterior fusiform, OPA occipital place area, PPA parahippocampal place area, RSComp retrosplenial complex. ***p < 0.001, uncorrected, one-sided permutation test. Exact p-values: EVC p-value = 1.4e−01; LO p-value = 8.7e−01; pFs p-value = 2.0e−04; OPA p-value = 2.0e−04; PPA p-value = 2.0e−04; RSComp p-value = 2.0e−04. Source data are provided as a Source Data file.CC BY · PubMed Central
Fig. 9 Whole-brain voxel-wise preference map for visual context (object2vec) vs. object spatial properties. This preference map shows differences in model performance for the object2vec encoding model and the spatial-properties encoding model. Voxel-wise difference scores were calculated by subtracting prediction accuracy for the spatial properties model from prediction accuracy for the object2vec model. Warm colors indicate voxels that were better explained by object2vec and cool colors indicate voxels that were better explained by spatial properties. Difference scores are plotted for voxels that show a significant preference for either model (p < 0.05, FDR-corrected, one-sided permutation test). There are clusters of significantly greater prediction accuracy for object2vec relative to spatial properties in the anterior PPA and in the parahippocampal cortex beyond the anterior PPA boundary. There are clusters of significantly greater prediction accuracy for spatial properties relative to object2vec in posterior PPA and the other scene-selective ROIs (OPA and RSComp). ROI parcels are shown for scene-selective ROIs. PPA parahippocampal place area, OPA occipital place area, RSComp retrosplenial complex.
Fig. 9 Whole-brain voxel-wise preference map for visual context (object2vec) vs. object spatial properties. This preference map shows differences in model performance for the object2vec encoding model and the spatial-properties encoding model. Voxel-wise difference scores were calculated by subtracting prediction accuracy for the spatial properties model from prediction accuracy for the object2vec model. Warm colors indicate voxels that were better explained by object2vec and cool colors indicate voxels that were better explained by spatial properties. Difference scores are plotted for voxels that show a significant preference for either model (p < 0.05, FDR-corrected, one-sided permutation test). There are clusters of significantly greater prediction accuracy for object2vec relative to spatial properties in the anterior PPA and in the parahippocampal cortex beyond the anterior PPA boundary. There are clusters of significantly greater prediction accuracy for spatial properties relative to object2vec in posterior PPA and the other scene-selective ROIs (OPA and RSComp). ROI parcels are shown for scene-selective ROIs. PPA parahippocampal place area, OPA occipital place area, RSComp retrosplenial complex.CC BY · PubMed Central
Fig. 10 Principal components of voxel tuning for visual object context. Principal components analysis was used to examine variance in encoding-model regression weights across voxels. This plot illustrates the first four principal components (PCs) of the regression weights for the image-based object2vec encoding model, using all voxels with significant prediction accuracies. The 81 object categories from the fMRI experiment were projected onto each PC (as indicated by the color coding from blue to red). Thus, the PC score for each object is conveyed by color rather than spatial position. The spatial arrangement of the object categories is the same as in the tSNE plot of Fig. 1. We used this spatial arrangement to facilitate comparison with the embeddings before they were projected onto the encoding-model PCs and to facilitate comparisons of different PCs. At a coarse level, most PCs broadly distinguish between items found in indoor and outdoor environments. At a more fined-grained level, each PC organizes the objects into distinct sets of clusters, some of which appear to be semantically interpretable. For example, PC2 differentiates electronics and appliances from other indoor objects (e.g., microwave and computer vs. soap and napkin), and it also differentiates between man-made and natural items found in outdoor scenes (e.g., sea and sand vs. sidewalk and car). However, these PCs also contain complex clusters of objects that do not appear to have intuitive semantic interpretations. This semantic complexity may reflect the mixed selectivity that arises from encoding a large set of object contexts in a small number of representational dimensions (i.e., the 8 dimensions of object2vec). Source data are provided as a Source Data file.
Fig. 10 Principal components of voxel tuning for visual object context. Principal components analysis was used to examine variance in encoding-model regression weights across voxels. This plot illustrates the first four principal components (PCs) of the regression weights for the image-based object2vec encoding model, using all voxels with significant prediction accuracies. The 81 object categories from the fMRI experiment were projected onto each PC (as indicated by the color coding from blue to red). Thus, the PC score for each object is conveyed by color rather than spatial position. The spatial arrangement of the object categories is the same as in the tSNE plot of Fig. 1. We used this spatial arrangement to facilitate comparison with the embeddings before they were projected onto the encoding-model PCs and to facilitate comparisons of different PCs. At a coarse level, most PCs broadly distinguish between items found in indoor and outdoor environments. At a more fined-grained level, each PC organizes the objects into distinct sets of clusters, some of which appear to be semantically interpretable. For example, PC2 differentiates electronics and appliances from other indoor objects (e.g., microwave and computer vs. soap and napkin), and it also differentiates between man-made and natural items found in outdoor scenes (e.g., sea and sand vs. sidewalk and car). However, these PCs also contain complex clusters of objects that do not appear to have intuitive semantic interpretations. This semantic complexity may reflect the mixed selectivity that arises from encoding a large set of object contexts in a small number of representational dimensions (i.e., the 8 dimensions of object2vec). Source data are provided as a Source Data file.CC BY · PubMed Central

Verification

Claims the paper makes

The claims and statistics of this paper haven’t been checked yet.

Free: it reads the open-access text and checks the first 5 claims that cite a source we can check. Create a free account to check every claim.

A few free checks a day · papers already verified open instantly · results are public

Claims other papers make about this one

Each is checked against this paper’s own text: does it say what the citing paper says it does?

Self-check

Percentages, sums and reported differences re-computed from the paper’s own numbers.

The self-check needs the paper’s full text.

Citations

Cites

Show all 76 references

Cited by

See all 97

Metadata

Authors
Bonner, M. F., & Epstein, R. A.
Affiliations
  • Johns Hopkins University (US)
  • University of Pennsylvania (US)
Corresponding author
Bonner, Michael F.
Venue
Nature Communications
Published
2021-07-02
Volume
12
Issue
1
Pages
4081-4081
ISSN
2041-1723 (ISSN-L)
OpenAlex
W3174137462
Cited by
96
References
76
Citations by year
2026: 15 · 2025: 17 · 2024: 18 · 2023: 25 · 2022: 14 · 2021: 7
FWCI
8.41
Type
journal article
Language
en
Open access
Licence
Locations
  • Nature Communications (publishedVersion, cc-by)
  • bioRxiv (Cold Spring Harbor Laboratory) (acceptedVersion, cc-by-nc-nd)
  • PubMed Central (publishedVersion, cc-by)
  • PubMed (publishedVersion)
  • RePEc: Research Papers in Economics (submittedVersion)
  • DOAJ (DOAJ: Directory of Open Access Journals) (submittedVersion, cc-by-sa)
  • OSF Preprints (OSF Preprints) (submittedVersion)
Funders
  • National Institutes of Health (EY022350)
  • National Eye Institute (R01EY022350, P30EY001583)
Topics
  • Life Sciences › Neuroscience › Cognitive Neuroscience › Visual perception and processing mechanisms
  • Life Sciences › Neuroscience › Cognitive Neuroscience › Face Recognition and Perception
  • Social Sciences › Psychology › Experimental and Cognitive Psychology › Multisensory perception and integration
Keywords
statistical learning, object representation, parahippocampal place area, scene-selective cortex, visual context, language statistics, natural scene statistics, object perception
MeSH terms
Adult, Brain, Brain Mapping, Female, Humans, Language, Magnetic Resonance Imaging, Pattern Recognition, Visual, Perception, Visual Cortex, Visual Perception

About these checks

Registry, retraction, Cites and statistics results are computed, not judged, with one exception: a printed reference that no index lists is read once by a model before it counts as a citation error. Claims are extracted by a model and kept only when their quote appears verbatim in the text; each cited source is then checked, with a model’s help, for whether it says what the claim relies on. Those verdicts can be wrong — read the claim’s quote and the cited source before relying on one.

Statistics and arithmetic are recomputed, not judged.

Confidence bands are shown only for fields calibrated on our annotated test set. None is calibrated yet, so no band is shown.

What counts as a claim ›How we measure confidence ›How we check this ›

Are you an author, or do you see a problem with this page? Request a review

How to cite

Cite CoChat for the checks on this page, and the paper for its own findings.

This page
CoChat. (2026). Citation check: Object representations in the human brain reflect the co-occurrence statistics of vision and language. https://app.cochat.ai/papers/10.1038/s41467-021-24368-2
The paper
Bonner, M. F., & Epstein, R. A. (2021). Object representations in the human brain reflect the co-occurrence statistics of vision and language. Nature Communications. https://doi.org/10.1038/s41467-021-24368-2

Data sources

Bibliographic data: Semantic Scholar, OpenAlex, Crossref.

Contains information from the Semantic Scholar Academic Graph Datasets, made available under the ODC Attribution License (ODC-BY 1.0).

Semantic Scholar’s data is described in: Kinney, R., et al. (2023). The Semantic Scholar Open Data Platform. arXiv:2301.10140.