

The DOI matches its Crossref record; 95 of the 95 references it cites were found in a registry or an index; 4 of the 68 sources its claims cite were checked for support.
Self-assembling human heart organoids for the modeling of cardiac development and congenital heart disease
Open accessPublished version of a preprint
Abstract
Congenital heart defects constitute the most common human birth defect, however understanding of how these disorders originate is limited by our ability to model the human heart accurately in vitro. Here we report a method to generate developmentally relevant human heart organoids by self-assembly using human pluripotent stem cells. Our procedure is fully defined, efficient, reproducible, and compatible with high-content approaches. Organoids are generated through a three-step Wnt signaling modulation strategy using chemical inhibitors and growth factors. Heart organoids are comparable to age-matched human fetal cardiac tissues at the transcriptomic, structural, and cellular level. They develop sophisticated internal chambers with well-organized multi-lineage cardiac cell types, recapitulate heart field formation and atrioventricular specification, develop a complex vasculature, and exhibit robust functional activity. We also show that our organoid platform can recreate complex metabolic disorders associated with congenital heart defects, as demonstrated by an in vitro model of pregestational diabetes-induced congenital heart defects.
Overview
AI snapshot
Written from the paper’s full text.
TL;DR
The paper reports a fully defined, reproducible method to generate self-assembling human heart organoids (hHOs) from human pluripotent stem cells via three-step Wnt signaling modulation. The hHOs recapitulate fetal-like cardiac structure, multi-lineage composition, chamber formation, vascularization, and electrophysiology, and can model pregestational diabetes-induced congenital heart defects in vitro.
Key findings
- hHOs were generated by sequential CHIR99021/Wnt-C59/CHIR99021 treatment; beating appeared as early as day 6, was robust by day 10, and lasted at least 8 weeks. Optimal first Wnt activation was 1–4 µM CHIR99021, with 4 µM yielding 64.9 ± 5.3% TNNT2+ cells at day 15.
- hHOs contained multiple cardiac lineages: approximately 59% cardiomyocytes, 16% epicardial cells, 14% endocardial cells, 12% cardiac fibroblasts, and 1.6% endothelial cells; at day 15, atrial cardiomyocytes were ~48% and ventricular cardiomyocytes ~18% of total cells.
- hHOs formed 4–6 internal chambers ranging from 5.5e−4 mm3 to 1.3e−2 mm3, with organoid size up to 1 mm in diameter (~0.45 mm3), and showed vascular networks, action potentials, and calcium transients.
- In a pregestational diabetes model using 11.1 mM glucose and 1.14 nM insulin versus 3.5 mM glucose and 170 pM insulin, diabetic hHOs were larger, showed arrhythmic action potentials, decreased oxygen consumption, increased glycolysis, fewer mitochondria, more lipid droplets, decreased MYL2+ ventricular cells, enlarged MYL7+ atrial regions, and disrupted epicardial/myocardial organization.
Methods
- hPSCs were seeded at 10,000 cells/well in ultra-low attachment 96-well plates to form embryoid bodies, then differentiated with a three-step Wnt modulation protocol using CHIR99021, Wnt-C59, and a second CHIR99021 exposure; BMP4 and Activin A were tested as additives.
- Characterization included RNA sequencing across days 0–19, immunofluorescence/confocal imaging, optical coherence tomography, TEM, microelectrode array electrophysiology, GCaMP6f calcium imaging, and Seahorse metabolic assays.
- Statistical analysis used unpaired two-tailed Student’s t-tests and 1-way or 2-way ANOVA with multiple-comparison corrections; data are mean ± s.d. from at least 3 independent experiments unless otherwise stated.
Limitations
- Stated: organoids tend to deviate from normal developmental pathways over time and become less relevant the longer they are cultured; their recapitulation of heart development remains limited compared with models such as mice.
- Stated: the technology needs improvement in morphological/anatomical fidelity and in forming effective vascular networks that can provide nutrients; further studies are needed to assess vascular maturity, connectivity, and resemblance to coronary vasculature.
- Stated and evident: immunofluorescence and bulk RNA sequencing may not fully capture organoid heterogeneity, and single-cell/single-organoid omics are proposed for future work; the study is in vitro only and does not report in vivo validation or transplantation.
Model-written summary. Check it against the paper before relying on it.
Integrity signals
Registry
Cites
Statistics
Figures
Verification
Claims the paper makes
73 Own result · 27 Not checked yet · 17 Own interpretation · 16 Own method · 5 No basis given · 1 Supported · 1 Supported so far
The sources with a verdict support this claim; the rest weren’t checked yet, have no full text we could read, or their verdicts aren’t rated yet.
In the paper
“progress on the creation of human heart organoid models for cardiovascular disease studies has been limited and lags significantly behind other organs (e.g., kidney, colon, intestine, brain)1–4.”
§ Self-assembling human heart organoids for the modeling of cardiac development and congenital heart disease > Introduction
What the sources say
- Not checked yetcites [1] Takasato, M. et al. Kidney organoids from human iPS cells contain multiple lineages and model human nephrogenesis. Nature 526, 564–568 (2015). source
- Supportedcites [2] Crespo, M. et al. Colonic organoids derived from human induced pluripotent stem cells for modeling colorectal cancer and drug testing. Nat. Med. 23, 878–884 (2017). source
This source is offered as the colon example among the other organoid models. The Introduction reports generating human colonic organoids for colorectal disease modeling, so it supports that identification citation. (LLM, conf=0.90)
- Supportedcites [3] Serra, D. et al. Self-organization and symmetry breaking in intestinal organoid development. Nature 569, 66–72 (2019). source
This citation serves as an example of organoid development in another organ, the intestine, rather than as evidence for the comparative claim about heart-organoid progress. The section “Intestinal organoid development from single cells” describes the growth of intestinal organoids from single cells, supporting that example. (LLM, conf=0.88)
- Supportedcites [4] Mansour, A. A. et al. An in vivo model of functional and vascularized human brain organoids. Nat. Biotechnol. 36, 432–441 (2018). source
The Abstract describes a functional, vascularized human brain organoid model for studying development and disease. As one of several citations following a list of other organs, this paper supports the brain-organoid example; it is not being cited as a direct study of heart organoids. (LLM, conf=0.89)
plain- Asserted: passes — The authors put it forward as true.
- Checkable: passes — It can be checked against evidence.
- Load-bearing: passes — The paper’s conclusions depend on it.
- Based: passes — The paper gives a reason why it holds.
The paper states this without a source or data behind it here, so there is nothing to check it against. The quote shows it is in the paper.
In the paper
“Our protocol relies mainly on three sequential Wnt modulation steps (activation/inhibition/activation) at specific time points on suspension embryoid bodies (EBs)”
§ Self-assembling human heart organoids for the modeling of cardiac development and congenital heart disease > Introduction
plaindirect- Asserted: passes — The authors put it forward as true.
- Checkable: passes — It can be checked against evidence.
- Load-bearing: passes — The paper’s conclusions depend on it.
- Based: passes — The paper gives a reason why it holds.
The paper states this without a source or data behind it here, so there is nothing to check it against. The quote shows it is in the paper.
In the paper
“Heart organoids are comparable to age-matched human fetal cardiac tissues at the transcriptomic, structural, and cellular level.”
§ Self-assembling human heart organoids for the modeling of cardiac development and congenital heart disease > Abstract
plain- Asserted: passes — The authors put it forward as true.
- Checkable: passes — It can be checked against evidence.
- Load-bearing: passes — The paper’s conclusions depend on it.
- Based: passes — The paper gives a reason why it holds.
- Rests on an assumption: The developmental stage of hHOs at day 19 is age-matched to human fetal hearts at gestational days 57–67.
A result the paper reports from its own data — it cites no other source for it, so there is none to check. The quote shows it is in the paper.
In the paper
“They develop sophisticated internal chambers with well-organized multi-lineage cardiac cell types”
§ Self-assembling human heart organoids for the modeling of cardiac development and congenital heart disease > Abstract
plain- Asserted: passes — The authors put it forward as true.
- Checkable: passes — It can be checked against evidence.
- Load-bearing: passes — The paper’s conclusions depend on it.
- Based: passes — The paper gives a reason why it holds.
A result the paper reports from its own data — it cites no other source for it, so there is none to check. The quote shows it is in the paper.
In the paper
“Here we report a method to generate developmentally relevant human heart organoids by self-assembly using human pluripotent stem cells.”
- Also stated in: § Introduction · plain
“Here, we report a small molecule-based methodology to create highly complex and physiologically relevant self-assembling human heart organoids (hHOs) using hPSCs by manipulating cardiac developmental programs.”
§ Self-assembling human heart organoids for the modeling of cardiac development and congenital heart disease > Abstract
plaindirect- Asserted: passes — The authors put it forward as true.
- Checkable: passes — It can be checked against evidence.
- Load-bearing: passes — The paper’s conclusions depend on it.
- Based: passes — The paper gives a reason why it holds.
- Also stated in: § Introduction · plain
The paper states this without a source or data behind it here, so there is nothing to check it against. The quote shows it is in the paper.
In the paper
“produces significant heart-like structures in terms of structure, organization, functionality, cardiac cell type complexity, ECM composition, and vascularization.”
§ Self-assembling human heart organoids for the modeling of cardiac development and congenital heart disease > Introduction
plaindirect- Asserted: passes — The authors put it forward as true.
- Checkable: passes — It can be checked against evidence.
- Load-bearing: passes — The paper’s conclusions depend on it.
- Based: passes — The paper gives a reason why it holds.
A result the paper reports from its own data — it cites no other source for it, so there is none to check. The quote shows it is in the paper.
In the paper
“Brightfield and immunofluorescence imaging of hHOs showed a significant increase in size throughout the differentiation protocol”
§ Self-assembling human heart organoids for the modeling of cardiac development and congenital heart disease > Results > Self-assembling human heart organoids generated by Wnt signaling modulation
plaincorrelational- Asserted: passes — The authors put it forward as true.
- Checkable: passes — It can be checked against evidence.
- Load-bearing: unclear — It is unclear whether the paper’s conclusions depend on it.
- Based: passes — The paper gives a reason why it holds.
A result the paper reports from its own data — it cites no other source for it, so there is none to check. The quote shows it is in the paper.
In the paper
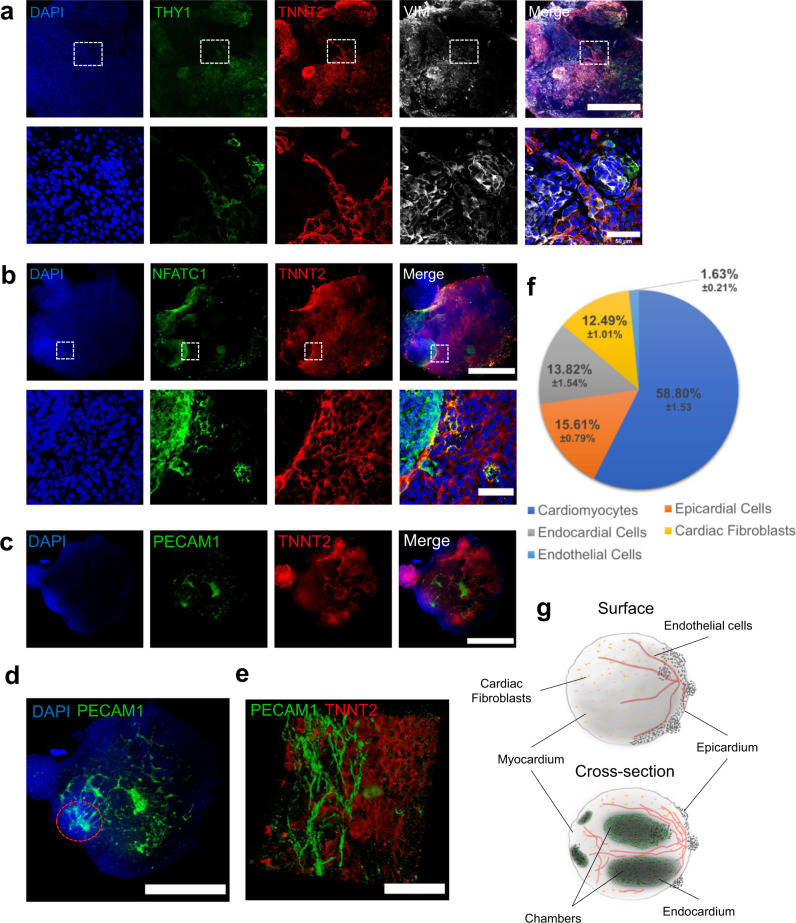
“Lastly, extracellular matrix proteins common in cardiac tissue, such as collagen type 1, collagen type 4, and fibronectin, were all observed in our hHO model”
§ Self-assembling human heart organoids for the modeling of cardiac development and congenital heart disease > Results > Heart organoids produce multiple cardiac-specific cell lineages
plain- Asserted: passes — The authors put it forward as true.
- Checkable: passes — It can be checked against evidence.
- Load-bearing: unclear — It is unclear whether the paper’s conclusions depend on it.
- Based: passes — The paper gives a reason why it holds.
A result the paper reports from its own data — it cites no other source for it, so there is none to check. The quote shows it is in the paper.
In the paper
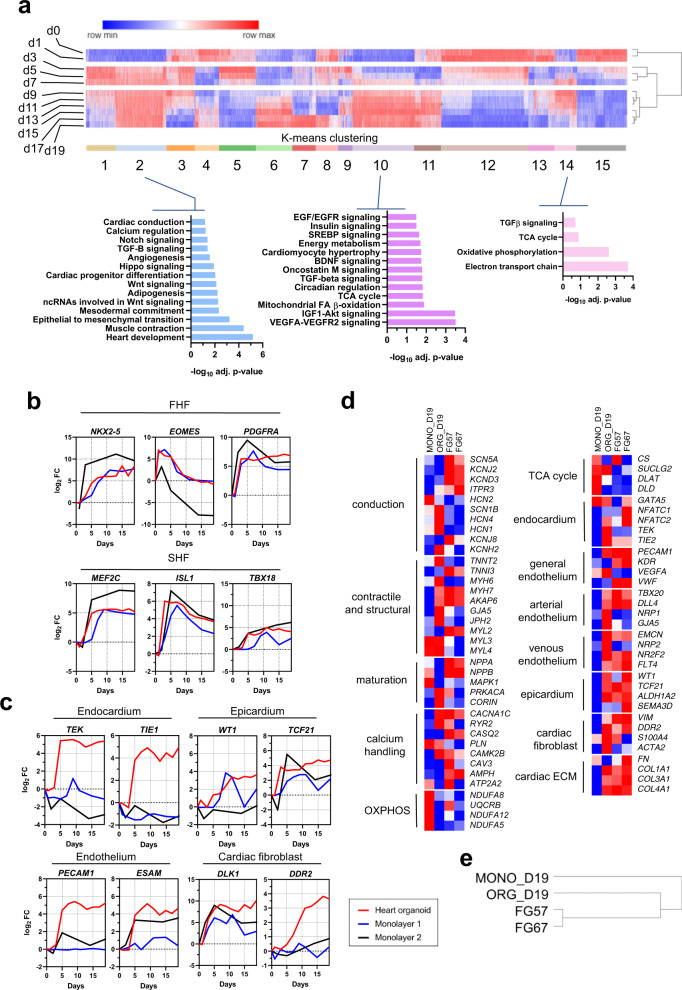
“Principal component analysis showed a clear progression in development in the hHOs from day 0 to 19”
§ Self-assembling human heart organoids for the modeling of cardiac development and congenital heart disease > Results > Transcriptomic analysis reveals hHOs closely model human fetal cardiac development and produce all main cardiac cell lineages
boostedcorrelational- Asserted: passes — The authors put it forward as true.
- Checkable: passes — It can be checked against evidence.
- Load-bearing: passes — The paper’s conclusions depend on it.
- Based: passes — The paper gives a reason why it holds.
A result the paper reports from its own data — it cites no other source for it, so there is none to check. The quote shows it is in the paper.
In the paper
“Gene expression profiles showed hHOs had higher cardiac cell lineage complexity than cells that underwent monolayer differentiation, especially in the epicardial, endothelial, endocardial, and cardiac fibroblast populations”
§ Self-assembling human heart organoids for the modeling of cardiac development and congenital heart disease > Results > Transcriptomic analysis reveals hHOs closely model human fetal cardiac development and produce all main cardiac cell lineages
plaincorrelational- Asserted: passes — The authors put it forward as true.
- Checkable: passes — It can be checked against evidence.
- Load-bearing: passes — The paper’s conclusions depend on it.
- Based: passes — The paper gives a reason why it holds.
- Probably not a substantial claim. 22
- It may state two separate claims as one. 48
Every source the paper cites for this claim was checked and supports it.
In the paper
“The first and second heart fields (FHF, SHF) are two cell populations found in the developing heart.”
§ Self-assembling human heart organoids for the modeling of cardiac development and congenital heart disease > Results > Human heart organoids recapitulate heart field development and atrioventricular specification
What the sources say
- Supportedcites [36] Brade, T., Pane, L. S., Moretti, A., Chien, K. R. & Laugwitz, K. L. Embryonic heart progenitors and cardiogenesis. Cold Spring Harb. Perspect. Med. 3, 1–18 (2013). source
The section on formation of the cardiac crescent and linear heart tube says the first and second heart fields can be distinguished during early cardiac development. Its Figure 2 description identifies FHF and SHF as distinct cardiac progenitor pools, supporting the paraphrase. (LLM, conf=0.92)
plain- Asserted: passes — The authors put it forward as true.
- Checkable: passes — It can be checked against evidence.
- Load-bearing: passes — The paper’s conclusions depend on it.
- Based: passes — The paper gives a reason why it holds.
Probably not a substantial claim. It may state two separate claims as one.
- Supported
A result the paper reports from its own data — it cites no other source for it, so there is none to check. The quote shows it is in the paper.
In the paper
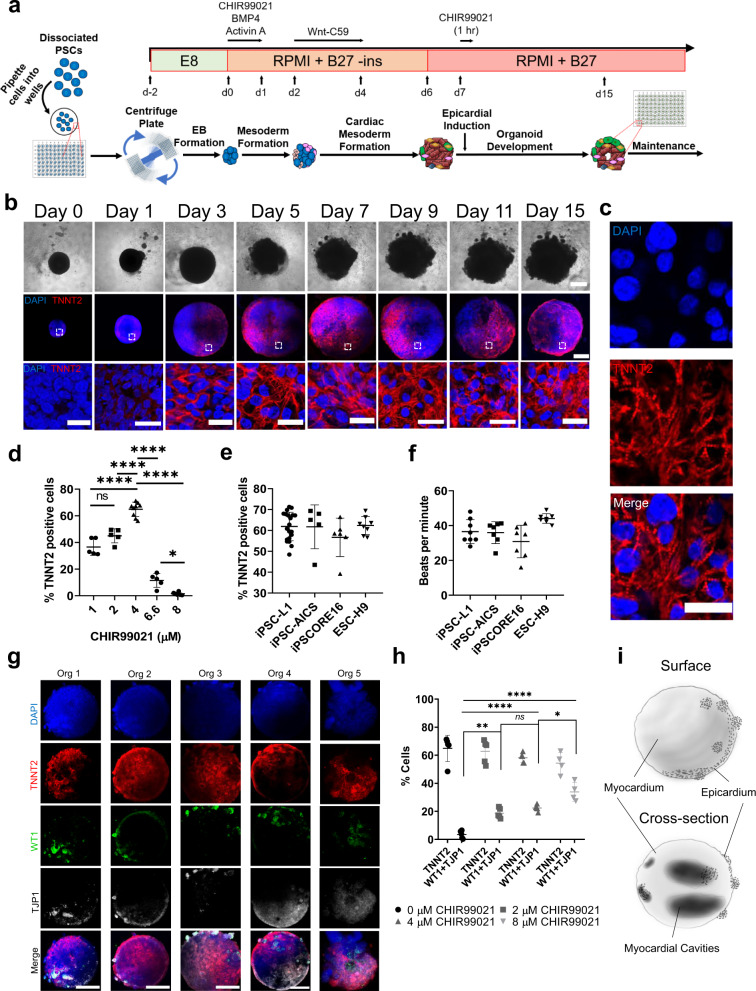
“Confocal microscopy for the cardiomyocyte-specific marker TNNT2 showed that organoids developed sarcomeres as early as day 7 (Fig. 1b), with much clearer sarcomere banding and fiber assembly by day 15”
§ Self-assembling human heart organoids for the modeling of cardiac development and congenital heart disease > Results > Self-assembling human heart organoids generated by Wnt signaling modulation
plain- Asserted: passes — The authors put it forward as true.
- Checkable: passes — It can be checked against evidence.
- Load-bearing: passes — The paper’s conclusions depend on it.
- Based: passes — The paper gives a reason why it holds.
It may state two separate claims as one.
A result the paper reports from its own data — it cites no other source for it, so there is none to check. The quote shows it is in the paper.
In the paper
“Beating hHOs appeared as early as day 6 of the differentiation protocol, with robust and regular beating by day 10 in all organoids and lasting for at least 8 weeks in culture”
§ Self-assembling human heart organoids for the modeling of cardiac development and congenital heart disease > Results > Self-assembling human heart organoids generated by Wnt signaling modulation
plain- Asserted: passes — The authors put it forward as true.
- Checkable: passes — It can be checked against evidence.
- Load-bearing: passes — The paper’s conclusions depend on it.
- Based: passes — The paper gives a reason why it holds.
It may state two separate claims as one.
A result the paper reports from its own data — it cites no other source for it, so there is none to check. The quote shows it is in the paper.
In the paper
“We found out that optimal conditions for the first Wnt activation were critical for successful heart organoid formation and differed from those reported for cardiac lineage monolayer differentiation.”
§ Self-assembling human heart organoids for the modeling of cardiac development and congenital heart disease > Results > Self-assembling human heart organoids generated by Wnt signaling modulation
plaindirect- Asserted: passes — The authors put it forward as true.
- Checkable: passes — It can be checked against evidence.
- Load-bearing: passes — The paper’s conclusions depend on it.
- Based: passes — The paper gives a reason why it holds.
It may state two separate claims as one.
A result the paper reports from its own data — it cites no other source for it, so there is none to check. The quote shows it is in the paper.
In the paper
“however, high concentrations or long exposure times inhibited cardiac cell type formation and provoked an undesired extensive epicardial expansion”
§ Self-assembling human heart organoids for the modeling of cardiac development and congenital heart disease > Results > Self-assembling human heart organoids generated by Wnt signaling modulation
plaindirect- Asserted: passes — The authors put it forward as true.
- Checkable: passes — It can be checked against evidence.
- Load-bearing: passes — The paper’s conclusions depend on it.
- Based: passes — The paper gives a reason why it holds.
It may state two separate claims as one.
A result the paper reports from its own data — it cites no other source for it, so there is none to check. The quote shows it is in the paper.
In the paper
“Figure 3f shows a quantification of the contribution of the different cardiac cell populations to the organoids, with a composition of 12.49 ± 1.01% cardiac fibroblasts, 13.82 ± 1.54% endocardial cells, and 1.63 ± 0.21% endothelial cells.”
§ Self-assembling human heart organoids for the modeling of cardiac development and congenital heart disease > Results > Heart organoids produce multiple cardiac-specific cell lineages
plain- Asserted: passes — The authors put it forward as true.
- Checkable: passes — It can be checked against evidence.
- Load-bearing: passes — The paper’s conclusions depend on it.
- Based: passes — The paper gives a reason why it holds.
It may state two separate claims as one.
A result the paper reports from its own data — it cites no other source for it, so there is none to check. The quote shows it is in the paper.
In the paper
“recapitulate heart field formation and atrioventricular specification”
§ Self-assembling human heart organoids for the modeling of cardiac development and congenital heart disease > Abstract
plaindirect- Asserted: passes — The authors put it forward as true.
- Checkable: passes — It can be checked against evidence.
- Load-bearing: passes — The paper’s conclusions depend on it.
- Based: passes — The paper gives a reason why it holds.
It may state two separate claims as one.
A result the paper reports from its own data — it cites no other source for it, so there is none to check. The quote shows it is in the paper.
In the paper
“Further imaging revealed a robust interconnected network of endothelial cells (PECAM1 + ), and vessel-like tube formation throughout the organoid assembling between day 11 and 13”
§ Self-assembling human heart organoids for the modeling of cardiac development and congenital heart disease > Results > Heart organoids produce multiple cardiac-specific cell lineages
plaincorrelational- Asserted: passes — The authors put it forward as true.
- Checkable: passes — It can be checked against evidence.
- Load-bearing: passes — The paper’s conclusions depend on it.
- Based: passes — The paper gives a reason why it holds.
It may state two separate claims as one.
A result the paper reports from its own data — it cites no other source for it, so there is none to check. The quote shows it is in the paper.
In the paper
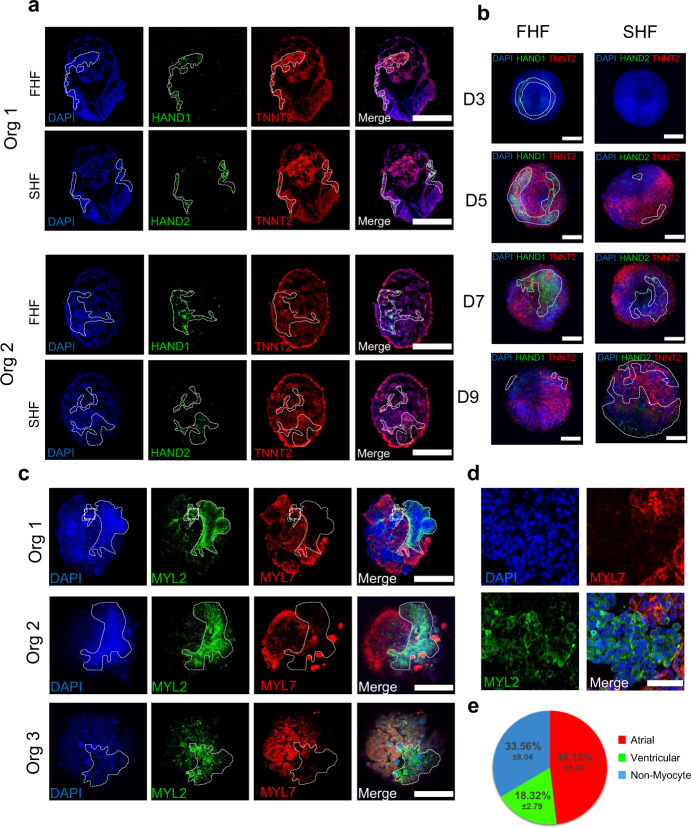
“Immunofluorescence of day 7 hHO cryosections showed well-differentiated regions of HAND1 and HAND2 (Fig. 4a) cells in the same organoid, suggesting that both FHF and SHF progenitors are present and segregated into their respective heart fields.”
§ Self-assembling human heart organoids for the modeling of cardiac development and congenital heart disease > Results > Human heart organoids recapitulate heart field development and atrioventricular specification
hedgedcorrelational- Asserted: passes — The authors put it forward as true.
- Checkable: passes — It can be checked against evidence.
- Load-bearing: passes — The paper’s conclusions depend on it.
- Based: passes — The paper gives a reason why it holds.
It may state two separate claims as one.
A result the paper reports from its own data — it cites no other source for it, so there is none to check. The quote shows it is in the paper.
In the paper
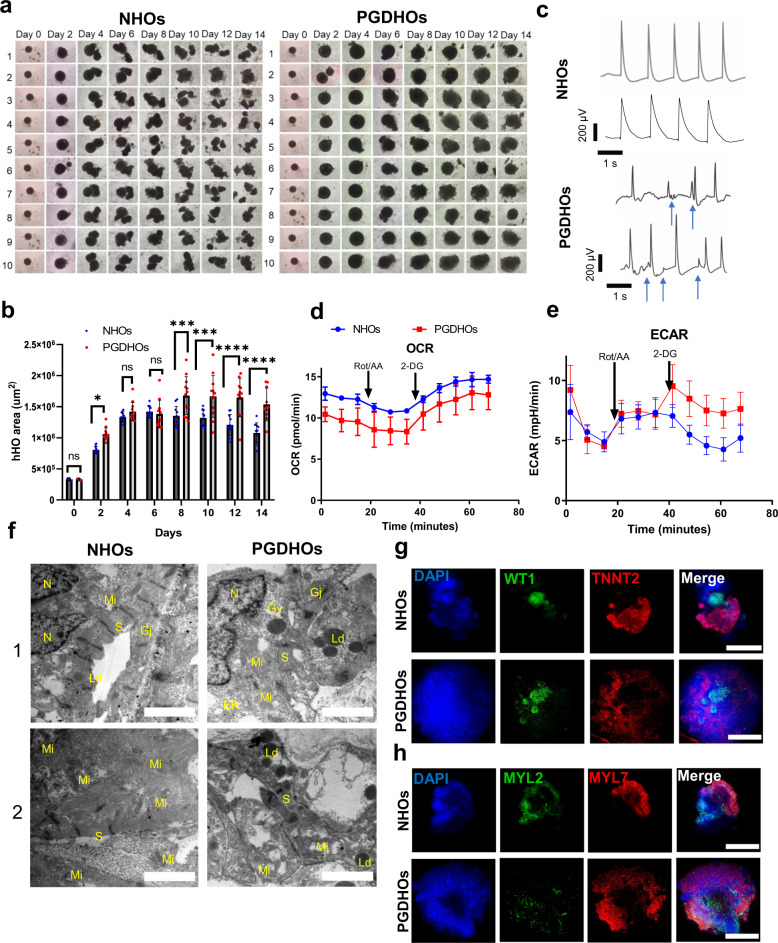
“NHOs were slower to grow and exhibited patterning and elongation between days 4 and 8”
§ Self-assembling human heart organoids for the modeling of cardiac development and congenital heart disease > Results > Modeling pregestational diabetes induced CHD
plain- Asserted: passes — The authors put it forward as true.
- Checkable: passes — It can be checked against evidence.
- Load-bearing: unclear — It is unclear whether the paper’s conclusions depend on it.
- Based: passes — The paper gives a reason why it holds.
It may state two separate claims as one.
A result the paper reports from its own data — it cites no other source for it, so there is none to check. The quote shows it is in the paper.
In the paper
“Atrial cardiomyocytes made up most of the cell population (~48%) while ventricular cardiomyocytes made up about one fifth (~18%) of the total cells in the organoids at day 15”
§ Self-assembling human heart organoids for the modeling of cardiac development and congenital heart disease > Results > Human heart organoids recapitulate heart field development and atrioventricular specification
plain- Asserted: passes — The authors put it forward as true.
- Checkable: passes — It can be checked against evidence.
- Load-bearing: passes — The paper’s conclusions depend on it.
- Based: passes — The paper gives a reason why it holds.
It may state two separate claims as one.
A result the paper reports from its own data — it cites no other source for it, so there is none to check. The quote shows it is in the paper.
In the paper
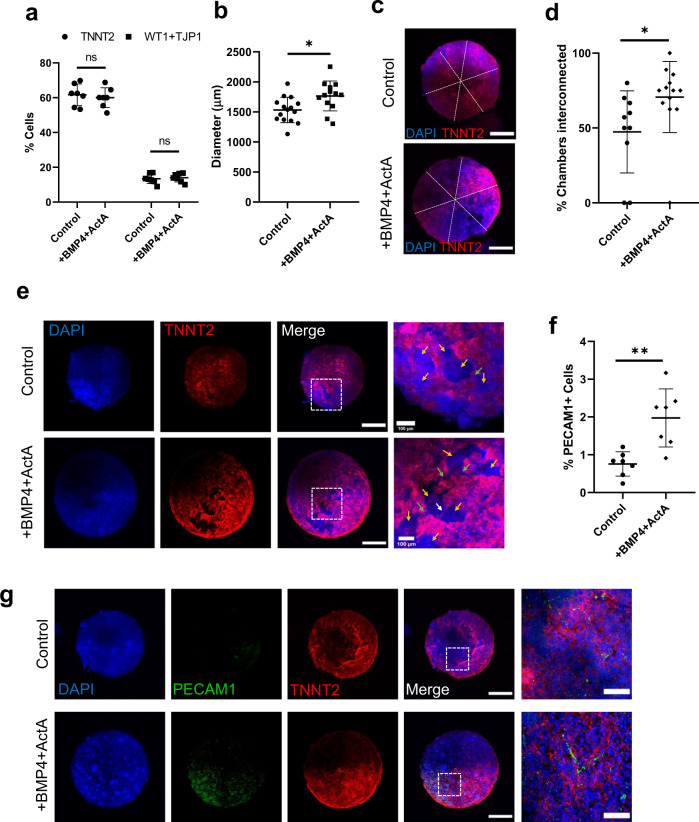
“a Percent of cardiomyocyte and epicardial positive cells as a percentage of total DAPI + nuclei (n = 7 organoids per condition, value = mean ± s.d., 2-way ANOVA Sidak’s multiple comparisons test, ns: p = 0.76 for TNNT2 and p = 0.97 for WT1 + TJP1)”
§ Self-assembling human heart organoids for the modeling of cardiac development and congenital heart disease > Results > BMP4 and Activin A improve heart organoid chamber formation and vascularization
plainn = 7- Asserted: passes — The authors put it forward as true.
- Checkable: passes — It can be checked against evidence.
- Load-bearing: unclear — It is unclear whether the paper’s conclusions depend on it.
- Based: passes — The paper gives a reason why it holds.
It may state two separate claims as one.
A result the paper reports from its own data — it cites no other source for it, so there is none to check. The quote shows it is in the paper.
In the paper
“Notably, immunofluorescence analysis of organoids treated with BMP4 and Activin A showed a 160% increase in PECAM1+ cells too, indicating a significant effect on organoid vascularization”
§ Self-assembling human heart organoids for the modeling of cardiac development and congenital heart disease > Results > BMP4 and Activin A improve heart organoid chamber formation and vascularization
hedgeddirect- Asserted: passes — The authors put it forward as true.
- Checkable: passes — It can be checked against evidence.
- Load-bearing: passes — The paper’s conclusions depend on it.
- Based: passes — The paper gives a reason why it holds.
It may state two separate claims as one.
A result the paper reports from its own data — it cites no other source for it, so there is none to check. The quote shows it is in the paper.
In the paper
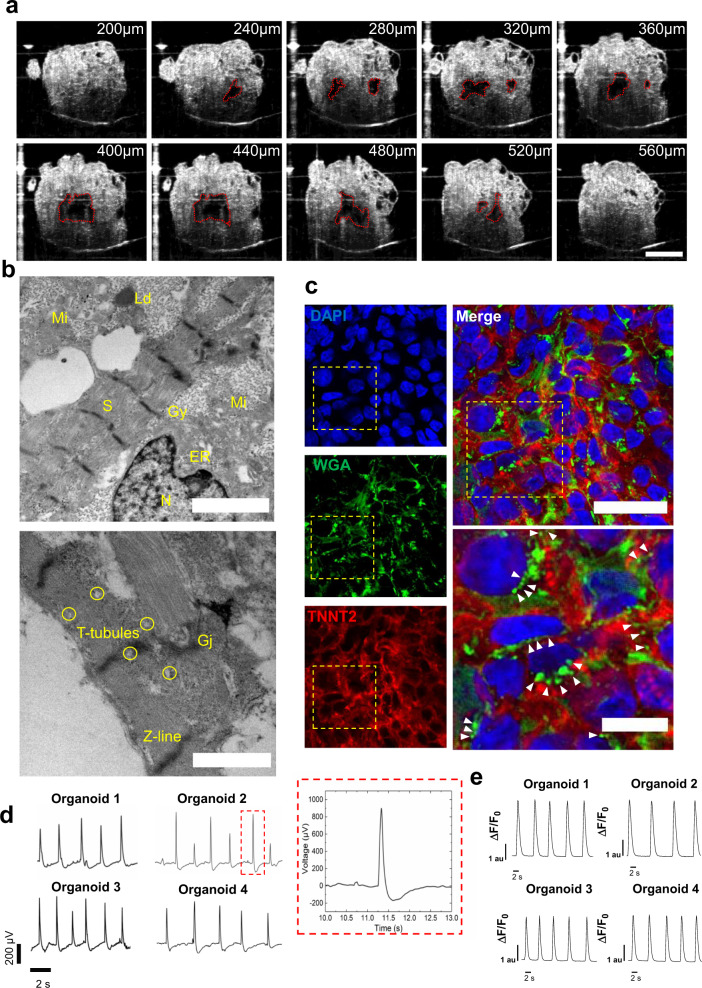
“revealing 4–6 chambers near the center of the organoid ranging from 5.5e−4 mm3 to 1.3e−2 mm3 (Supplementary Fig. 6d, Supplementary Movie 10).”
§ Self-assembling human heart organoids for the modeling of cardiac development and congenital heart disease > Results > Heart organoids exhibit functional and structural features of the developing human heart
plain- Asserted: passes — The authors put it forward as true.
- Checkable: passes — It can be checked against evidence.
- Load-bearing: unclear — It is unclear whether the paper’s conclusions depend on it.
- Based: passes — The paper gives a reason why it holds.
It may state two separate claims as one.
A result the paper reports from its own data — it cites no other source for it, so there is none to check. The quote shows it is in the paper.
In the paper
“we could detect robust beating and normal electrophysiological activity with well-defined action potential waves reminiscent of QRS complexes, T and P waves, and regular action potentials across multiple organoids (Fig. 6d).”
§ Self-assembling human heart organoids for the modeling of cardiac development and congenital heart disease > Results > Heart organoids exhibit functional and structural features of the developing human heart
hedged- Asserted: passes — The authors put it forward as true.
- Checkable: passes — It can be checked against evidence.
- Load-bearing: passes — The paper’s conclusions depend on it.
- Based: passes — The paper gives a reason why it holds.
It may state two separate claims as one.
A result the paper reports from its own data — it cites no other source for it, so there is none to check. The quote shows it is in the paper.
In the paper
“The two different populations localized to different regions of the organoid and were in close proximity, which mirrors the expression pattern seen in human hearts”
§ Self-assembling human heart organoids for the modeling of cardiac development and congenital heart disease > Results > Human heart organoids recapitulate heart field development and atrioventricular specification
plaincorrelational- Asserted: passes — The authors put it forward as true.
- Checkable: passes — It can be checked against evidence.
- Load-bearing: passes — The paper’s conclusions depend on it.
- Based: passes — The paper gives a reason why it holds.
It may state two separate claims as one.
A result the paper reports from its own data — it cites no other source for it, so there is none to check. The quote shows it is in the paper.
In the paper
“SHF markers appeared later in the process, only becoming prominent around day 7, and expressing throughout the organoid up to day 9”
§ Self-assembling human heart organoids for the modeling of cardiac development and congenital heart disease > Results > Human heart organoids recapitulate heart field development and atrioventricular specification
plain- Asserted: passes — The authors put it forward as true.
- Checkable: passes — It can be checked against evidence.
- Load-bearing: passes — The paper’s conclusions depend on it.
- Based: passes — The paper gives a reason why it holds.
It may state two separate claims as one.
A result the paper reports from its own data — it cites no other source for it, so there is none to check. The quote shows it is in the paper.
In the paper
“PGDHOs contained epicardial tissue surrounded by myocardial tissue, whereas NHOs contained epicardial tissue on top of or beside myocardial tissue as physiologically expected (Fig. 7h).”
§ Self-assembling human heart organoids for the modeling of cardiac development and congenital heart disease > Results > Modeling pregestational diabetes induced CHD
plain- Asserted: passes — The authors put it forward as true.
- Checkable: passes — It can be checked against evidence.
- Load-bearing: passes — The paper’s conclusions depend on it.
- Based: passes — The paper gives a reason why it holds.
It may state two separate claims as one.
A result the paper reports from its own data — it cites no other source for it, so there is none to check. The quote shows it is in the paper.
In the paper
“Compared with normal glycemia conditions, diabetic hHOs showed decreased MYL2 + ventricular cardiomyocytes and enlarged MYL7 + atrial cardiomyocyte regions”
§ Self-assembling human heart organoids for the modeling of cardiac development and congenital heart disease > Results > Modeling pregestational diabetes induced CHD
plaincorrelational- Asserted: passes — The authors put it forward as true.
- Checkable: passes — It can be checked against evidence.
- Load-bearing: passes — The paper’s conclusions depend on it.
- Based: passes — The paper gives a reason why it holds.
It may state two separate claims as one.
A result the paper reports from its own data — it cites no other source for it, so there is none to check. The quote shows it is in the paper.
In the paper
“with BMP4 and Activin A showed a 160% increase in PECAM1+ cells too, indicating a significant effect on organoid vascularization (Fig. 5f, g).”
- Also stated in: § BMP4 and Activin A improve heart organoid chamber formation and vascularization · plain
“f PECAM1 + cells as a percentage of total DAPI + nuclei, (n = 7 organoids per condition, value = mean ± s.d., two-tailed, unpaired t-test, **p = 0.0023).”
§ Self-assembling human heart organoids for the modeling of cardiac development and congenital heart disease > Results > BMP4 and Activin A improve heart organoid chamber formation and vascularization
plaindirectn = 7- Asserted: passes — The authors put it forward as true.
- Checkable: passes — It can be checked against evidence.
- Load-bearing: passes — The paper’s conclusions depend on it.
- Based: passes — The paper gives a reason why it holds.
It may state two separate claims as one.
- Also stated in: § BMP4 and Activin A improve heart organoid chamber formation and vascularization · plain
A result the paper reports from its own data — it cites no other source for it, so there is none to check. The quote shows it is in the paper.
In the paper
“FHF markers were observed as early as day 3 (prior to TNNT2 detection), confined to specific regions on the organoid, and reducing in expression around day 9”
§ Self-assembling human heart organoids for the modeling of cardiac development and congenital heart disease > Results > Human heart organoids recapitulate heart field development and atrioventricular specification
plaindirect- Asserted: passes — The authors put it forward as true.
- Checkable: passes — It can be checked against evidence.
- Load-bearing: passes — The paper’s conclusions depend on it.
- Based: passes — The paper gives a reason why it holds.
It may state two separate claims as one.
A result the paper reports from its own data — it cites no other source for it, so there is none to check. The quote shows it is in the paper.
In the paper
“When compared with existing cardiomyocyte monolayer differentiation methods, hHOs showed higher expression of genes associated with conduction, contractile function, calcium handling, and various cardiac cell populations, which better resemble gene expression data retrieved from human fetal hearts.”
§ Self-assembling human heart organoids for the modeling of cardiac development and congenital heart disease > Discussion
plaincorrelational- Asserted: passes — The authors put it forward as true.
- Checkable: passes — It can be checked against evidence.
- Load-bearing: passes — The paper’s conclusions depend on it.
- Based: passes — The paper gives a reason why it holds.
It may state two separate claims as one.
A result the paper reports from its own data — it cites no other source for it, so there is none to check. The quote shows it is in the paper.
In the paper
“The hHOs reported here form multiple chambers lined with NFATC1+ endocardial cells which are interconnected as seen in the OCT cross-sectional imaging (Supplementary Movies 7–10).”
§ Self-assembling human heart organoids for the modeling of cardiac development and congenital heart disease > Discussion
plain- Asserted: passes — The authors put it forward as true.
- Checkable: passes — It can be checked against evidence.
- Load-bearing: passes — The paper’s conclusions depend on it.
- Based: passes — The paper gives a reason why it holds.
It may state two separate claims as one.
In the paper
“Hybrid cardiac-foregut organoids from human PSCs have also been reported very recently, with external heart layers and an internal endodermal core19”
§ Self-assembling human heart organoids for the modeling of cardiac development and congenital heart disease > Introduction
What the sources say
- Not checked yetcites [19] Drakhlis, L. et al. Human heart-forming organoids recapitulate early heart and foregut development. Nat. Biotechnol. 39, 737–746 (2021). source
plain- Asserted: passes — The authors put it forward as true.
- Checkable: passes — It can be checked against evidence.
- Load-bearing: fails — The paper’s conclusions may not depend on it.
- Based: passes — The paper gives a reason why it holds.
Probably not a substantial claim. The paper’s conclusions may not depend on it.
None of the sources cited for this claim have been checked yet.
In the paper
“While demonstrating a large leap in self-assembling capabilities, these cardioids still relied heavily on complex growth factor mixtures, co-culture approaches to include epicardial clusters, and independent differentiation protocols to achieve their final results.”
§ Self-assembling human heart organoids for the modeling of cardiac development and congenital heart disease > Introduction
What the sources say
- Not checked yetcites [19] Drakhlis, L. et al. Human heart-forming organoids recapitulate early heart and foregut development. Nat. Biotechnol. 39, 737–746 (2021). source
- Not checked yetcites [20] Hofbauer, P. et al. Cardioids reveal self-organizing principles of human cardiogenesis. Cell. 184, 3299–3317 (2021). source
plaindirect- Asserted: passes — The authors put it forward as true.
- Checkable: passes — It can be checked against evidence.
- Load-bearing: unclear — It is unclear whether the paper’s conclusions depend on it.
- Based: passes — The paper gives a reason why it holds.
It may state two separate claims as one.
A conclusion the paper draws from its own results — it cites no other source for it, so there is none to check. The quote shows it is in the paper.
In the paper
“It is also automatable, scalable, and amenable to high-content/high-throughput pharmacological screenings.”
§ Self-assembling human heart organoids for the modeling of cardiac development and congenital heart disease > Introduction
plain- Asserted: passes — The authors put it forward as true.
- Checkable: passes — It can be checked against evidence.
- Load-bearing: fails — The paper’s conclusions may not depend on it.
- Based: fails — The paper may give no reason why it holds.
Probably not a substantial claim. The paper’s conclusions may not depend on it. The paper may give no reason why it holds. It may state two separate claims as one.
None of the sources cited for this claim have been checked yet.
In the paper
“Recently, mouse embryonic stem cells (ESCs) were used to generate precardiac organoids showing distinct heart field specifications16, cardiac crescent-like structures juxtaposed with primitive gut tube17, and atrial and ventricular cardiomyocyte lineages18.”
§ Self-assembling human heart organoids for the modeling of cardiac development and congenital heart disease > Introduction
What the sources say
- Not checked yetcites [16] Andersen, P. et al. Precardiac organoids form two heart fields via Bmp/Wnt signaling. Nat. Commun. 9, 1–13 (2018). source
- Not checked yetcites [17] Rossi, G. et al. Capturing cardiogenesis in gastruloids. Cell Stem Cell 28, 230–240 (2020). source
- Not checked yetcites [18] Lee, J. et al. In vitro generation of functional murine heart organoids via FGF4 and extracellular matrix. Nat. Commun. 11, 1–18 (2020). source
plaindirect- Asserted: passes — The authors put it forward as true.
- Checkable: passes — It can be checked against evidence.
- Load-bearing: fails — The paper’s conclusions may not depend on it.
- Based: passes — The paper gives a reason why it holds.
Probably not a substantial claim. The paper’s conclusions may not depend on it. It may state two separate claims as one.
In the paper
“cardioids (an alternative nomenclature for heart or cardiac organoids) have been reported with a large internal chamber, relevant cardiac cell lineages and single cell transcriptomic analysis20.”
§ Self-assembling human heart organoids for the modeling of cardiac development and congenital heart disease > Introduction
What the sources say
- Not checked yetcites [20] Hofbauer, P. et al. Cardioids reveal self-organizing principles of human cardiogenesis. Cell. 184, 3299–3317 (2021). source
plain- Asserted: passes — The authors put it forward as true.
- Checkable: passes — It can be checked against evidence.
- Load-bearing: fails — The paper’s conclusions may not depend on it.
- Based: passes — The paper gives a reason why it holds.
Probably not a substantial claim. The paper’s conclusions may not depend on it. It may state two separate claims as one.
A conclusion the paper draws from its own results — it cites no other source for it, so there is none to check. The quote shows it is in the paper.
In the paper
“Our method is low-cost when compared to growth factor-based approaches and involves less steps and manipulation than currently existing methods.”
§ Self-assembling human heart organoids for the modeling of cardiac development and congenital heart disease > Introduction
plain- Asserted: passes — The authors put it forward as true.
- Checkable: passes — It can be checked against evidence.
- Load-bearing: fails — The paper’s conclusions may not depend on it.
- Based: fails — The paper may give no reason why it holds.
Probably not a substantial claim. The paper’s conclusions may not depend on it. The paper may give no reason why it holds. It may state two separate claims as one.
None of the sources cited for this claim have been checked yet.
In the paper
“While these approaches allow for high control of the end construct, they tend to be expensive, work-intensive, and not readily scalable.”
§ Self-assembling human heart organoids for the modeling of cardiac development and congenital heart disease > Introduction
What the sources say
- Not checked yetcites [8] Richards, D. J. et al. Inspiration from heart development: biomimetic development of functional human cardiac organoids. Biomaterials 142, 112–123 (2017). source
- Not checked yetcites [9] Richards, D. J. et al. Human cardiac organoids for the modelling of myocardial infarction and drug cardiotoxicity. Nat. Biomed. Eng. 4, 446–462 (2020). source
- Not checked yetcites [10] Fischer, B. et al. A complete workflow for the differentiation and the dissociation of hiPSC-derived cardiospheres. Stem Cell Res. 32, 65–72 (2018). source
- Not checked yetcites [11] Davis, D. R. et al. Validation of the cardiosphere method to culture cardiac progenitor cells from myocardial tissue. PLoS ONE 4, e7195 (2009). source
- Not checked yetcites [12] Ronaldson-Bouchard, K. et al. Advanced maturation of human cardiac tissue grown from pluripotent stem cells. Nature 556, 239–243 (2018). source
- Not checked yetcites [13] Li, Q. et al. Cyborg organoids: implantation of nanoelectronics via organogenesis for tissue-wide electrophysiology. Nano Lett. 19, 5781–5789 (2019). source
- Not checked yetcites [14] Mills, R. J. et al. Functional screening in human cardiac organoids reveals a metabolic mechanism for cardiomyocyte cell cycle arrest. Proc. Natl Acad. Sci. USA 114, E8372–E8381 (2017). source
- Not checked yetcites [15] Ma, Z. et al. Self-organizing human cardiac microchambers mediated by geometric confinement. Nat. Commun. 6, 1–10 (2015). source
plaindirect- Asserted: passes — The authors put it forward as true.
- Checkable: passes — It can be checked against evidence.
- Load-bearing: passes — The paper’s conclusions depend on it.
- Based: passes — The paper gives a reason why it holds.
It may state two separate claims as one.
A conclusion the paper draws from its own results — it cites no other source for it, so there is none to check. The quote shows it is in the paper.
In the paper
“Together, these observations depict a complex and sophisticated human heart organoid model with endocardial lined chambers within myocardial tissue, interspersed with cardiac fibroblasts and a network of endothelial cells, and complete with external epicardial tissue, features that are highly recapitulative of the developing human heart”
§ Self-assembling human heart organoids for the modeling of cardiac development and congenital heart disease > Results > Heart organoids produce multiple cardiac-specific cell lineages
plain- Asserted: passes — The authors put it forward as true.
- Checkable: passes — It can be checked against evidence.
- Load-bearing: passes — The paper’s conclusions depend on it.
- Based: passes — The paper gives a reason why it holds.
It may state two separate claims as one.
A conclusion the paper draws from its own results — it cites no other source for it, so there is none to check. The quote shows it is in the paper.
In the paper
“These data suggest a significant enrichment in the structural and cellular complexity of our hHOs, thus bringing them in line with fetal hearts and further away from monolayer-based differentiation.”
§ Self-assembling human heart organoids for the modeling of cardiac development and congenital heart disease > Results > Transcriptomic analysis reveals hHOs closely model human fetal cardiac development and produce all main cardiac cell lineages
hedgedcorrelational- Asserted: passes — The authors put it forward as true.
- Checkable: passes — It can be checked against evidence.
- Load-bearing: passes — The paper’s conclusions depend on it.
- Based: passes — The paper gives a reason why it holds.
It may state two separate claims as one.
A conclusion the paper draws from its own results — it cites no other source for it, so there is none to check. The quote shows it is in the paper.
In the paper
“Taken together, these data suggest hHO expression profiles are similar to those of fetal hearts, and their global transcriptomes are closer to those of fetal hearts than monolayer protocols, as determined by hierarchical clustering”
§ Self-assembling human heart organoids for the modeling of cardiac development and congenital heart disease > Results > Transcriptomic analysis reveals hHOs closely model human fetal cardiac development and produce all main cardiac cell lineages
hedgedcorrelational- Asserted: passes — The authors put it forward as true.
- Checkable: passes — It can be checked against evidence.
- Load-bearing: passes — The paper’s conclusions depend on it.
- Based: passes — The paper gives a reason why it holds.
It may state two separate claims as one.
A conclusion the paper draws from its own results — it cites no other source for it, so there is none to check. The quote shows it is in the paper.
In the paper
“We also show that our organoid platform can recreate complex metabolic disorders associated with congenital heart defects, as demonstrated by an in vitro model of pregestational diabetes-induced congenital heart defects.”
§ Self-assembling human heart organoids for the modeling of cardiac development and congenital heart disease > Abstract
boosteddirect- Asserted: passes — The authors put it forward as true.
- Checkable: passes — It can be checked against evidence.
- Load-bearing: passes — The paper’s conclusions depend on it.
- Based: passes — The paper gives a reason why it holds.
It may state two separate claims as one.
A conclusion the paper draws from its own results — it cites no other source for it, so there is none to check. The quote shows it is in the paper.
In the paper
“Overall, the resulting hHOs contained significant myocardial tissue with epicardial tissue clustered near the outer surface of the organoids, mimicking the anatomical structure of the developing embryonic heart”
§ Self-assembling human heart organoids for the modeling of cardiac development and congenital heart disease > Results > Self-assembling human heart organoids generated by Wnt signaling modulation
plain- Asserted: passes — The authors put it forward as true.
- Checkable: passes — It can be checked against evidence.
- Load-bearing: passes — The paper’s conclusions depend on it.
- Based: passes — The paper gives a reason why it holds.
It may state two separate claims as one.
What the paper did — it cites no source for this, so there is none to check. The quote shows it is in the paper.
In the paper
“Our hHO differentiation protocol was reproducible across multiple hPSC lines (iPSC-L1, AICS-37-TNNI1-mEGFP, iPSCORE_16_3, H9), all of which exhibited similar differentiation efficiencies, beat metrics, growth rates, and sizes”
§ Self-assembling human heart organoids for the modeling of cardiac development and congenital heart disease > Results > Self-assembling human heart organoids generated by Wnt signaling modulation
plain- Asserted: passes — The authors put it forward as true.
- Checkable: passes — It can be checked against evidence.
- Load-bearing: passes — The paper’s conclusions depend on it.
- Based: passes — The paper gives a reason why it holds.
It may state two separate claims as one.
In the paper
“These results suggest improved structural organization in the developing organoids under BMP4/ActA, in agreement with previously reported differentiation methods using BMP4 and Activin A alone16.”
- Also stated in: § Discussion · plain
“The addition of these growth factors to the initial CHIR exposure in our hHO differentiation protocol led to improved morphological features, such as increased chamber interconnectivity and vascularization.”
§ Self-assembling human heart organoids for the modeling of cardiac development and congenital heart disease > Results > BMP4 and Activin A improve heart organoid chamber formation and vascularization
What the sources say
- Not checked yetcites [16] Andersen, P. et al. Precardiac organoids form two heart fields via Bmp/Wnt signaling. Nat. Commun. 9, 1–13 (2018). source
plaindirect- Asserted: passes — The authors put it forward as true.
- Checkable: passes — It can be checked against evidence.
- Load-bearing: passes — The paper’s conclusions depend on it.
- Based: passes — The paper gives a reason why it holds.
It may state two separate claims as one.
- Also stated in: § Discussion · plain
What the paper did — it cites no source for this, so there is none to check. The quote shows it is in the paper.
In the paper
“Notably, hHOs were successfully derived from four independent iPSC lines and one ESC line, demonstrating reproducibility.”
§ Self-assembling human heart organoids for the modeling of cardiac development and congenital heart disease > Discussion
boostedcorrelational- Asserted: passes — The authors put it forward as true.
- Checkable: passes — It can be checked against evidence.
- Load-bearing: passes — The paper’s conclusions depend on it.
- Based: passes — The paper gives a reason why it holds.
It may state two separate claims as one.
A conclusion the paper draws from its own results — it cites no other source for it, so there is none to check. The quote shows it is in the paper.
In the paper
“suggesting dysfunctional lipid metabolism and a more glycolytic profile (Fig. 7f, Supplementary Fig. 8e).”
§ Self-assembling human heart organoids for the modeling of cardiac development and congenital heart disease > Results > Modeling pregestational diabetes induced CHD
hedged- Asserted: passes — The authors put it forward as true.
- Checkable: passes — It can be checked against evidence.
- Load-bearing: passes — The paper’s conclusions depend on it.
- Based: passes — The paper gives a reason why it holds.
It may state two separate claims as one.
In the paper
“In human hearts, the left ventricle ultimately forms from FHF progenitors, and the atria form from SHF progenitors38.”
§ Self-assembling human heart organoids for the modeling of cardiac development and congenital heart disease > Results > Human heart organoids recapitulate heart field development and atrioventricular specification
What the sources say
- Not checked yetcites [38] Kelly, R. G., Buckingham, M. E. & Moorman, A. F. Heart fields and cardiac morphogenesis. Cold Spring Harb. Perspect. Med. 4, 1–11 (2014). source
plaindirect- Asserted: passes — The authors put it forward as true.
- Checkable: passes — It can be checked against evidence.
- Load-bearing: passes — The paper’s conclusions depend on it.
- Based: passes — The paper gives a reason why it holds.
It may state two separate claims as one.
In the paper
“Cells from the FHF contribute to the linear heart tube formation, followed by migrating cells belonging to the SHF that contribute to further expansion and chamber formation36.”
§ Self-assembling human heart organoids for the modeling of cardiac development and congenital heart disease > Results > Human heart organoids recapitulate heart field development and atrioventricular specification
What the sources say
- Not checked yetcites [36] Brade, T., Pane, L. S., Moretti, A., Chien, K. R. & Laugwitz, K. L. Embryonic heart progenitors and cardiogenesis. Cold Spring Harb. Perspect. Med. 3, 1–18 (2013). source
plaindirect- Asserted: passes — The authors put it forward as true.
- Checkable: passes — It can be checked against evidence.
- Load-bearing: passes — The paper’s conclusions depend on it.
- Based: passes — The paper gives a reason why it holds.
Probably not a substantial claim. It may state two separate claims as one.
A conclusion the paper draws from its own results — it cites no other source for it, so there is none to check. The quote shows it is in the paper.
In the paper
“These conditions lead to the formation of most cardiac lineages in a self-assembling heart organoid with similar properties to the fetal heart.”
- Also stated in: § Discussion · plain
“Heart organoids present multicell type and morphological complexity reminiscent of the developing human fetal heart, including chamber formation, atrioventricular specification, electrophysiological activity and vascularization.”
- Also stated in: § Discussion · hedged
“These data provide a strong indication of the increased complexity of our hHO system and its close resemblance to fetal heart tissue.”
§ Self-assembling human heart organoids for the modeling of cardiac development and congenital heart disease > Discussion
plaincorrelational- Asserted: passes — The authors put it forward as true.
- Checkable: passes — It can be checked against evidence.
- Load-bearing: passes — The paper’s conclusions depend on it.
- Based: passes — The paper gives a reason why it holds.
It may state two separate claims as one.
- Also stated in: § Discussion · plain
In the paper
“HAND1 (FHF) and HAND2 (SHF) are members of the Twist family of basic helix-loop-helix (bHLH) transcription factors that play key roles in the developing heart37.”
§ Self-assembling human heart organoids for the modeling of cardiac development and congenital heart disease > Results > Human heart organoids recapitulate heart field development and atrioventricular specification
What the sources say
- Not checked yetcites [37] George, R. M. & Firulli, A. B. Hand factors in cardiac development. Anat. Rec. 302, 101–107 (2019). source
plain- Asserted: passes — The authors put it forward as true.
- Checkable: passes — It can be checked against evidence.
- Load-bearing: passes — The paper’s conclusions depend on it.
- Based: passes — The paper gives a reason why it holds.
Probably not a substantial claim. It may state two separate claims as one.
A conclusion the paper draws from its own results — it cites no other source for it, so there is none to check. The quote shows it is in the paper.
In the paper
“Taken together, these data suggest that the differentiation of our hHOs involves heart field formation, atrioventricular specification and chamber formation, all of which further emphasizes their recapitulation of human cardiac development.”
§ Self-assembling human heart organoids for the modeling of cardiac development and congenital heart disease > Results > Human heart organoids recapitulate heart field development and atrioventricular specification
hedgeddirect- Asserted: passes — The authors put it forward as true.
- Checkable: passes — It can be checked against evidence.
- Load-bearing: passes — The paper’s conclusions depend on it.
- Based: passes — The paper gives a reason why it holds.
It may state two separate claims as one.
None of the sources cited for this claim have been checked yet.
In the paper
“The growth factors bone morphogenetic protein 4 (BMP4) and Activin A have frequently been used as alternatives to small molecule-mediated Wnt signaling manipulation, since they are the endogenous morphogens that pattern the early embryonic cardiogenic mesoderm and determine heart field specification in vivo16,39–41.”
§ Self-assembling human heart organoids for the modeling of cardiac development and congenital heart disease > Results > BMP4 and Activin A improve heart organoid chamber formation and vascularization
What the sources say
- Not checked yetcites [16] Andersen, P. et al. Precardiac organoids form two heart fields via Bmp/Wnt signaling. Nat. Commun. 9, 1–13 (2018). source
- Not checked yetcites [39] Sa, S. & McCloskey, K. E. Activin A and BMP4 signaling for efficient cardiac differentiation of H7 and H9 human embryonic stem cells. J. Stem Cells Regen. Med. 8, 198–202 (2012). source
- Not checked yetcites [40] Kattman, S. J. et al. Stage-specific optimization of activin/nodal and BMP signaling promotes cardiac differentiation of mouse and human pluripotent stem cell lines. Cell Stem Cell 8, 228–240 (2011). source
- Not checked yetcites [41] Elliott, D. A. et al. NKX2-5eGFP/w hESCs for isolation of human cardiac progenitors and cardiomyocytes. Nat. Methods 8, 1037–1040 (2011). source
plaindirect- Asserted: passes — The authors put it forward as true.
- Checkable: passes — It can be checked against evidence.
- Load-bearing: passes — The paper’s conclusions depend on it.
- Based: passes — The paper gives a reason why it holds.
It may state two separate claims as one.
None of the sources cited for this claim have been checked yet.
In the paper
“These growth factors lead to the induction of cardiac mesoderm in the embryo70 and established differentiation protocols using them show effective differentiation to various cardiac mesoderm progenitors23,70,71.”
§ Self-assembling human heart organoids for the modeling of cardiac development and congenital heart disease > Discussion
What the sources say
- Not checked yetcites [70] Später, D., Hansson, E. M., Zangi, L. & Chien, K. R. How to make a cardiomyocyte. Dev 141, 4418–4431 (2014). source
- Not checked yetcites [23] Breckwoldt, K. et al. Differentiation of cardiomyocytes and generation of human engineered heart tissue. Nat. Protoc. 12, 1177–1197 (2017). source
- Not checked yetcites [71] Kim, M. et al. Activin-A and Bmp4 levels modulate cell type specification during CHIR-induced cardiomyogenesis. PLoS ONE. 10, 1–16 (2015). source
plaindirect- Asserted: passes — The authors put it forward as true.
- Checkable: passes — It can be checked against evidence.
- Load-bearing: fails — The paper’s conclusions may not depend on it.
- Based: passes — The paper gives a reason why it holds.
Probably not a substantial claim. The paper’s conclusions may not depend on it. It may state two separate claims as one.
What the paper did — it cites no source for this, so there is none to check. The quote shows it is in the paper.
In the paper
“Only samples with over 90% viability were used in the assay.”
§ Self-assembling human heart organoids for the modeling of cardiac development and congenital heart disease > Methods > Seahorse metabolic analysis
plain- Asserted: passes — The authors put it forward as true.
- Checkable: passes — It can be checked against evidence.
- Load-bearing: fails — The paper’s conclusions may not depend on it.
- Based: passes — The paper gives a reason why it holds.
Probably not a substantial claim. The paper’s conclusions may not depend on it.
What the paper did — it cites no source for this, so there is none to check. The quote shows it is in the paper.
In the paper
“All PSC lines were validated for pluripotency and genomic stability.”
§ Self-assembling human heart organoids for the modeling of cardiac development and congenital heart disease > Methods > Stem cell culture
plain- Asserted: passes — The authors put it forward as true.
- Checkable: passes — It can be checked against evidence.
- Load-bearing: passes — The paper’s conclusions depend on it.
- Based: fails — The paper may give no reason why it holds.
Probably not a substantial claim. The paper may give no reason why it holds. It may state two separate claims as one.
What the paper did — it cites no source for this, so there is none to check. The quote shows it is in the paper.
In the paper
“Identical numbers of cells were plated for the assay.”
§ Self-assembling human heart organoids for the modeling of cardiac development and congenital heart disease > Methods > Seahorse metabolic analysis
plain- Asserted: passes — The authors put it forward as true.
- Checkable: passes — It can be checked against evidence.
- Load-bearing: fails — The paper’s conclusions may not depend on it.
- Based: passes — The paper gives a reason why it holds.
Probably not a substantial claim. The paper’s conclusions may not depend on it.
What the paper did — it cites no source for this, so there is none to check. The quote shows it is in the paper.
In the paper
“In summary, we describe here a highly reproducible and high-throughput human heart organoid generation method relying on self-assembly triggered by developmental cues and provide proof-of-concept for the modeling of a congenital heart disorder.”
§ Self-assembling human heart organoids for the modeling of cardiac development and congenital heart disease > Discussion
plaindirect- Asserted: passes — The authors put it forward as true.
- Checkable: passes — It can be checked against evidence.
- Load-bearing: passes — The paper’s conclusions depend on it.
- Based: passes — The paper gives a reason why it holds.
It may state two separate claims as one.
In the paper
“Maternal diabetes is one of the most common causes of newborn CHD (up to 12% of newborns from diabetic mothers have some form of CHD88).”
§ Self-assembling human heart organoids for the modeling of cardiac development and congenital heart disease > Discussion
What the sources say
- Not checked yetcites [88] Narchi, H. & Kulaylat, N. Heart disease in infants of diabetic mothers. Images Paediatr. Cardiol. 2, 17–23 (2000).
plaindirect- Asserted: passes — The authors put it forward as true.
- Checkable: passes — It can be checked against evidence.
- Load-bearing: fails — The paper’s conclusions may not depend on it.
- Based: passes — The paper gives a reason why it holds.
Probably not a substantial claim. The paper’s conclusions may not depend on it.
What the paper did — it cites no source for this, so there is none to check. The quote shows it is in the paper.
In the paper
“First, organoids tend to deviate from their normal developmental pathway as a function of time, becoming less relevant the longer they are cultured.”
§ Self-assembling human heart organoids for the modeling of cardiac development and congenital heart disease > Discussion
plaindirect- Asserted: passes — The authors put it forward as true.
- Checkable: passes — It can be checked against evidence.
- Load-bearing: fails — The paper’s conclusions may not depend on it.
- Based: fails — The paper may give no reason why it holds.
Probably not a substantial claim. The paper’s conclusions may not depend on it. The paper may give no reason why it holds.
What the paper did — it cites no source for this, so there is none to check. The quote shows it is in the paper.
In the paper
“The axial resolution of the SD-OCT system was measured to be ~7 mm in tissue.”
§ Self-assembling human heart organoids for the modeling of cardiac development and congenital heart disease > Methods > Optical coherence tomography analysis
plain- Asserted: passes — The authors put it forward as true.
- Checkable: passes — It can be checked against evidence.
- Load-bearing: fails — The paper’s conclusions may not depend on it.
- Based: passes — The paper gives a reason why it holds.
Probably not a substantial claim. The paper’s conclusions may not depend on it.
What the paper did — it cites no source for this, so there is none to check. The quote shows it is in the paper.
In the paper
“All data are presented as mean ± s.d. and represent a minimum of 3 independent experiments with at least 3 technical replicates unless otherwise stated.”
§ Self-assembling human heart organoids for the modeling of cardiac development and congenital heart disease > Methods > Statistics and reproducibility
plain- Asserted: passes — The authors put it forward as true.
- Checkable: passes — It can be checked against evidence.
- Load-bearing: passes — The paper’s conclusions depend on it.
- Based: passes — The paper gives a reason why it holds.
Probably not a substantial claim.
What the paper did — it cites no source for this, so there is none to check. The quote shows it is in the paper.
In the paper
“All micrograph images are representative of at least 6 independent experiments per condition/marker and calcium transient graphs are representative of 6 independent experiments.”
§ Self-assembling human heart organoids for the modeling of cardiac development and congenital heart disease > Methods > Statistics and reproducibility
plain- Asserted: passes — The authors put it forward as true.
- Checkable: passes — It can be checked against evidence.
- Load-bearing: fails — The paper’s conclusions may not depend on it.
- Based: passes — The paper gives a reason why it holds.
Probably not a substantial claim. The paper’s conclusions may not depend on it.
What the paper did — it cites no source for this, so there is none to check. The quote shows it is in the paper.
In the paper
“A 5X objective lens (5X Plan Apo NIR, Mitutoyo) was used to achieve a transverse image resolution of ~7 mm”
§ Self-assembling human heart organoids for the modeling of cardiac development and congenital heart disease > Methods > Optical coherence tomography analysis
plaindirect- Asserted: passes — The authors put it forward as true.
- Checkable: passes — It can be checked against evidence.
- Load-bearing: fails — The paper’s conclusions may not depend on it.
- Based: passes — The paper gives a reason why it holds.
Probably not a substantial claim. The paper’s conclusions may not depend on it.
What the paper did — it cites no source for this, so there is none to check. The quote shows it is in the paper.
In the paper
“All micrograph images are representative of at least 6 independent experiments per condition/marker and calcium transient graphs are representative of 6 independent experiments.”
§ Self-assembling human heart organoids for the modeling of cardiac development and congenital heart disease > Methods > Statistics and reproducibility
plain- Asserted: passes — The authors put it forward as true.
- Checkable: passes — It can be checked against evidence.
- Load-bearing: fails — The paper’s conclusions may not depend on it.
- Based: passes — The paper gives a reason why it holds.
Probably not a substantial claim. The paper’s conclusions may not depend on it.
What the paper did — it cites no source for this, so there is none to check. The quote shows it is in the paper.
In the paper
“The sensitivity of the OCT system was measured as ~104 dB when operating at a 20 kHz A-scan rate.”
§ Self-assembling human heart organoids for the modeling of cardiac development and congenital heart disease > Methods > Optical coherence tomography analysis
plain- Asserted: passes — The authors put it forward as true.
- Checkable: passes — It can be checked against evidence.
- Load-bearing: fails — The paper’s conclusions may not depend on it.
- Based: passes — The paper gives a reason why it holds.
Probably not a substantial claim. The paper’s conclusions may not depend on it.
None of the sources cited for this claim have been checked yet.
In the paper
“successful cardiomyocyte differentiation has been achieved in the past using morphogens such as BMP4 and Activin A21,26.”
§ Self-assembling human heart organoids for the modeling of cardiac development and congenital heart disease > Discussion
What the sources say
- Not checked yetcites [21] Lian, X. et al. Directed cardiomyocyte differentiation from human pluripotent stem cells by modulating Wnt/β-catenin signaling under fully defined conditions. Nat. Protoc. 8, 162–175 (2013). source
- Not checked yetcites [26] Lian, X. et al. Robust cardiomyocyte differentiation from human pluripotent stem cells via temporal modulation of canonical Wnt signaling. Proc. Natl. Acad. Sci. USA 109, 1–10 (2012). source
boosteddirect- Asserted: passes — The authors put it forward as true.
- Checkable: passes — It can be checked against evidence.
- Load-bearing: fails — The paper’s conclusions may not depend on it.
- Based: passes — The paper gives a reason why it holds.
Probably not a substantial claim. The paper’s conclusions may not depend on it.
In the paper
“These epicardial-myocardial interactions are important in mammalian heart development and function, as epicardial cells increase cardiomyocyte growth in 3D engineered heart tissues, and co-transplantation of both cell types into rat hearts increases endothelial cell production63.”
§ Self-assembling human heart organoids for the modeling of cardiac development and congenital heart disease > Discussion
What the sources say
- Not checked yetcites [63] Bargehr, J. et al. Epicardial cells derived from human embryonic stem cells augment cardiomyocyte-driven heart regeneration. Nat. Biotechnol. 37, 895–906 (2019). source
plaindirect- Asserted: passes — The authors put it forward as true.
- Checkable: passes — It can be checked against evidence.
- Load-bearing: passes — The paper’s conclusions depend on it.
- Based: passes — The paper gives a reason why it holds.
It may state two separate claims as one.
In the paper
“Recently, gradient exposures to specific concentrations of BMP4 and Activin A have been studied in the specification of first and second heart field formation16.”
§ Self-assembling human heart organoids for the modeling of cardiac development and congenital heart disease > Discussion
What the sources say
- Not checked yetcites [16] Andersen, P. et al. Precardiac organoids form two heart fields via Bmp/Wnt signaling. Nat. Commun. 9, 1–13 (2018). source
plaincorrelational- Asserted: passes — The authors put it forward as true.
- Checkable: passes — It can be checked against evidence.
- Load-bearing: fails — The paper’s conclusions may not depend on it.
- Based: passes — The paper gives a reason why it holds.
Probably not a substantial claim. The paper’s conclusions may not depend on it.
The paper relies on this without support.
Current cell models are still far from the structural and cellular complexity of the tissues and organs they intend to represent.
“However, current cell models are still far away from the structural and cellular complexity of the tissues and organs they intend to represent (e.g., lack of 3D matrix, disorganized cells, and absence of multicell-type interactions).”
The paper relies on this without support.
The developmental stage of hHOs at day 19 is age-matched to human fetal hearts at gestational days 57–67.
“Heart organoids are comparable to age-matched human fetal cardiac tissues”
“human fetal heart tissue (gestational age days 57–67)33”
The paper relies on this without support.
Pregestational diabetes is associated with a substantially increased risk of congenital heart disease in the first trimester, and the underlying mechanisms are poorly understood in humans.
“Diabetes affects a large sector of the female population in reproductive age and comes associated with significant epidemiological evidence linking it to CHD during the first trimester of pregnancy (up to 12-fold risk increase, 12% vs. 1% risk for healthy females), but little understanding of the underlying mechanisms exists, especially in humans.”
The paper relies on this without support.
All data presented a normal distribution.
“All data presented a normal distribution.”
Claims other papers make about this one
Each is checked against this paper’s own text: does it say what the citing paper says it does?
The cited source says what the claim attributes to it.
In the citing paper
“Self-assembling human cardiac organoids have also been used to show the role of BMP4 and Activin A to improve heart organoid chamber formation and vascularization [60].”
From Utility of iPSC-Derived Cells for Disease Modeling, Drug Development, and Cell Therapy (2022) · cites this paper as [60]
The cited source says what the claim attributes to it.
In the citing paper
“However, models of cardiovascular disease lag behind other organ models,[ 9 ] often failing to mimic pulsatile flow and thus lacking a fundamental characteristic of human cardiac function.[ 13 , 14 ]”
From Engineered in vitro multi-cell type ventricle model generates long-term pulsatile flow and modulates cardiac output in response to cardioactive drugs (2025) · cites this paper as [9]
Self-check
Percentages, sums and reported differences re-computed from the paper’s own numbers.
Each contradiction between two passages listed here was confirmed by an independent check.
Rated minor: it would not touch a result — a value no result rests on, a p-value that stays on the same side of the significance level, or a conflict that is clerical, resolved elsewhere in the paper, or outside its own findings.
In the paper
§ Self-assembling human heart organoids for the modeling of cardiac development and congenital heart disease > Results > Human heart organoids recapitulate heart field development and atrioventricular specification
“Immunofluorescence of day 7 hHO cryosections showed well-differentiated regions of HAND1 and HAND2 (Fig. 4a) cells in the same organoid”
§ Self-assembling human heart organoids for the modeling of cardiac development and congenital heart disease > Results > Human heart organoids recapitulate heart field development and atrioventricular specification
“a Confocal immunofluorescent images of two representative hHO cryosections on day 8 of differentiation”
Rated minor: it would not touch a result — a value no result rests on, a p-value that stays on the same side of the significance level, or a conflict that is clerical, resolved elsewhere in the paper, or outside its own findings.
In the paper
§ Self-assembling human heart organoids for the modeling of cardiac development and congenital heart disease > Results > Modeling pregestational diabetes induced CHD
“Compared with normal glycemia conditions, diabetic hHOs showed decreased MYL2 + ventricular cardiomyocytes and enlarged MYL7 + atrial cardiomyocyte regions, indicative of structural defects such as those observed in CHD (Fig. 7g, Supplementary Fig. 8f).”
§ Self-assembling human heart organoids for the modeling of cardiac development and congenital heart disease > Results > Modeling pregestational diabetes induced CHD
“g Confocal immunofluorescence images at differentiation day 15 for cardiac (TNNT2, red) and epicardial (WT1, green) formation, scale bar: 500 µm. h Confocal imaging for ventricular (MYL2, green) and atrial (MYL7, red) chamber formation under normal and diabetic-like conditions, scale bar: 500 µm.”
Rated minor: it would not touch a result — a value no result rests on, a p-value that stays on the same side of the significance level, or a conflict that is clerical, resolved elsewhere in the paper, or outside its own findings.
In the paper
§ Self-assembling human heart organoids for the modeling of cardiac development and congenital heart disease > Results > Modeling pregestational diabetes induced CHD
“Immunofluorescence for myocardial and epicardial markers revealed a drastic difference in the morphological organization as PGDHOs contained epicardial tissue surrounded by myocardial tissue, whereas NHOs contained epicardial tissue on top of or beside myocardial tissue as physiologically expected (Fig. 7h).”
§ Self-assembling human heart organoids for the modeling of cardiac development and congenital heart disease > Results > Modeling pregestational diabetes induced CHD
“g Confocal immunofluorescence images at differentiation day 15 for cardiac (TNNT2, red) and epicardial (WT1, green) formation, scale bar: 500 µm. h Confocal imaging for ventricular (MYL2, green) and atrial (MYL7, red) chamber formation under normal and diabetic-like conditions, scale bar: 500 µm.”
Citations
Cites
Ultrasensitive fluorescent proteins for imaging neuronal activity
Chen, T.-W., Wardill, T. J., Sun, Y., Pulver, S. R., Renninger, S. L., Baohan, A., Schreiter, E. R., Kerr, R. A., Orger, M. B., Jayaraman, V., et al. (2013) · Nature · doi:10.1038/nature12354 · Cited by 6,474
Oxidative stress and diabetic complications
Giacco, F., & Brownlee, M. (2010) · Circulation Research · doi:10.1161/circresaha.110.223545 · Cited by 5,461
Diagnosis and classification of diabetes mellitus
American Diabetes Association (2009) · Diabetes Care · doi:10.2337/dc09-s062 · Cited by 1,817
Lian, X., Zhang, J., Azarin, S. M., Zhu, K., Hazeltine, L. B., Bao, X., Hsiao, C., Kamp, T. J., & Palecek, S. P. (2013) · Nature Protocols · doi:10.1038/nprot.2012.150 · Cited by 1,748
Lian, X., Hsiao, C., Wilson, G., Zhu, K., Hazeltine, L. B., Azarin, S. M., Raval, K. K., Zhang, J., Kamp, T. J., & Palecek, S. P. (2012) · Proceedings of the National Academy of Sciences · doi:10.1073/pnas.1200250109 · Cited by 1,717
Kidney organoids from human iPS cells contain multiple lineages and model human nephrogenesis
Takasato, M., Er, P. X., Chiu, H. S., Maier, B., Baillie, G. J., Ferguson, C., Parton, R. G., Wolvetang, E. J., Roost, M. S., Chuva de Sousa Lopes, S. M., et al. (2015) · Nature · doi:10.1038/nature15695 · Cited by 1,627
Chemically defined generation of human cardiomyocytes
Burridge, P. W., Matsa, E., Shukla, P., Lin, Z. C., Churko, J. M., Ebert, A. D., Lan, F., Diecke, S., Huber, B., Mordwinkin, N. M., et al. (2014) · Nature Methods · doi:10.1038/nmeth.2999 · Cited by 1,606
Revisiting Cardiac Cellular Composition
Pinto, A. R., Ilinykh, A., Ivey, M. J., Kuwabara, J. T., D’Antoni, M. L., Debuque, R., Chandran, A., Wang, L., Arora, K., Rosenthal, N. A., et al. (2016) · Circulation Research · doi:10.1161/circresaha.115.307778 · Cited by 1,400
Advanced maturation of human cardiac tissue grown from pluripotent stem cells
Ronaldson-Bouchard, K., Ma, S. P., Yeager, K., Chen, T., Song, L., Sirabella, D., Morikawa, K., Teles, D., Yazawa, M., & Vunjak-Novakovic, G. (2018) · Nature · doi:10.1038/s41586-018-0016-3 · Cited by 1,272
An in vivo model of functional and vascularized human brain organoids
Mansour, A. A., Gonçalves, J. T., Bloyd, C. W., Li, H., Fernandes, S., Quang, D., Johnston, S., Parylak, S. L., Jin, X., & Gage, F. H. (2018) · Nature Biotechnology · doi:10.1038/nbt.4127 · Cited by 1,211
Research works printed but not linked: 2
- Scott F. & Gilbert, M. J. F. B. Lateral Plate Mesoderm: Heart and Circulatory System. In Developmental Biology 591–610 (Sinauer Associates is an imprint of Oxford University Press, 2019).
- Eilers, P. H., & Boelens, H. F. Baseline correction with asymmetric least squares smoothing. Leiden University Medical Centre Report. 1, 5 (2005).
Cited by
Sorted by citations
Items 301–400 of 523
Cardiac Development, Cellular Composition and Function: From Regulatory Mechanisms to Applications
Zhao, H., Jiang, J.-B., Wang, S., & Miao, C. (2025) · Cells · doi:10.3390/cells14171390 · Cited by 5
Vesmaker, K., Venkadakrishnan, J., & Dhar, A. (2025) · European Journal of Pharmacology · doi:10.1016/j.ejphar.2025.178356 · Cited by 4
Zhao, K., Tang, B., Gu, R., Liu, C., Zhang, H., Gao, Y., Wang, P., Gu, Y., Mingfei, S., & Li, Z. (2026) · Cardiovascular Diabetology · doi:10.1186/s12933-026-03086-3 · Cited by 4
3D Cardiac Constructs in Drug Discovery: Current Advances and Future Challenges
Liu, C., Guo, J., Mirzayeva, G., Spanos, M., Teng, R., Li, G., Crețoiu, D., Chen, Z., & Xiao, J. (2026) · Research · doi:10.34133/research.1165 · Cited by 5
Branco, M. A., Marzec, J., Nunes, M. M., Bica, M., Rayagra, A. L., Tenreiro, M. F., Cabral, J. M. S., & Diogo, M. M. (2026) · iScience · doi:10.1016/j.isci.2026.115071 · Cited by 4
Enhancing Maturation of Human Neuromuscular Organoids via Electrical Stimulation
Moysidou, C., Martins, I. B., El‐Shimy, I. A., Bicci, I., Cea, D., Bukas, C., Mekki, I., Rusu, M.-C., Nebol, A., Lahmann, I., et al. (2026) · Advanced Science · doi:10.1002/advs.202522762 · Cited by 4
Recent Technological Innovations to Promote Cardiovascular Research
Yuasa, S. (2022) · Circulation Journal · doi:10.1253/circj.cj-21-0978 · Cited by 4
Metabolic Remodeling during Early Cardiac Lineage Specification of Pluripotent Stem Cells
Bobori, S. N., Zhu, Y., Saarinen, A. M., Liuzzo, A. J., & Folmes, C. D. L. (2023) · Metabolites · doi:10.3390/metabo13101086 · Cited by 4
Lu, X., Perr, E., Naqvi, T., Galitz, D., Andersen, M., Grabowski, D. C., Person, A. D., Kalyuzhny, A. E., & Flynn, K. C. (2024) · Cells · doi:10.3390/cells13181566 · Cited by 4
Beyond genomic studies of congenital heart defects through systematic modelling and phenotyping
Henderson, D. J., Alqahtani, A., Chaudhry, B., Cook, A. C., Eley, L., Houyel, L., Hughes, M. L., Keavney, B. D., de la Pompa, J. L., Sled, J. G., et al. (2024) · Disease Models & Mechanisms · doi:10.1242/dmm.050913 · Cited by 5
Kostina, A. S., Kiselev, A. M., Huang, A., Lankerd, H., Caywood, S., Jurado-Fernandez, A., Volmert, B. D., O’Hern, C., Juhong, A., Liu, Y., et al. (2024) · bioRxiv (Cold Spring Harbor Laboratory) · doi:10.1101/2024.12.11.627627 · Cited by 4
Self-citationKuckelkorn, C., Aksoy, E., Stojanovic, N., Oulahyane, L., Ritter, M., Pfannkuche, K., & Fischer, H. (2025) · Advanced Healthcare Materials · doi:10.1002/adhm.202403897 · Cited by 3
Xu, X., Zhang, Y., Geng, Y., Luo, Y., & Sun, X. (2025) · Frontiers in Pharmacology · doi:10.3389/fphar.2025.1650200 · Cited by 3
In vitro modeling of cell types in cardiogenesis and congenital heart disease
Ranade, S. S. (2025) · Seminars in Cell and Developmental Biology · doi:10.1016/j.semcdb.2025.103656 · Cited by 3
Hou, Y., Cao, C. Q., Guo, J., Du, P., Li, D., Yuan, P., Wu, Y., Su, M., Kong, T., Cui, X., et al. (2025) · Advanced Healthcare Materials · doi:10.1002/adhm.202502698 · Cited by 3
Unraveling Cardiovascular Development and Function: Insights From Single-Cell Omics
Harper, R. L., Lelliott, P. M., Bender, S. B., & Pinto, A. R. (2026) · Circulation Research · doi:10.1161/circresaha.125.325793 · Cited by 4
Current Trends in Duchenne Muscular Dystrophy Research and Therapy: 3D Cardiac Modelling
Przymuszała, M., Białobrzeska, M., Dulak, J., & Florczyk, U. (2026) · Journal of Cachexia Sarcopenia and Muscle · doi:10.1002/jcsm.70180 · Cited by 3
Modelling Cardiovascular Diseases Using Human Microphysiological Systems
Ribeiro, Q., Lopes, E., Ferreira, I. S., Simões, C. G., Vital, C. M., Inácio, J. M., Belo, J. A., Rybak‐Wolf, A., Marques, A. R. A., & Vieira, O. V. (2026) · BioChip Journal · doi:10.1007/s13206-025-00247-6 · Cited by 4
Organoid models: Regulations and prospects for the development of investigational new drugs
Li, H., Pan, Y., Zheng, Z., Lin, R., Pan, Y., Lin, L., Quan, M., Lu, H., Hu, Z., Zheng, M., et al. (2026) · Chinese Medical Journal · doi:10.1097/cm9.0000000000004067 · Cited by 4
Guo, Z., & Nenghua, Z. (2026) · Frontiers in Cell and Developmental Biology · doi:10.3389/fcell.2026.1721946 · Cited by 3
Guiding the spatial organization of engineered heart tissues
Beeghly, G. F., Shakeri, A., Mirzapourshafiyi, F., Dikyol, C., Offen, N., Alsaafin, A., Nuber, U. A., & Radisic, M. (2026) · Advanced Drug Delivery Reviews · doi:10.1016/j.addr.2026.115907 · Cited by 3
Organoids, Biocybersecurity, and Cyberbiosecurity—A Light Exploration
Palmer, X., Akafia, C. S. K., Woodson, E., Woodson, A., & Potter, L. N. (2024) · Organoids · doi:10.3390/organoids3020007 · Cited by 3
Mostert, D., Ferron, S., Olmeda, C. V., Rampazzo, A., & Calore, M. (2025) · Heart Rhythm · doi:10.1016/j.hrthm.2025.08.012 · Cited by 3
Controlling Morphology and Functions of Cardiac Organoids by Two-Dimensional Geometrical Templates
Hoang, P., Sun, S., Tarris, B. A., & Ma, Z. (2022) · Cells Tissues Organs · doi:10.1159/000521787 · Cited by 3
Application of hiPSC as a Drug Tester Via Mimicking a Personalized Mini Heart
Wei, L., Xia, S., Li, Y., Qi, Y., Wang, Y., Zhang, D., Hua, Y., & Luo, S. (2022) · Frontiers in Genetics · doi:10.3389/fgene.2022.891159 · Cited by 3
Dias, T. P., Pinto, S. N., Carvalho, S., Fernandes, T. G., Fernandes, F., Diogo, M. M., Peleteiro, M. C., PRIETO, M. J. E., & Cabral, J. M. S. (2022) · International Journal of Molecular Sciences · doi:10.3390/ijms232415785 · Cited by 3
Lu, R. X. Z., Zhao, Y., & Radisic, M. (2023) · Bioengineering & Translational Medicine · doi:10.1002/btm2.10581 · Cited by 3
Cardiac Disease Modeling with Engineered Heart Tissue
Cai, L., Wang, R., & Zhang, D. (2023) · Handbook of experimental pharmacology · doi:10.1007/164_2023_681 · Cited by 3
Control of coronary vascular cell fate in development and regeneration
McCracken, I. R., & Smart, N. (2023) · Seminars in Cell and Developmental Biology · doi:10.1016/j.semcdb.2023.08.005 · Cited by 3
Organoids—the key to novel therapies for the inner ear?
Diensthuber, M., & Stöver, T. (2024) · HNO · doi:10.1007/s00106-023-01367-x · Cited by 4
Deciphering Congenital Heart Disease Using Human Induced Pluripotent Stem Cells
Zhang, H., & Wu, J. C. (2024) · Advances in experimental medicine and biology · doi:10.1007/978-3-031-44087-8_13 · Cited by 3
Progress of 3D Organoid Technology for Preclinical Investigations: Towards Human In Vitro Models
Liu, Y., Xu, H., Abraham, S., Wang, X., & Keavney, B. D. (2022) · International Journal of Drug Discovery and Pharmacology · doi:10.53941/ijddp.v1i1.188 · Cited by 4
McIntire, E. M., Barr, K., Gonzales, N. M., Allen, O. L., & Gilad, Y. (2023) · bioRxiv (Cold Spring Harbor Laboratory) · doi:10.1101/2023.07.21.550072 · Cited by 3
Kostina, A. S., Kiselev, A. M., Huang, A., Lankerd, H., Caywood, S., Jurado-Fernandez, A., Volmert, B. D., O’Hern, C., Juhong, A., Liu, Y., et al. (2024) · SSRN Electronic Journal · doi:10.2139/ssrn.5063613 · Cited by 5
Self-citationHuman Cardiac Organoids: Quantification and Qualification in Cardiovascular Studies
Liu, Y., Abraham, S., & Xu, H. (2024) · International Journal of Drug Discovery and Pharmacology · doi:10.53941/ijddp.2024.100017 · Cited by 2
Transplantation of Islet Organoids into Brown Adipose Tissue in a Diabetic Mouse Model
Sun, A., Singh, M., Bamrah, M., Li, W., Aguirre, A., & Wang, P. (2024) · Methods in molecular biology · doi:10.1007/7651_2024_588 · Cited by 2
Self-citationPluripotent stem cell-derived cardiomyocyte transplantation: marching from bench to bedside
Yi, H., Liu, J., Wang, W., Li, H., Kong, W., Li, X., Zhang, W., Pahlavan, S., Tang, Y., Wang, X., et al. (2025) · Science China Life Sciences · doi:10.1007/s11427-024-2801-x · Cited by 2
Updated Applications of Stem Cells in Hypoplastic Left Heart Syndrome
Xiao, R., Darr, H., Khan, Z., & Xiao, Q. (2025) · Cells · doi:10.3390/cells14171396 · Cited by 2
Wheelock, J. M., Pritchard, R., Kumar, S., & Lu, H. (2025) · Biophysical Journal · doi:10.1016/j.bpj.2025.09.015 · Cited by 2
Xiong, Q., Xue, J., Xu, D., Fang, J., Lyu, X., Yuan, Q., Chen, W., Gao, Z., Hu, N., & Qin, C. (2025) · Biosensors and Bioelectronics · doi:10.1016/j.bios.2025.118267 · Cited by 2
Integrating synthetic biology to understand and engineer the heart, lung, blood, and sleep systems
Chaikof, E. L., Chen, J., Gillette, M. U., Boyer, L. A., Deans, T. L., Li, P., Hilton, I. B., Daniels, K. G., Goyal, Y., Mei, Y., et al. (2025) · Cell Systems · doi:10.1016/j.cels.2025.101446 · Cited by 2
Grumelot, S., Mannering, F. L., Campbell, N., Ashokkumar, M. S., Howard, E., Serpooshan, V., Asgari, M., Latifi, N., Vali, H., Aguirre, A., et al. (2026) · Chemical Engineering Journal · doi:10.1016/j.cej.2026.172977 · Cited by 2
Self-citationAdvances in Quality Control of Tumor Organoid Living Biobanks
Fan, R., Zhou, S., An, P., Ye, X., Yu, M., Wang, Y., & Wu, C. (2026) · Biopreservation and Biobanking · doi:10.1177/19475535261416482 · Cited by 2
Mechanisms and Therapeutic Potential of Human Cardiomyocyte Proliferation
McLane, R. D., Cheruku, A., Williams, A. B., & Karra, R. (2026) · Journal of Cardiovascular Development and Disease · doi:10.3390/jcdd13020074 · Cited by 2
Kaushik, A., Mishra, D. T. P., Solanki, R., & Bhatia, D. D. (2026) · ACS Pharmacology & Translational Science · doi:10.1021/acsptsci.5c00630 · Cited by 2
Jiang, L., Wang, Y., Li, H., & Yang, Y. (2026) · Journal of Biomedical Research · doi:10.7555/jbr.39.20250533 · Cited by 2
Wang, B., Zhang, J., Jiang, J., Cheng, C., & Zhao, Y. (2026) · iScience · doi:10.1016/j.isci.2026.115519 · Cited by 2
Organoids in environmental toxicology: Applications, advantages, and future prospects
Wang, T., Shi, W. S., & Ying, G. (2026) · Comparative Biochemistry and Physiology Part C Toxicology & Pharmacology · doi:10.1016/j.cbpc.2026.110526 · Cited by 2
Phase separation-engineered cell assembly into functional tissue architecture
Chen, C., Gu, X., Liao, Z., Wang, A., Xie, D., Dong, L., Chen, G., Yuan, J., Tanaka, H., & Wang, C. (2026) · Cell Biomaterials · doi:10.1016/j.celbio.2026.100451 · Cited by 2
Zou, X., Wang, F., Zheng, H., Liu, X., Kong, T., Jiang, R., Guo, Y., Liang, Y., Zhao, H., Wang, B., et al. (2026) · Nature Communications · doi:10.1038/s41467-026-73822-6 · Cited by 2
Tan, Z., Qi, Y., Chen, Y., Zhang, L., Li, C., Lei, B., Xiao, Z., Zhang, J., Lu, L., & Wang, H. (2026) · Circulation · doi:10.1161/circulationaha.126.078188 · Cited by 2
Upadhyaya, P. (2026) · Stem Cells · doi:10.1093/stmcls/sxag039 · Cited by 2
Sun, A., Kenyon, E., Gudi, M., Li, W., Aguirre, A., & Wang, P. (2022) · Methods in molecular biology · doi:10.1007/978-1-0716-2807-2_14 · Cited by 2
Self-citationEquations describing semi-confluent cell growth (I) Analytical approximations
Hall, D. R. (2023) · Biophysical Chemistry · doi:10.1016/j.bpc.2024.107173 · Cited by 2
Methods for Generating Self-Organizing Human Patterned Heart Organoids Using Pluripotent Stem Cells
Volmert, B. D., & Aguirre, A. (2024) · Methods in molecular biology · doi:10.1007/7651_2024_545 · Cited by 3
Self-citationAdvances in Organ-on-a-chip Technologies for Biomedical Research and Applications
Zhu, Q., Liao, M., Hu, Y., & Chai, R. (2025) · Materials Lab · doi:10.54227/mlab.20240006 · Cited by 2
Li, J., Liu, D., Gao, Z., Sun, M., Wang, S., Zhang, L., Yang, Y., Wang, H., Zheng, H., Tian, Y., et al. (2025) · Cell Reports Physical Science · doi:10.1016/j.xcrp.2025.102604 · Cited by 2
Wang, C., Bai, R., Jiang, H., Wu, F., Liu, Y., Yin, Y., Jia, J., & Song, Y. (2025) · Biochemical and Biophysical Research Communications · doi:10.1016/j.bbrc.2025.152140 · Cited by 2
Human Heart Organoid-derived Extracellular Vesicles for Cardiac Intercellular Communication
Rudsari, H. K., O’Hern, C., Ural, E. E., Damrath, M., Neeb, E., Zoofaghari, M., Veletić, M., Louch, W. E., Aguirre, A., Balasingham, I., et al. (2023) · ACM International Conference on Nanoscale Computing and Communication (NANOCOM) · doi:10.1145/3576781.3608718 · Cited by 2
Self-citationKlasen, L., Mork, M., Nasehi, R., Krishnamurthy, V. T., Zeevaert, K., Babendreyer, A., Russo, J. D., Wagner, W., & Laporte, L. D. (2026) · Advanced Materials · doi:10.1002/adma.75116 · Cited by 2
Gao, W., Hu, P., Wick, B. D., Qiu, Q., Zhang, H., Li, Y., Kang, X., Bedi, K. C., Haeussler, M., Sasaki, K., et al. (2026) · Genome biology · doi:10.1186/s13059-026-04061-7 · Cited by 4
Seguret, M., Davidson, P. M., Robben, S., Jouve, C., Pereira, C., Cerveau, C., Berre, M. L., Ribeiro, R. S. R., & Hulot, J. (2023) · eLife · doi:10.7554/elife.87739.1 · Cited by 2
Zhong, Q., He, Y., Li, T., Zhang, Y., Zhang, T., Zhang, Y., Li, Q., Zhao, B., Chen, D., & Zhong, Z. (2023) · bioRxiv (Cold Spring Harbor Laboratory) · doi:10.1101/2023.08.26.554935 · Cited by 2
Ichimura, T., Kakizuka, T., Sato, Y., Itano, K., Seiriki, K., Hashimoto, H., Itoga, H., Onami, S., & Nagai, T. (2024) · eLife · doi:10.7554/elife.93633.1 · Cited by 2
Zou, X., Wang, F., Zheng, H., Kong, T., & Pei, D. (2024) · bioRxiv (Cold Spring Harbor Laboratory) · doi:10.1101/2024.07.25.605044 · Cited by 2
Hyaluronan Underlies the Emergence of Form, Fate, and Function in Human CardioidsPreprint
Jahnel, S. M., Dimitriadi, A., Kodnar, J., Gerakopoulos, V., Khurana, Y., Mayrhauser, M., Ilmer, T., Elaguech, M. A., Hall, A. R., Ishihara, K., et al. (2026) · bioRxiv (Cold Spring Harbor Laboratory) · doi:10.64898/2026.01.26.700345 · Cited by 2
Lee, S.-J., & Lee, H. (2024) · Organoid · doi:10.51335/organoid.2024.4.e6 · Cited by 1
Kim, A. R., Hong, S. J., Lee, H., & Lee, N. (2024) · Lab on a Chip · doi:10.1039/d4lc00680a · Cited by 1
Luck, J. N., D’Mello, A., Chembilikandy, V., Lane, J. R., Kruckow, K. L., Martínez, E., Rodriguez, E., Mohasin, M., Berg, I., Porter, K. D., et al. (2025) · Cell Reports · doi:10.1016/j.celrep.2025.116574 · Cited by 1
Forbes, C. A., Shaw, N. C., Chen, K. G., Hedges, M. G., Er, T., Hool, L. C., Ward, M., Poulton, C. J., Baynam, G. S., Lassmann, T., et al. (2026) · Human Genomics · doi:10.1186/s40246-025-00907-6 · Cited by 1
Cell-Based Computational Models of Organoids: A Systematic Review
Neagu, M., Robu, A., Arjoca, S., & Neagu, A. (2026) · Cells · doi:10.3390/cells15020177 · Cited by 1
Murali, P., & Meenatchi, S. (2026) · Engineering Reports · doi:10.1002/eng2.70687 · Cited by 1
Shitiri, N. C., Le, T., Yoo, S. J., Cho, M., Kim, Y. C., Ahn, Y., & Lee, C. (2026) · Biomedical Optics Express · doi:10.1364/boe.586959 · Cited by 1
Disease modelling with in vitro vascularised organoids
Kan, C., Liu, L., & Sugimura, R. (2026) · Disease Models & Mechanisms · doi:10.1242/dmm.052769 · Cited by 1
Hou, C., Zhang, Q., Zhang, Z., Lin, X., Pan, H., Wang, F., Lou, J., Miao, L., Song, B., Wang, J., et al. (2026) · Stem Cell Research & Therapy · doi:10.1186/s13287-026-05079-1 · Cited by 1
What’s in a niche? Elucidating the role of the ECM in cell fate commitment
Amel, A., & Alemany, A. (2026) · Current Opinion in Genetics & Development · doi:10.1016/j.gde.2026.102528 · Cited by 1
Voges, H. K., Durrant-Whyte, J., See, M., Iaprintsev, V., Yeow, S., Parker, B. L., Bibby, K., Keen, E., King, I., Piers, A. T., et al. (2026) · Cell stem cell · doi:10.1016/j.stem.2026.07.010 · Cited by 1
Towards advanced regenerative therapeutics to tackle cardio-cerebrovascular diseases
Chen, X., Lin, W., & Tortorella, M. D. (2025) · American Heart Journal Plus Cardiology Research and Practice · doi:10.1016/j.ahjo.2025.100520 · Cited by 1
Shepherd, J. H. (2025) · Biomimetics · doi:10.3390/biomimetics10040204 · Cited by 1
Wagner, K. T., Bannerman, D., Wu, Q., Pascual‐Gil, S., Fernandes, I. M., Vargas, L. F. J., Yan, S., Khosravi, R., Okhovatian, S., Abdo, D., et al. (2026) · Materials Today Bio · doi:10.1016/j.mtbio.2026.103236 · Cited by 1
Tang, H., Zhang, W., Jing, M., Zhou, S., & Xu, J. (2025) · BMC Cardiovascular Disorders · doi:10.1186/s12872-025-05198-2 · Cited by 1
Wang, B., & Zhang, C. (2025) · Journal of Visualized Experiments · doi:10.3791/68738 · Cited by 1
Challenges and opportunities for cardiac organoids: A comprehensive review
Xiao, Y., Zhuang, Z., Shi, X., & Wu, F. (2025) · Regenesis repair rehabilitation. · doi:10.1016/j.rerere.2025.12.004 · Cited by 1
Vital, C. M., Inácio, J. M., Carvalho, A. S., Beck, H. C., Matthiesen, R., & Belo, J. A. (2026) · International Journal of Molecular Sciences · doi:10.3390/ijms27020981 · Cited by 1
Broadbent, S. D., Bhagwan, J. R., Olusoga, T., & Barnes, A. A. (2026) · Biochemical Society Transactions · doi:10.1042/bst20253028 · Cited by 1
Size‐Modulated Mesoderm‐Endoderm Divergence and Myocardial Cavitation in Micropatterned Cardioids
Hoang, P., McKellar, D. W., Kowalczewski, A. C., Mai Nhu, Y., Chai, M., Lian, X. L., Zheng, Y., Amack, J. D., Tucker, N. R., Vlaminck, I. D., et al. (2026) · Advanced Science · doi:10.1002/advs.202515661 · Cited by 1
Yang, H., Zeng, Y., Teng, Y., Zhao, Q., Hou, M., Cheng, Z., & Wang, X. Y. (2026) · Stem Cell Research & Therapy · doi:10.1186/s13287-026-04996-5 · Cited by 1
Ishikawa, T., Clark, C. W., Tapaswi, A., Sala-Hamrick, K. E., Herron, T. J., Jiménez‐Vázquez, E. N., Jain, A., Jones, D. K., Colacino, J. A., da Rocha, A. M., et al. (2026) · Toxicological Sciences · doi:10.1093/toxsci/kfag107 · Cited by 1
Nguyen, C. C., Thorpe, J., Dang, T. B., Zahabi, A., Nguyen, Q. A., Zhao, S., Doan, N. M., Listyawan, M. A., Chen, H., Nguyen, T. V., et al. (2026) · Nature Sensors · doi:10.1038/s44460-026-00087-3 · Cited by 1
Cardiac Organoids Uncover an Association of CHD7 Deficiency with Congenital Heart Disease
Sun, S., Feng, Z., Na, W., Gao, Y., Min, S., Zhuang, Q., Lin, S., Zhao, Q., Huang, X., Song, H., et al. (2026) · Phenomics · doi:10.1007/s43657-026-00319-z · Cited by 1
Human iPSC-derived heart valve-like assembloids model valve development and disease pathology
He, Y., Jalili, A., Jones, C. B., He, H., Beni, L., Lamont, D. N., Hu, J., Yost, M., Davidson, L. A., Zheng, S., et al. (2026) · Cell stem cell · doi:10.1016/j.stem.2026.07.011 · Cited by 1
A fluctuation test for gastruloid heterogeneity
Regalado, S. G., 邱, 承., Kottapalli, S., Huynh, C., Daza, R. M., Keith, A., Park, J., Martin, B., Chen, W., Liao, H., et al. (2026) · Cell · doi:10.1016/j.cell.2026.09.057 · Cited by 1
Chang, X., Gu, M., & Tchieu, J. H. (2022) · Cells · doi:10.3390/cells11030460 · Cited by 1
Organoide – der Schlüssel zu neuen Therapien für das Innenohr?
Diensthuber, M., & Stöver, T. (2023) · HNO · doi:10.1007/s00106-023-01366-y · Cited by 1
Organoids As a Tool to Fuel Basic Medical Research
Zhang, Y. (2023) · Journal of Complementary Medicine & Alternative Healthcare · doi:10.19080/jcmah.2023.11.555823 · Cited by 1
Collagen Hollow Microbeads for Engineered Hollow Organ Model in Vitro
Abeta, S., Masuda, A., Hioki, A., Shoji, K. H., & Onoe, H. (2024) · IEEE International Conference on Micro Electro Mechanical Systems (MEMS) · doi:10.1109/mems58180.2024.10439325 · Cited by 1
In vitro toxicology: Next generation models and methods to improve safety evaluation
Fortin, M. C., & Szilagyi, J. T. (2023) · Springer eBooks · doi:10.1007/978-3-030-73317-9_120-1 · Cited by 2
Cardiac organoids do not warrant additional moral scrutiny
Simons, J., van der Graaf, R., & van Delden, J. J. M. (2024) · BMC Medical Ethics · doi:10.1186/s12910-024-01064-6 · Cited by 1
In Vitro Models of Cardiovascular Disease: Embryoid Bodies, Organoids and Everything in Between
Stougiannou, T. M., Christodoulou, K. C., & Karangelis, D. (2024) · Biomedicines · doi:10.3390/biomedicines12122714 · Cited by 1
Lin, H., Cheng, J., Zhu, C., Yang, Z., Shen, Q., Zou, Y., Huang, Y., Lv, F., Bai, H., & Wang, S. (2025) · Angewandte Chemie · doi:10.1002/ange.202503252 · Cited by 1
Metadata
- Authors
- Lewis-Israeli, Y. R., Wasserman, A. H., Gabalski, M. A., Volmert, B. D., Ming, Y., Ball, K. A., Yang, W., Zou, J., Ni, G., Pajares, N., Chatzistavrou, X., Li, W., Zhou, C., & Aguirre, A.
- Affiliations
- Michigan State University (US)
- Washington University in St. Louis (US)
- ORCID
- Venue
- Nature Communications
- Published
- 2021-08-26
- Volume
- 12
- Issue
- 1
- Pages
- 5142-5142
- ISSN
- 2041-1723 (ISSN-L)
- PMC
- PMC8390749
- OpenAlex
- W3113822795
- Semantic Scholar
- 91a81864d4ccfc2cf918084c7bfec9df49ea139c
- Cited by
- 536
- References
- 95
- Citations by year
- 2026: 128 · 2025: 126 · 2024: 106 · 2023: 86 · 2022: 81 · 2021: 8
- FWCI
- 21.94
- Type
- journal article
- Language
- en
- Open access
- gold
- doi.org
- Locations
- Nature Communications (publishedVersion, cc-by)
- Research Square (acceptedVersion, cc-by)
- Europe PMC (PubMed Central) (publishedVersion, other-oa)
- PubMed Central (publishedVersion, cc-by)
- PubMed (publishedVersion)
- RePEc: Research Papers in Economics (submittedVersion)
- DOAJ (DOAJ: Directory of Open Access Journals) (submittedVersion, cc-by-sa)
- Figshare (submittedVersion, cc-by)
- Health Research Alliance (cc-by)
- Funders
- American Heart Association (19IPLOI34660342)
- U.S. Department of Health & Human Services | NIH | National Heart, Lung, and Blood Institute (K01HL135464, R01EB025209)
- National Science Foundation (ECCS-2024270)
- Topics
- Life Sciences › Biochemistry, Genetics and Molecular Biology › Molecular Biology › Pluripotent Stem Cells Research
- Life Sciences › Biochemistry, Genetics and Molecular Biology › Molecular Biology › Congenital heart defects research
- Health Sciences › Medicine › Surgery › Tissue Engineering and Regenerative Medicine
- Keywords
- self-assembly, heart development, congenital heart disease, human pluripotent stem cells, cardiac vasculature, pregestational diabetes, in vitro disease model
- MeSH terms
- Cell Differentiation, Female, Heart, Heart Defects, Congenital, Humans, Male, Organoids, Pluripotent Stem Cells, Wnt Signaling Pathway
About these checks
Registry, retraction, Cites and statistics results are computed, not judged, with one exception: a printed reference that no index lists is read once by a model before it counts as a citation error. Claims are extracted by a model and kept only when their quote appears verbatim in the text; each cited source is then checked, with a model’s help, for whether it says what the claim relies on. Those verdicts can be wrong — read the claim’s quote and the cited source before relying on one.
A language model drew the claims from the paper on 2026-10-07, under version 3 of the claim definition (model deepseek-v4.1-flash, prompt extract-v3).
A second model labelled each claim on 2026-10-07 (model jev-1.13-20260917, definition revision gold-guideline-v0.2).
Cited sources are checked with a language model’s help (gpt-6-sol).
Statistics and arithmetic are recomputed, not judged.
Confidence bands are shown only for fields calibrated on our annotated test set. None is calibrated yet, so no band is shown.
What counts as a claim ›How we measure confidence ›How we check this ›
Are you an author, or do you see a problem with this page? Request a review
