Cited by 28Ion channel regulation and functionCardiac electrophysiology and arrhythmiasNicotinic Acetylcholine Receptors Study

The DOI matches its Crossref record; 2 of the 2 references it cites were found in a registry or an index.

Cryo-EM structure of the human Kv3.1 channel reveals gating control by the cytoplasmic T1 domain

Open access

Published version of a preprint

Abstract

Kv3 channels have distinctive gating kinetics tailored for rapid repolarization in fast-spiking neurons. Malfunction of this process due to genetic variants in the KCNC1 gene causes severe epileptic disorders, yet the structural determinants for the unusual gating properties remain elusive. Here, we present cryo-electron microscopy structures of the human Kv3.1a channel, revealing a unique arrangement of the cytoplasmic tetramerization domain T1 which facilitates interactions with C-terminal axonal targeting motif and key components of the gating machinery. Additional interactions between S1/S2 linker and turret domain strengthen the interface between voltage sensor and pore domain. Supported by molecular dynamics simulations, electrophysiological and mutational analyses, we identify several residues in the S4/S5 linker which influence the gating kinetics and an electrostatic interaction between acidic residues in α6 of T1 and R449 in the pore-flanking S6T helices. These findings provide insights into gating control and disease mechanisms and may guide strategies for the design of pharmaceutical drugs targeting Kv3 channels.

Overview

The claims and statistics of this paper haven’t been checked yet.

Run the check — free, no account needed. It reads the open-access text and checks the sources it cites.

A few free checks a day · papers already verified open instantly · results are public

Integrity signals

Registry

Crossref · 10.1038/s41467-022-29594-w

Cites

2 of 2 references verified0 citation errors · 0 not checkable

Statistics

Figures

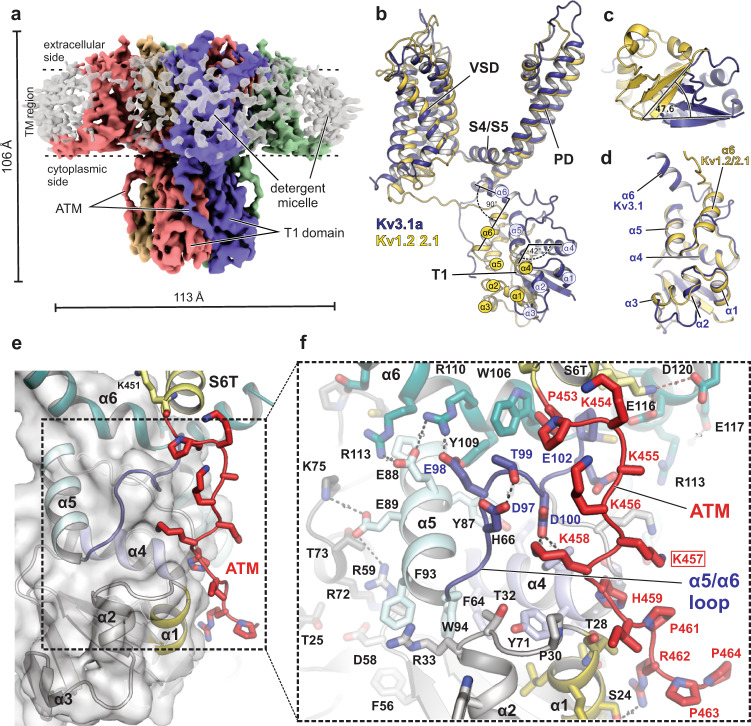
Fig. 1 Kv3.1a full-length structure showing alternative T1 arrangement compared to Kv1.2/2.1 and electrostatic ATM/T1 interactions. a Density maps of the human Kv3.1a channel, coloured by chain. TM region is illustrated by dashed lines. b Superposition of a single chain of Kv3.1a (dark blue cartoon) with one protomer of the Kv1.2-2.1 paddle chimera (pdb: 6EBK, shown in yellow cartoon representation), aligning the S4/S5 linker and pore domain. c Cytoplasmic view of the T1 domain of Kv3.1a superposed on the Kv1.2/2.1 structure (yellow cartoon) using the same alignment as in (b). Angle indicates rotational displacement measured between a vector defined by cα atoms of G16/H22 in Kv3.1 and G41/Q47 in Kv1.2-2.1, respectively. d Superposition of an individual T1 protomer (residues 8–120, dark blue) from Kv3.1 with the respective region of the Kv1.2-2.1 protomer (yellow). e Detailed view of the ATM/T1 contact region. T1 is shown as semi-transparent surface representation/cartoon and the ATM motif C-terminal from S6T is shown as red cartoon. f Close-up view of the inset from e, illustrating electrostatic contacts between acidic residues in α5 of the N-terminal T1 domain and a cluster of lysines (K454–K458) within the ATM of the C-terminus. Red frame indicates location of frameshift variant K457fs associated with EPM7 (ClinVar ID: 692088).
Fig. 1 Kv3.1a full-length structure showing alternative T1 arrangement compared to Kv1.2/2.1 and electrostatic ATM/T1 interactions. a Density maps of the human Kv3.1a channel, coloured by chain. TM region is illustrated by dashed lines. b Superposition of a single chain of Kv3.1a (dark blue cartoon) with one protomer of the Kv1.2-2.1 paddle chimera (pdb: 6EBK, shown in yellow cartoon representation), aligning the S4/S5 linker and pore domain. c Cytoplasmic view of the T1 domain of Kv3.1a superposed on the Kv1.2/2.1 structure (yellow cartoon) using the same alignment as in (b). Angle indicates rotational displacement measured between a vector defined by cα atoms of G16/H22 in Kv3.1 and G41/Q47 in Kv1.2-2.1, respectively. d Superposition of an individual T1 protomer (residues 8–120, dark blue) from Kv3.1 with the respective region of the Kv1.2-2.1 protomer (yellow). e Detailed view of the ATM/T1 contact region. T1 is shown as semi-transparent surface representation/cartoon and the ATM motif C-terminal from S6T is shown as red cartoon. f Close-up view of the inset from e, illustrating electrostatic contacts between acidic residues in α5 of the N-terminal T1 domain and a cluster of lysines (K454–K458) within the ATM of the C-terminus. Red frame indicates location of frameshift variant K457fs associated with EPM7 (ClinVar ID: 692088).CC BY · PubMed Central
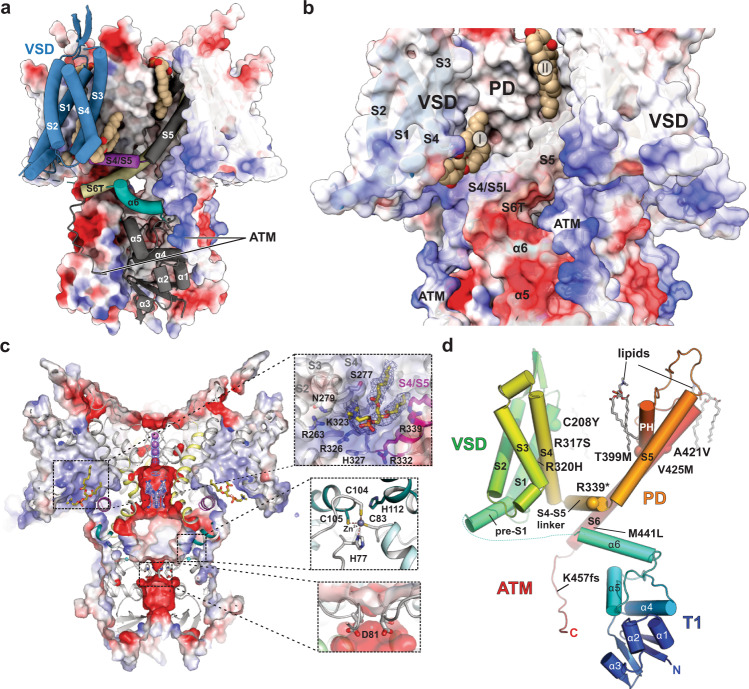
Fig. 2 Electrostatic surface properties and location of disease mutations. a Electrostatic surface representation of the Kv3.1a tetramer with a single protomer shown as cartoon, highlighting the relative arrangement of VSD (blue), S4/S5 linker (magenta) and α6 (teal) of the T1 domain. Lipids are shown in brown space-fill representation. The surface is coloured by electrostatic potential (red, −5 kT e−1; blue, +5 kT e−1). b Enlarged view of the Kv3.1 tetramer in full surface representation, highlighting electrostatic attraction between negatively charged α5 and α6 in T1 (red surface areas) and positively charged ATM (blue surface areas). Two lipid-binding sites are shown: site I between S4 and S4/S5 linker and site II at the interface between VSD and PD. c Slab view of (a) with insets 1. highlighting residues involved in lipid interactions at site I, 2. the interfacial Zn2+ binding site in T1 and 3. the lower constriction in T1 with D81 as major player for negative surface potential and local K+ ion abundance. d Kv3.1a protomer in cartoon representation with cα atoms of residues implicated in disease mutations shown as spheres. Lipids are shown in stick representation.
Fig. 2 Electrostatic surface properties and location of disease mutations. a Electrostatic surface representation of the Kv3.1a tetramer with a single protomer shown as cartoon, highlighting the relative arrangement of VSD (blue), S4/S5 linker (magenta) and α6 (teal) of the T1 domain. Lipids are shown in brown space-fill representation. The surface is coloured by electrostatic potential (red, −5 kT e−1; blue, +5 kT e−1). b Enlarged view of the Kv3.1 tetramer in full surface representation, highlighting electrostatic attraction between negatively charged α5 and α6 in T1 (red surface areas) and positively charged ATM (blue surface areas). Two lipid-binding sites are shown: site I between S4 and S4/S5 linker and site II at the interface between VSD and PD. c Slab view of (a) with insets 1. highlighting residues involved in lipid interactions at site I, 2. the interfacial Zn2+ binding site in T1 and 3. the lower constriction in T1 with D81 as major player for negative surface potential and local K+ ion abundance. d Kv3.1a protomer in cartoon representation with cα atoms of residues implicated in disease mutations shown as spheres. Lipids are shown in stick representation.CC BY · PubMed Central
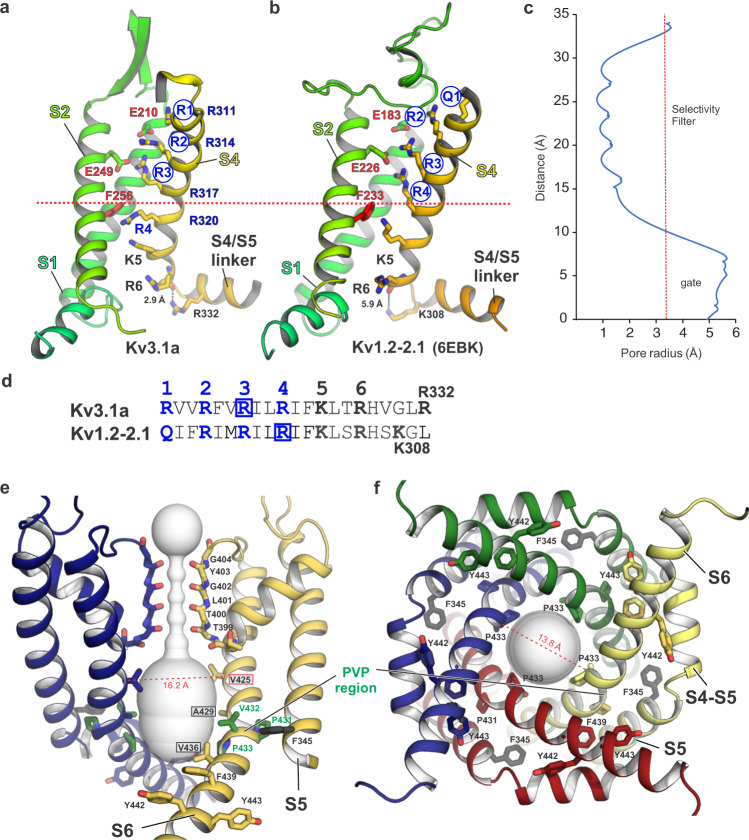
Fig. 3 Voltage sensor domain arrangement and pore properties of Kv3.1a. a Cartoon representation of the VSD S1–S4 (S3 is omitted for clarity) in Kv31a, showing the relative positioning of the gating charges R1–R4 (blue labelled) in S4 (shown in yellow) with respect to conserved residues (F256 and E249) of the hydrophobic charge transfer centre (CTC), located in S2 (shown in light green). Blue circles highlight voltage-sensing gating residues located above the position of conserved F256 of the CTC, which is represented by the dotted red line. b Cartoon representation of the VSD arrangement in Kv1.2-2.1 (pdb 6EBK), highlighting that all four voltage-sensing charges R1–R4 (blue circles) are located above F233 compared to only three (R1–R3) in Kv3.1a shown in panel (a). c Plot of the Kv3.1a pore radius, as determined by MOLE77. Red dotted line marks the radius of hydrated K+. d Sequence of S4 residues for Kv3.1a (top) and Kv1.2-2.1 (bottom) with the main voltage-sensing R/Q residues within the conserved arginine-rich motif highlighted in blue. Blue boxes encircle voltage-sensing arginines which are located above the CTC. e Cross-membrane view of the Kv3.1a pore domain and selectivity filter. For clarity, only two chains are shown. The pore diameter is shown as light grey surface representation. Residues in the PVP motif are shown as green sticks, major pore lining residues are highlighted by black frames. Conserved aromatic residues in the lower S6T gate are shown as sticks. F345 in S5 (unique to Kv3 family) is shown as black stick representation. Dashed line indicates cα distance between V425 (framed in red), a residue relevant for the gain-of-function mutation V425M associated with epileptic encephalopathy15. f Cytoplasmic view of the open pore with pore-lining S6 helices from all four subunits shown as cartoon representation. Dashed line indicates cα distance between P433 from two diagonal subunits.
Fig. 3 Voltage sensor domain arrangement and pore properties of Kv3.1a. a Cartoon representation of the VSD S1–S4 (S3 is omitted for clarity) in Kv31a, showing the relative positioning of the gating charges R1–R4 (blue labelled) in S4 (shown in yellow) with respect to conserved residues (F256 and E249) of the hydrophobic charge transfer centre (CTC), located in S2 (shown in light green). Blue circles highlight voltage-sensing gating residues located above the position of conserved F256 of the CTC, which is represented by the dotted red line. b Cartoon representation of the VSD arrangement in Kv1.2-2.1 (pdb 6EBK), highlighting that all four voltage-sensing charges R1–R4 (blue circles) are located above F233 compared to only three (R1–R3) in Kv3.1a shown in panel (a). c Plot of the Kv3.1a pore radius, as determined by MOLE77. Red dotted line marks the radius of hydrated K+. d Sequence of S4 residues for Kv3.1a (top) and Kv1.2-2.1 (bottom) with the main voltage-sensing R/Q residues within the conserved arginine-rich motif highlighted in blue. Blue boxes encircle voltage-sensing arginines which are located above the CTC. e Cross-membrane view of the Kv3.1a pore domain and selectivity filter. For clarity, only two chains are shown. The pore diameter is shown as light grey surface representation. Residues in the PVP motif are shown as green sticks, major pore lining residues are highlighted by black frames. Conserved aromatic residues in the lower S6T gate are shown as sticks. F345 in S5 (unique to Kv3 family) is shown as black stick representation. Dashed line indicates cα distance between V425 (framed in red), a residue relevant for the gain-of-function mutation V425M associated with epileptic encephalopathy15. f Cytoplasmic view of the open pore with pore-lining S6 helices from all four subunits shown as cartoon representation. Dashed line indicates cα distance between P433 from two diagonal subunits.CC BY · PubMed Central
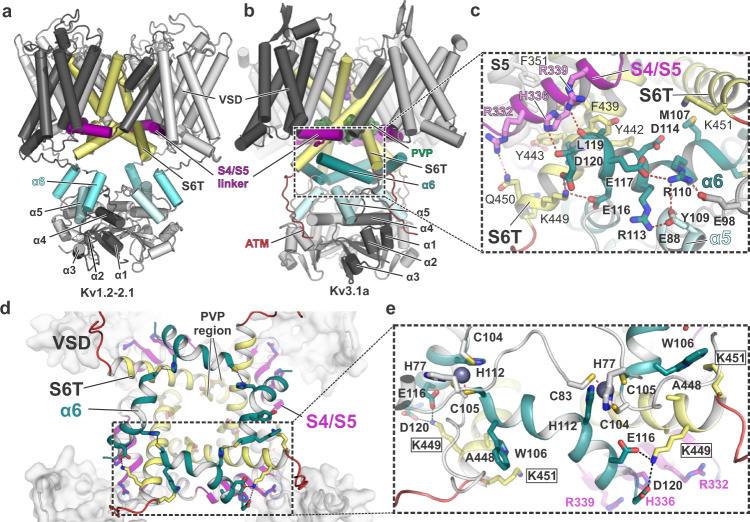
Fig. 4 The α6 helix of the Kv3.1 T1 domain forms a second cuff below the S4/S5 linker, stabilized by inter- and intrasubunit interactions. a Cartoon representation of the Kv1.2-2.1 tetramer (light grey) with one protomer highlighted in dark grey. S4/S5 linker is represented in magenta, S6 is coloured in pale yellow and α6 of the T1 domain is shown in aquamarine blue. b Cartoon representation of the Kv3.1a tetramer, illustrating the unique orientation of α6 (teal blue) of the T1 domain. Colour-coding of other elements is the same as in (a). c Inset from b with an enlarged view of the α6 helix and its interactions with residues in the S4/S5 linker (magenta) and the lower gate formed by S6T (pale yellow). d Cytoplasmic view of the tetrameric “α6 gating cuff” (shown as teal cartoon), located below the gating machinery formed by S4/S5 (magenta) and S6T (yellow). Only helix α6 of T1 is shown for clarity. e Inset from d, detailing inter-subunit interactions between α6 helices from adjacent subunits and interactions between α6 and S6T. Zn2+ ions are shown as grey spheres.
Fig. 4 The α6 helix of the Kv3.1 T1 domain forms a second cuff below the S4/S5 linker, stabilized by inter- and intrasubunit interactions. a Cartoon representation of the Kv1.2-2.1 tetramer (light grey) with one protomer highlighted in dark grey. S4/S5 linker is represented in magenta, S6 is coloured in pale yellow and α6 of the T1 domain is shown in aquamarine blue. b Cartoon representation of the Kv3.1a tetramer, illustrating the unique orientation of α6 (teal blue) of the T1 domain. Colour-coding of other elements is the same as in (a). c Inset from b with an enlarged view of the α6 helix and its interactions with residues in the S4/S5 linker (magenta) and the lower gate formed by S6T (pale yellow). d Cytoplasmic view of the tetrameric “α6 gating cuff” (shown as teal cartoon), located below the gating machinery formed by S4/S5 (magenta) and S6T (yellow). Only helix α6 of T1 is shown for clarity. e Inset from d, detailing inter-subunit interactions between α6 helices from adjacent subunits and interactions between α6 and S6T. Zn2+ ions are shown as grey spheres.CC BY · PubMed Central
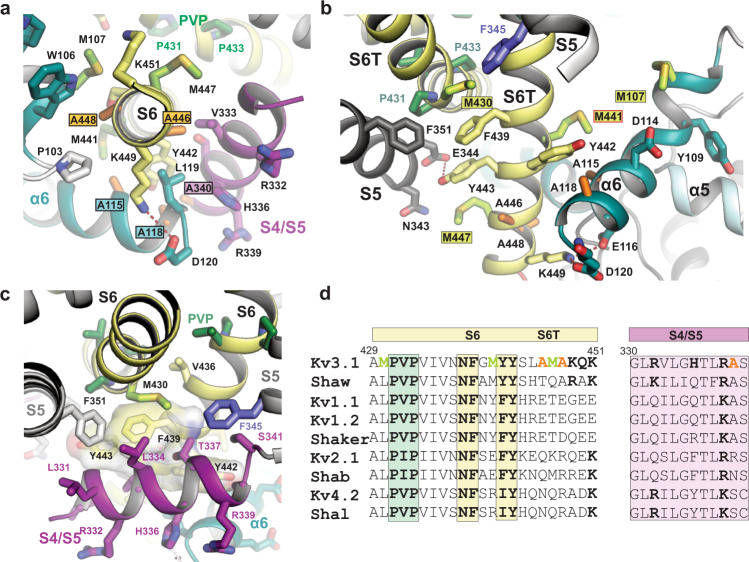
Fig. 5 A cluster of Kv3-specific alanines allows three-way interactions between α6, S4/S5 linker and S6T and location of Kv3.1-specific methionines in S6T. a Cytoplasmic view onto S6T (pale yellow cartoon) of the lower gate in Kv3.1a, highlighting the close proximity to neighbouring helices S4/S5 and α6 of the T1 domain, which is possible due to the compact side chains of A115 and A118 (α6), A340 (S4/S5 linker) and A446 and A448 (S6T). The close contact allows the formation of a stabilizing salt bridge between D120 in α6 and K449 in S6T. b Rotated view from a, highlighting the abundance of Kv3-specific methionines in S6T (M430, M441, M447) and α6 (M107). S4/S5 linker is omitted for clarity. Red frame indicates the location variant M441L associated with EPM7. c Illustration of the hydrophobic surface created by aromatic S6T residues F439, Y442, and Y443 (displayed as semi-transparent surfaces) which cradles the S4/S5 linker (magenta) close to the PVP motif (green sticks) and the α6 helix in the T1 domain. F345 in S5 (slate blue) and M430 (lime green) from adjacent subunits form a sulfo-aromatic interaction. d Sequence alignment of the S6/S6T (left) and S4/S5 linker (right) regions of Kv3.1a with other T1-containing Kv channels (human or fruit fly). Kv3-specific alanines and methionines are highlighted in orange and lime, respectively. Conserved residues across other Kv families are shown in bold, including the PVP motif (green) and the aromatic S6T residues involved in electromechanical coupling interactions with the S4/S5 linker.
Fig. 5 A cluster of Kv3-specific alanines allows three-way interactions between α6, S4/S5 linker and S6T and location of Kv3.1-specific methionines in S6T. a Cytoplasmic view onto S6T (pale yellow cartoon) of the lower gate in Kv3.1a, highlighting the close proximity to neighbouring helices S4/S5 and α6 of the T1 domain, which is possible due to the compact side chains of A115 and A118 (α6), A340 (S4/S5 linker) and A446 and A448 (S6T). The close contact allows the formation of a stabilizing salt bridge between D120 in α6 and K449 in S6T. b Rotated view from a, highlighting the abundance of Kv3-specific methionines in S6T (M430, M441, M447) and α6 (M107). S4/S5 linker is omitted for clarity. Red frame indicates the location variant M441L associated with EPM7. c Illustration of the hydrophobic surface created by aromatic S6T residues F439, Y442, and Y443 (displayed as semi-transparent surfaces) which cradles the S4/S5 linker (magenta) close to the PVP motif (green sticks) and the α6 helix in the T1 domain. F345 in S5 (slate blue) and M430 (lime green) from adjacent subunits form a sulfo-aromatic interaction. d Sequence alignment of the S6/S6T (left) and S4/S5 linker (right) regions of Kv3.1a with other T1-containing Kv channels (human or fruit fly). Kv3-specific alanines and methionines are highlighted in orange and lime, respectively. Conserved residues across other Kv families are shown in bold, including the PVP motif (green) and the aromatic S6T residues involved in electromechanical coupling interactions with the S4/S5 linker.CC BY · PubMed Central
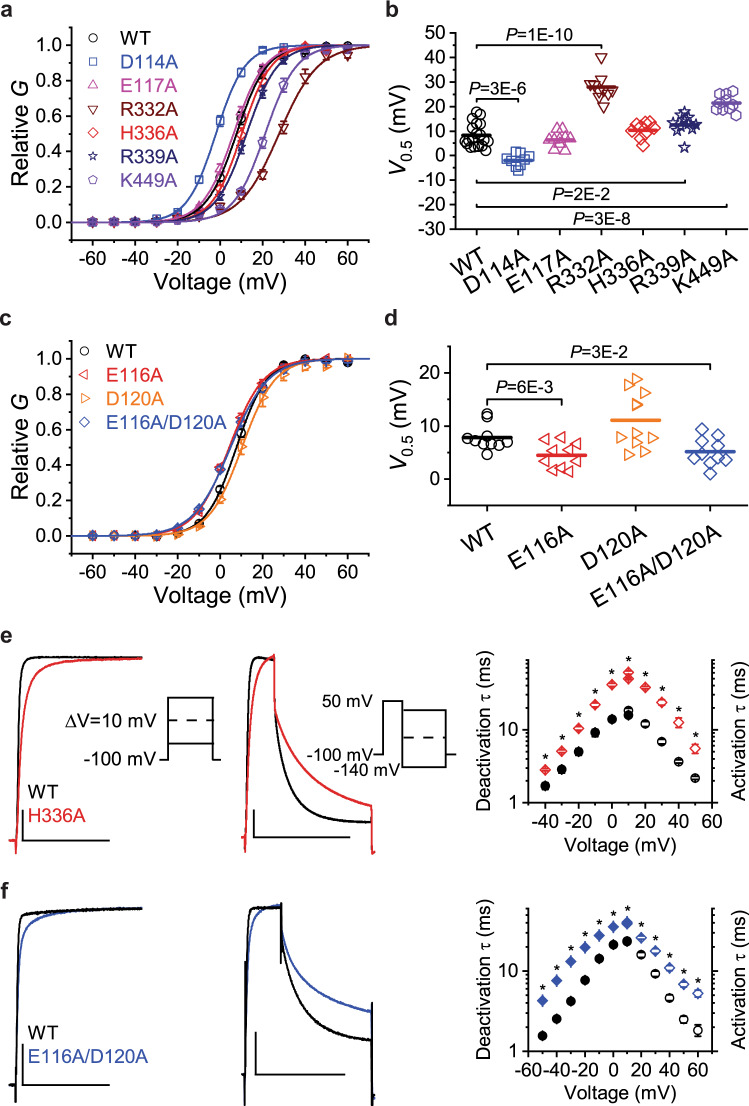
Fig. 6 Mutational and electrophysiological analyses of key residues involved in functional inter-domain interactions between α6, S4/S5 linker and S6T. a Normalized G–V curves (G/Gmax) of Kv3.1a WT and the indicated mutants. The symbols and error bars represent mean ± SEM (n = 9–19 oocytes), and the solid lines are the best fits assuming a first-order Boltzmann equation (see the “Methods” section). b Scatter graphs comparing of V0.5 values from WT and several Ala mutants. Each symbol represents a measurement from an individual oocyte, and the overlaid horizontal line represents the mean value. In each group, n = 9-19 oocytes. P values are indicated on the graph. c Normalized G–V curves for the indicated α6 mutations as described for panel (a). In each group, n = 10-11 oocytes. d Scatter graph for the indicated α6 mutations as described for panel (b). In each group, n = 10–11 oocytes. e Left: Overlay of representative whole-oocyte currents from Kv3.1a WT and the mutant H336A at 50 mV. These currents were evoked by the voltage protocol shown in the inset. Centre: Overlay of representative whole-oocyte currents from Kv3.1a WT and the mutant H336A while the repolarizing voltage is 0 mV. From a holding voltage of −100 mV, these currents were evoked by a 30-ms step depolarization to +50 mV, which was immediately followed by a 100-ms repolarizing step. To determine the voltage dependence of deactivation, the repolarizing step was changed in 10-mV increments from −140 to +30 mV (inset). The horizontal and vertical scale bars indicate 100 ms and 1 μA, respectively. Right: The voltage dependence of the time constants of activation (hollow symbols) and deactivation (filled symbols) from Kv3.1a WT and H336A. f Left and centre: overlay of representative whole-oocyte currents from Kv3.1a WT and the double mutant E116A/D120A. Protocol details as described for panel (e). The horizontal and vertical scale bars indicate 100 ms and 1 μA, respectively. Right: The voltage dependence of the time constants of activation (hollow symbols) and deactivation (filled symbols) from Kv3.1a WT and E116A/D120A. Symbols and error bars in panels e and f represent the mean ± SEM and * indicates p < 0.001. Source data are provided as a Source Data file. Exact n and p values for panels a–d are listed in Supplemental Table 2.
Fig. 6 Mutational and electrophysiological analyses of key residues involved in functional inter-domain interactions between α6, S4/S5 linker and S6T. a Normalized G–V curves (G/Gmax) of Kv3.1a WT and the indicated mutants. The symbols and error bars represent mean ± SEM (n = 9–19 oocytes), and the solid lines are the best fits assuming a first-order Boltzmann equation (see the “Methods” section). b Scatter graphs comparing of V0.5 values from WT and several Ala mutants. Each symbol represents a measurement from an individual oocyte, and the overlaid horizontal line represents the mean value. In each group, n = 9-19 oocytes. P values are indicated on the graph. c Normalized G–V curves for the indicated α6 mutations as described for panel (a). In each group, n = 10-11 oocytes. d Scatter graph for the indicated α6 mutations as described for panel (b). In each group, n = 10–11 oocytes. e Left: Overlay of representative whole-oocyte currents from Kv3.1a WT and the mutant H336A at 50 mV. These currents were evoked by the voltage protocol shown in the inset. Centre: Overlay of representative whole-oocyte currents from Kv3.1a WT and the mutant H336A while the repolarizing voltage is 0 mV. From a holding voltage of −100 mV, these currents were evoked by a 30-ms step depolarization to +50 mV, which was immediately followed by a 100-ms repolarizing step. To determine the voltage dependence of deactivation, the repolarizing step was changed in 10-mV increments from −140 to +30 mV (inset). The horizontal and vertical scale bars indicate 100 ms and 1 μA, respectively. Right: The voltage dependence of the time constants of activation (hollow symbols) and deactivation (filled symbols) from Kv3.1a WT and H336A. f Left and centre: overlay of representative whole-oocyte currents from Kv3.1a WT and the double mutant E116A/D120A. Protocol details as described for panel (e). The horizontal and vertical scale bars indicate 100 ms and 1 μA, respectively. Right: The voltage dependence of the time constants of activation (hollow symbols) and deactivation (filled symbols) from Kv3.1a WT and E116A/D120A. Symbols and error bars in panels e and f represent the mean ± SEM and * indicates p < 0.001. Source data are provided as a Source Data file. Exact n and p values for panels a–d are listed in Supplemental Table 2.CC BY · PubMed Central
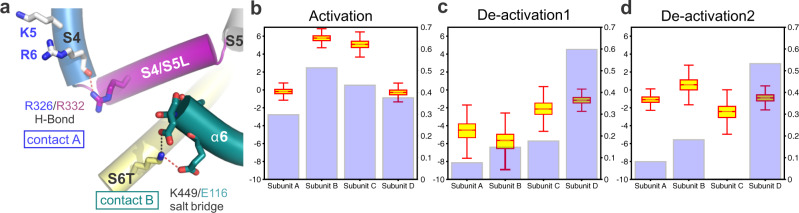
Fig. 7 MD simulations of S4 voltage sensor movement during activation/deactivation reveal a correlation with E116/K449 salt bridge stability. a Cartoon representation of the S4–S5/S6T contact region in Kv3.1a, showing the positions of the R326/R332 H-bond and the salt bridge E116A/K449 between α6 in the T1 domain and S6T. b Comparison of the Z-position of the R4 dating charge relative to the CTC (boxplot) and the stability of the E116/K440 (violet bars) for each subunit under activating conditions (+300 mV). Data calculated from 750 ns (12,000 frames) following the movement of R4 Arginine (SI Fig. S15). The salt-bridge was assumed to form in frames with distance between the heavy atoms of the residues being <3.3 Å. Boxes span the interquartile range and whiskers extend up to 1.5 times this range. c, d Comparison of the Z-position of the R4 gating charge relative to the CTC (boxplot) and the stability of the E116/K440 (violet bars) for each subunit under deactivating conditions (−650 mV) from two independent trajectories. Data calculated from 750 ns (12,000 frames) following the movement of R4 arginine. The salt-bridge was assumed to form in frames with distance between the heavy atoms of the residues being <3.3 Å. Boxes span the interquartile range and whiskers extend up to 1.5 times this range. Source data for b–d are provided as a Source Data file.
Fig. 7 MD simulations of S4 voltage sensor movement during activation/deactivation reveal a correlation with E116/K449 salt bridge stability. a Cartoon representation of the S4–S5/S6T contact region in Kv3.1a, showing the positions of the R326/R332 H-bond and the salt bridge E116A/K449 between α6 in the T1 domain and S6T. b Comparison of the Z-position of the R4 dating charge relative to the CTC (boxplot) and the stability of the E116/K440 (violet bars) for each subunit under activating conditions (+300 mV). Data calculated from 750 ns (12,000 frames) following the movement of R4 Arginine (SI Fig. S15). The salt-bridge was assumed to form in frames with distance between the heavy atoms of the residues being <3.3 Å. Boxes span the interquartile range and whiskers extend up to 1.5 times this range. c, d Comparison of the Z-position of the R4 gating charge relative to the CTC (boxplot) and the stability of the E116/K440 (violet bars) for each subunit under deactivating conditions (−650 mV) from two independent trajectories. Data calculated from 750 ns (12,000 frames) following the movement of R4 arginine. The salt-bridge was assumed to form in frames with distance between the heavy atoms of the residues being <3.3 Å. Boxes span the interquartile range and whiskers extend up to 1.5 times this range. Source data for b–d are provided as a Source Data file.CC BY · PubMed Central
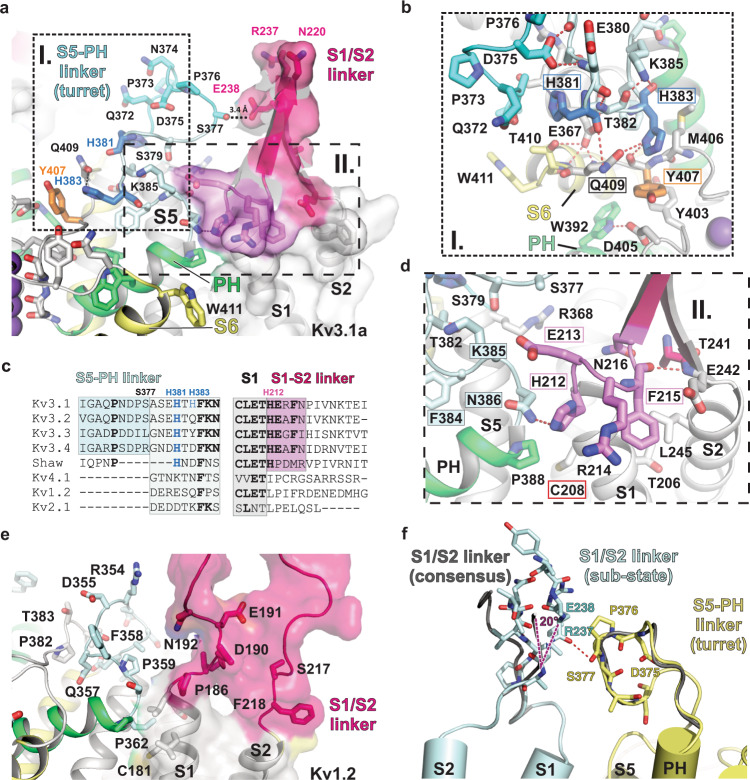
Fig. 8 Architecture of the turret domain of Kv3.1a and its interaction with the S1/S2 linker of the adjacent VSD. a Overview of the S5-PH linker region (“turret region”, shown in shades of blue) and the interface between pore helix PH (green cartoon) and S1/S2 linker of the VSD (surface representation and pink cartoon). b Inset I from a: Detailed view of histidines H381 and H383 (bold blue sticks) in the turret domain and their interactions with Q409 in S6 (pale yellow) and Y407 (orange sticks) near the selectivity filter of the pore domain. c Sequence alignments of the S5-PH linker (left) and the S1/S2 linker region (right) for human Kv3 family members and other human T1-containing Kv channels, highlighting the enlarged turret domain unique to the Kv3 subfamily and the location of conserved Kv3-specific histidines. Conserved residues are represented in bold letters. Coloured regions follow colour-coding in panels a, b, d. d Inset II from a: detailed view of the PD/VSD interface formed by residues at the N-terminal end of the S1/S2 linker of the VSD unique to Kv3 subfamily (pink ribbon) and their interactions with residues in the transition zone between the turret domain (light cyan) and the pore helix (PH in green). Red frame indicates the location of variant C208Y associated with non-progressive myoclonus epilepsy12. Pink frames and blue boxes highlight conserved residues in Kv3 channels. e View of the shorter S5-pore helix linker region of Kv1.2 (“turret region”, shown in pale blue) and the interface between pore helix PH (green cartoon) and S1/S2 loop of the VSD (surface representation and cartoon in bold pink). f Alternative conformation of the S1/S2 linker (light blue cartoon representation) from a subset of particles obtained by 3D variability analysis in comparison to the consensus conformation (dark grey cartoon representation). The sub-state allows the formation of an H-Bond (red dashed line) to the backbone carbonyl of S377 in the turret domain (represented as yellow cartoon). Purple dashed lines illustrate the angle between the main conformation (consensus) and the sub-state of the S1/S2 linker.
Fig. 8 Architecture of the turret domain of Kv3.1a and its interaction with the S1/S2 linker of the adjacent VSD. a Overview of the S5-PH linker region (“turret region”, shown in shades of blue) and the interface between pore helix PH (green cartoon) and S1/S2 linker of the VSD (surface representation and pink cartoon). b Inset I from a: Detailed view of histidines H381 and H383 (bold blue sticks) in the turret domain and their interactions with Q409 in S6 (pale yellow) and Y407 (orange sticks) near the selectivity filter of the pore domain. c Sequence alignments of the S5-PH linker (left) and the S1/S2 linker region (right) for human Kv3 family members and other human T1-containing Kv channels, highlighting the enlarged turret domain unique to the Kv3 subfamily and the location of conserved Kv3-specific histidines. Conserved residues are represented in bold letters. Coloured regions follow colour-coding in panels a, b, d. d Inset II from a: detailed view of the PD/VSD interface formed by residues at the N-terminal end of the S1/S2 linker of the VSD unique to Kv3 subfamily (pink ribbon) and their interactions with residues in the transition zone between the turret domain (light cyan) and the pore helix (PH in green). Red frame indicates the location of variant C208Y associated with non-progressive myoclonus epilepsy12. Pink frames and blue boxes highlight conserved residues in Kv3 channels. e View of the shorter S5-pore helix linker region of Kv1.2 (“turret region”, shown in pale blue) and the interface between pore helix PH (green cartoon) and S1/S2 loop of the VSD (surface representation and cartoon in bold pink). f Alternative conformation of the S1/S2 linker (light blue cartoon representation) from a subset of particles obtained by 3D variability analysis in comparison to the consensus conformation (dark grey cartoon representation). The sub-state allows the formation of an H-Bond (red dashed line) to the backbone carbonyl of S377 in the turret domain (represented as yellow cartoon). Purple dashed lines illustrate the angle between the main conformation (consensus) and the sub-state of the S1/S2 linker.CC BY · PubMed Central
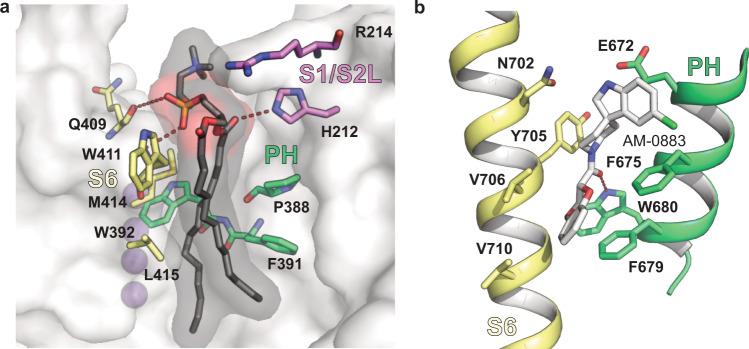
Fig. 9 Lipid binding site near the turret domain of Kv3.1a resembles known drug binding sites in other channels. a Kv3.1a residues in the pore domain (S6 in yellow, PH in green) involved in hydrophobic interactions with the fatty acid tails (black) of the lipid bound to the groove at the PD/VSD interface. Residues from the nearby S1/S2 linker are coloured in pink. K+ ions are represented as purple spheres. b Binding site for agonist AM-0883 (white) between S6 (yellow) and PH (green) of TRPC6 (pdb: 6UZ8).
Fig. 9 Lipid binding site near the turret domain of Kv3.1a resembles known drug binding sites in other channels. a Kv3.1a residues in the pore domain (S6 in yellow, PH in green) involved in hydrophobic interactions with the fatty acid tails (black) of the lipid bound to the groove at the PD/VSD interface. Residues from the nearby S1/S2 linker are coloured in pink. K+ ions are represented as purple spheres. b Binding site for agonist AM-0883 (white) between S6 (yellow) and PH (green) of TRPC6 (pdb: 6UZ8).CC BY · PubMed Central

Verification

Claims the paper makes

The claims and statistics of this paper haven’t been checked yet.

Run the check — free, no account needed. It reads the open-access text and checks the sources it cites.

A few free checks a day · papers already verified open instantly · results are public

Self-check

Percentages, sums and reported differences re-computed from the paper’s own numbers.

The self-check needs the paper’s full text.

Citations

Cites

Research works printed but not linked: 74

  1. Huang, C. Y. et al. Coexpression of high-voltage-activated ion channels Kv3.4 and Cav1.2 in pioneer axons during pathfinding in the developing rat forebrain. J. Comp. Neurol. 520, 3650–3672 (2012). · DOI
  2. Du, J. et al. Developmental expression and functional characterization of the potassium-channel subunit Kv3.1b in parvalbumin-containing interneurons of the rat hippocampus. J. Neurosci. 16, 506–518 (1996). · DOI · Paper page
  3. Macica, C. M. et al. Modulation of the kv3.1b potassium channel isoform adjusts the fidelity of the firing pattern of auditory neurons. J. Neurosci. 23, 1133–1141 (2003). · DOI
  4. Ozaita, A. et al. A unique role for Kv3 voltage-gated potassium channels in starburst amacrine cell signaling in mouse retina. J. Neurosci. 24, 7335–7343 (2004). · DOI
  5. Itri, J. N. et al. Fast delayed rectifier potassium current is required for circadian neural activity. Nat. Neurosci. 8, 650–656 (2005). · DOI
  6. Kudo, T. et al. Fast delayed rectifier potassium current: critical for input and output of the circadian system. J. Neurosci. 31, 2746–2755 (2011). · DOI
  7. Kaczmarek, L. K. & Zhang, Y. Kv3 channels: enablers of rapid firing, neurotransmitter release, and neuronal endurance. Physiol. Rev. 97, 1431–1468 (2017). · DOI
  8. Poirier, K. et al. Loss of function of KCNC1 is associated with intellectual disability without seizures. Eur. J. Hum. Genet. 25, 560–564 (2017). · DOI
  9. Oliver, K. L. et al. Myoclonus epilepsy and ataxia due to KCNC1 mutation: analysis of 20 cases and K(+) channel properties. Ann. Neurol. 81, 677–689 (2017). · DOI
  10. Muona, M. et al. A recurrent de novo mutation in KCNC1 causes progressive myoclonus epilepsy. Nat. Genet. 47, 39–46 (2015). · DOI
  11. Park, J. et al. KCNC1-related disorders: new de novo variants expand the phenotypic spectrum. Ann. Clin. Transl. Neurol. 6, 1319–1326 (2019). · DOI
  12. Nascimento, F. A. & Andrade, D. M. Myoclonus epilepsy and ataxia due to potassium channel mutation (MEAK) is caused by heterozygous KCNC1 mutations. Epileptic Disord. 18, 135–138 (2016). · DOI
  13. Munch, A. S. et al. Pharmacological rescue of mutated Kv3.1 ion-channel linked to progressive myoclonus epilepsies. Eur. J. Pharm. 833, 255–262 (2018). · DOI
  14. Bixby, K. A. et al. Zn2+-binding and molecular determinants of tetramerization in voltage-gated K+ channels. Nat. Struct. Biol. 6, 38–43 (1999). · DOI
  15. Nanao, M. H. et al. Determining the basis of channel-tetramerization specificity by x-ray crystallography and a sequence-comparison algorithm: Family Values (FamVal). Proc. Natl Acad. Sci. USA 100, 8670–8675 (2003). · DOI
  16. Choe, S. & Grabe, M. Conformational dynamics of the inner pore helix of voltage-gated potassium channels. J. Chem. Phys. 130, 215103 (2009). · DOI
  17. Long, S. B., Campbell, E. B. & Mackinnon, R. Crystal structure of a mammalian voltage-dependent Shaker family K+ channel. Science 309, 897–903 (2005). · DOI
  18. Labro, A. J. et al. Gating of shaker-type channels requires the flexibility of S6 caused by prolines. J. Biol. Chem. 278, 50724–50731 (2003). · DOI
  19. Webster, S. M. et al. Intracellular gate opening in Shaker K+ channels defined by high-affinity metal bridges. Nature 428, 864–868 (2004). · DOI
  20. Labro, A. J. et al. Kv3.1 uses a timely resurgent K(+) current to secure action potential repolarization. Nat. Commun. 6, 10173 (2015). · DOI
  21. Mishina, Y., Mutoh, H. & Knopfel, T. Transfer of Kv3.1 voltage sensor features to the isolated Ci-VSP voltage-sensing domain. Biophys. J. 103, 669–676 (2012). · DOI
  22. Priest, M. F. et al. S3-S4 linker length modulates the relaxed state of a voltage-gated potassium channel. Biophys. J. 105, 2312–2322 (2013). · DOI
  23. Xu, M. et al. The axon-dendrite targeting of Kv3 (Shaw) channels is determined by a targeting motif that associates with the T1 domain and ankyrin G. J. Neurosci. 27, 14158–14170 (2007). · DOI
  24. Gu, Y. et al. Alternative splicing regulates kv3.1 polarized targeting to adjust maximal spiking frequency. J. Biol. Chem. 287, 1755–1769 (2012). · DOI
  25. Jerng, H. H. & Covarrubias, M. K+ channel inactivation mediated by the concerted action of the cytoplasmic N- and C-terminal domains. Biophys. J. 72, 163–174 (1997). · DOI
  26. Matthies, D. et al. Single-particle cryo-EM structure of a voltage-activated potassium channel in lipid nanodiscs. Elife 7, e37558 (2018). · DOI
  27. Long, S. B. et al. Atomic structure of a voltage-dependent K+ channel in a lipid membrane-like environment. Nature 450, 376–382 (2007). · DOI
  28. Long, S. B., Campbell, E. B. & Mackinnon, R. Voltage sensor of Kv1.2: structural basis of electromechanical coupling. Science 309, 903–908 (2005). · DOI
  29. Kobertz, W. R. & Miller, C. K+ channels lacking the ‘tetramerization’ domain: implications for pore structure. Nat. Struct. Biol. 6, 1122–1125 (1999). · DOI
  30. Antz, C. & Fakler, B. Fast inactivation of voltage-gated K(+) channels: from cartoon to structure. News Physiol. Sci. 13, 177–182 (1998).
  31. Barros, F., Dominguez, P. & de la Pena, P. Cytoplasmic domains and voltage-dependent potassium channel gating. Front. Pharm. 3, 49 (2012). · DOI
  32. Minor, D. L. et al. The polar T1 interface is linked to conformational changes that open the voltage-gated potassium channel. Cell 102, 657–670 (2000). · DOI
  33. Wang, G. & Covarrubias, M. Voltage-dependent gating rearrangements in the intracellular T1–T1 interface of a K+ channel. J. Gen. Physiol. 127, 391–400 (2006). · DOI
  34. Wang, G. et al. Zn2+-dependent redox switch in the intracellular T1–T1 interface of a Kv channel. J. Biol. Chem. 282, 13637–13647 (2007). · DOI
  35. Cushman, S. J. et al. Voltage dependent activation of potassium channels is coupled to T1 domain structure. Nat. Struct. Biol. 7, 403–407 (2000). · DOI
  36. Wang, G. et al. Functionally active t1–t1 interfaces revealed by the accessibility of intracellular thiolate groups in kv4 channels. J. Gen. Physiol. 126, 55–69 (2005). · DOI
  37. Liu, S. et al. Structures of wild-type and H451N mutant human lymphocyte potassium channel KV1.3. Cell Discov. 7, 39 (2021). · DOI
  38. Botte, M. et al. Apo and ligand-bound high resolution Cryo-EM structures of the human Kv3.1 reveal a novel binding site for positive modulators. Preprint at bioRxiv https://doi.org/10.1101/2021.07.13.452180 (2021). · DOI
  39. Ju, M. et al. The roles of N- and C-terminal determinants in the activation of the Kv2.1 potassium channel. J. Biol. Chem. 278, 12769–12778 (2003). · DOI
  40. Kise, Y. et al. Structural basis of gating modulation of Kv4 channel complexes. Nature 599, 158–164 (2021). · DOI
  41. Wang, L. Y. et al. Activation of Kv3.1 channels in neuronal spine-like structures may induce local potassium ion depletion. Proc. Natl Acad. Sci. USA 95, 1882–1887 (1998). · DOI
  42. Ranjan, R. et al. A kinetic map of the homomeric voltage-gated potassium channel (Kv) family. Front. Cell. Neurosci. 13, 358 (2019). · DOI · Paper page
  43. Tao, X. et al. A gating charge transfer center in voltage sensors. Science 328, 67–73 (2010). · DOI
  44. Li, X. et al. Kv3.1 channelopathy: a novel loss-of-function variant and the mechanistic basis of its clinical phenotypes. Ann. Transl. Med. 9, 1397 (2021). · DOI
  45. Wisedchaisri, G. et al. Resting-state structure and gating mechanism of a voltage-gated sodium channel. Cell 178, 993–1003 e12 (2019). · DOI
  46. Aiyar, J. et al. The P-region and S6 of Kv3.1 contribute to the formation of the ion conduction pathway. Biophys. J. 67, 2261–2264 (1994). · DOI
  47. Lee, S. Y., Banerjee, A. & MacKinnon, R. Two separate interfaces between the voltage sensor and pore are required for the function of voltage-dependent K(+) channels. PLoS Biol. 7, e47 (2009).
  48. Gu, Y., Barry, J. & Gu, C. Kv3 channel assembly, trafficking and activity are regulated by zinc through different binding sites. J. Physiol. 591, 2491–2507 (2013). · DOI
  49. Poveda, J. A. et al. Modulation of the potassium channel KcsA by anionic phospholipids: role of arginines at the non-annular lipid binding sites. Biochim. Biophys. Acta Biomembr. 1861, 183029 (2019). · DOI
  50. Banerjee, A. et al. Structure of a pore-blocking toxin in complex with a eukaryotic voltage-dependent K(+) channel. Elife 2, e00594 (2013). · DOI
  51. Bai, Y. et al. Structural basis for pharmacological modulation of the TRPC6 channel. Elife 9, e53311 (2020). · DOI
  52. Schmiege, P. et al. Human TRPML1 channel structures in open and closed conformations. Nature 550, 366–370 (2017). · DOI
  53. Tang, L. et al. Structural basis for inhibition of a voltage-gated Ca(2+) channel by Ca(2+) antagonist drugs. Nature 537, 117–121 (2016). · DOI
  54. Sun, J. & MacKinnon, R. Structural basis of human KCNQ1 modulation and gating. Cell 180, 340–347.e9 (2020). · DOI
  55. Blunck, R. & Batulan, Z. Mechanism of electromechanical coupling in voltage-gated potassium channels. Front. Pharm. 3, 166 (2012). · DOI
  56. Lu, Z., Klem, A. M. & Ramu, Y. Ion conduction pore is conserved among potassium channels. Nature 413, 809–813 (2001). · DOI
  57. Lu, Z., Klem, A. M. & Ramu, Y. Coupling between voltage sensors and activation gate in voltage-gated K+ channels. J. Gen. Physiol. 120, 663–676 (2002). · DOI
  58. Fernández-Mariño, A. I. et al. Gating interaction maps reveal a noncanonical electromechanical coupling mode in the Shaker K. Nat. Struct. Mol. Biol. 25, 320–326 (2018). · DOI
  59. Bassetto, C. A., Carvalho-de-Souza, J. L. & Bezanilla, F. Molecular basis for functional connectivity between the voltage sensor and the selectivity filter gate in Shaker K(+) channels. Elife 10, e63077 (2021). · DOI
  60. Kang, P. W. et al. Calmodulin acts as a state-dependent switch to control a cardiac potassium channel opening. Sci. Adv. 6, eabd6798 (2020). · DOI
  61. Punjani, A. et al. cryoSPARC: algorithms for rapid unsupervised cryo-EM structure determination. Nat. Methods 14, 290–296 (2017). · DOI · Paper page
  62. Pettersen, E. F. et al. UCSF Chimera—a visualization system for exploratory research and analysis. J. Comput. Chem. 25, 1605–1612 (2004). · DOI
  63. Emsley, P. & Cowtan, K. Coot: model-building tools for molecular graphics. Acta Crystallogr. D Biol. Crystallogr. 60, 2126–2132 (2004). · DOI · Paper page
  64. Klaholz, B. P. Deriving and refining atomic models in crystallography and cryo-EM: the latest Phenix tools to facilitate structure analysis. Acta Crystallogr. D Struct. Biol. 75, 878–881 (2019). · DOI
  65. Yang, E. et al. Electrophysiological analysis of voltage-gated ion channel modulation by general anesthetics. Methods Enzymol. 602, 339–368 (2018). · DOI
  66. Schwaiger, C. S. et al. The free energy barrier for arginine gating charge translation is altered by mutations in the voltage sensor domain. PLoS ONE 7, e45880 (2012). · DOI
  67. Jo, S. et al. CHARMM-GUI: a web-based graphical user interface for CHARMM. J. Comput. Chem. 29, 1859–1865 (2008). · DOI · Paper page
  68. Huang, J. et al. CHARMM36m: an improved force field for folded and intrinsically disordered proteins. Nat. Methods 14, 71–73 (2017). · DOI
  69. Essmann, U. et al. A smooth particle mesh Ewald method. J. Chem. Phys. 103, 8577–8593 (1995). · DOI
  70. Hess, B. P-LINCS: a parallel linear constraint solver for molecular simulation. J. Chem. Theory Comput 4, 116–122 (2008). · DOI
  71. Parrinello, M. & Rahman, A. Polymorphic transitions in single crystals. A new molecular dynamics method. J. Appl. Phys. 52, 7182–7190 (1981). · DOI
  72. Bussi, G., Donadio, D. & Parrinello, M. Canonical sampling through velocity rescaling. J. Chem. Phys. 126, 014101 (2007). · DOI
  73. Klesse, G. et al. CHAP: a versatile tool for the structural and functional annotation of ion channel pores. J. Mol. Biol. 431, 3353–3365 (2019). · DOI
  74. Pravda, L. et al. MOLEonline: a web-based tool for analyzing channels, tunnels and pores (2018 update). Nucleic Acids Res. 46, W368–W373 (2018). · DOI

Metadata

Authors
Chi, G., Liang, Q., Sridhar, A., Cowgill, J. B., Sader, K., Radjainia, M., Qian, P., Castro-Hartmann, P., Venkaya, S., Singh, N. K., McKinley, G., Fernandez-Cid, A., Mukhopadhyay, S. M. M., Burgess-Brown, N. A., Delemotte, L., Covarrubias, M., & Dürr, K. L.
Affiliations
  • University of Oxford (GB)
  • Thomas Jefferson University (US)
  • Science for Life Laboratory (SE)
  • Thermo Fisher Scientific (Netherlands) (NL)
Corresponding author
Dürr, Katharina L.
Venue
Nature Communications
Published
2022-07-15
Volume
13
Issue
1
Pages
4087-4087
ISSN
2041-1723 (ISSN-L)
OpenAlex
W4285589102
Cited by
28
References
2
Citations by year
2026: 5 · 2025: 5 · 2024: 7 · 2023: 7 · 2022: 4
FWCI
1.88
Type
journal article
Language
en
Open access
Locations
  • Nature Communications (publishedVersion, cc-by)
  • Research Square (acceptedVersion, cc-by)
  • PubMed Central (publishedVersion, cc-by)
  • PubMed (publishedVersion)
  • The Medicine Forum (submittedVersion, cc-by)
  • RePEc: Research Papers in Economics (submittedVersion)
  • DOAJ (DOAJ: Directory of Open Access Journals) (submittedVersion, cc-by-sa)
Funders
  • McGill University
  • Wellcome Trust (106169/Z/14/Z, 106169, 115766, 060208/Z/00/Z, 093305, 093305/Z/10/Z)
  • Diamond Light Source
  • European Federation of Pharmaceutical Industries and Associations (115766, 875510)
  • European Commission (HORIZON2020, 898762, 115766, 875510)
  • Partnership for Advanced Computing in Europe AISBL
  • Vetenskapsrådet (VR 2018, 2018-, 2018-04905)
  • Science for Life Laboratory
  • Innovative Medicines Initiative (875510, 115766, No. 115766)
  • Medical Research Council (MC_PC_17137, MC_PC_17136)
  • National Supercomputing Center, Korea Institute of Science and Technology Information
Topics
  • Life Sciences › Biochemistry, Genetics and Molecular Biology › Molecular Biology › Ion channel regulation and function
  • Health Sciences › Medicine › Cardiology and Cardiovascular Medicine › Cardiac electrophysiology and arrhythmias
  • Life Sciences › Biochemistry, Genetics and Molecular Biology › Molecular Biology › Nicotinic Acetylcholine Receptors Study
Keywords
KCNC1, potassium channel gating, S4-S5 linker, gating kinetics, fast-spiking neurons, epilepsy, electrostatic interactions, drug target design
MeSH terms
Humans, Ion Channel Gating, Protein Structure, Secondary, Cryoelectron Microscopy, Shaw Potassium Channels, Static Electricity, Molecular Dynamics Simulation

About these checks

Registry, retraction, Cites and statistics results are computed, not judged, with one exception: a printed reference that no index lists is read once by a model before it counts as a citation error. Claims are extracted by a model and kept only when their quote appears verbatim in the text; each cited source is then checked, with a model’s help, for whether it says what the claim relies on. Those verdicts can be wrong — read the claim’s quote and the cited source before relying on one.

Statistics and arithmetic are recomputed, not judged.

Confidence bands are shown only for fields calibrated on our annotated test set. None is calibrated yet, so no band is shown.

What counts as a claim ›How we measure confidence ›How we check this ›

Are you an author, or do you see a problem with this page? Request a review