

The DOI matches its Crossref record; 52 of the 53 references it cites were found in a registry or an index.
Magnesium galvanic cells produce hydrogen and modulate the tumor microenvironment to inhibit cancer growth
Open accessAbstract
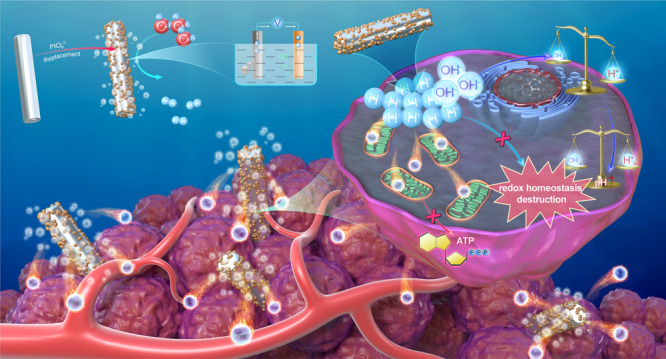
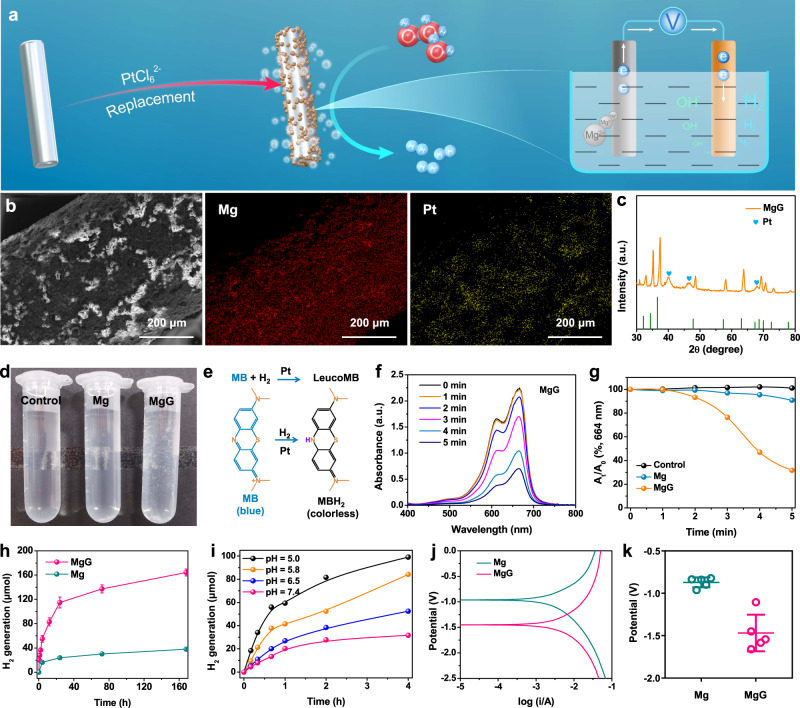
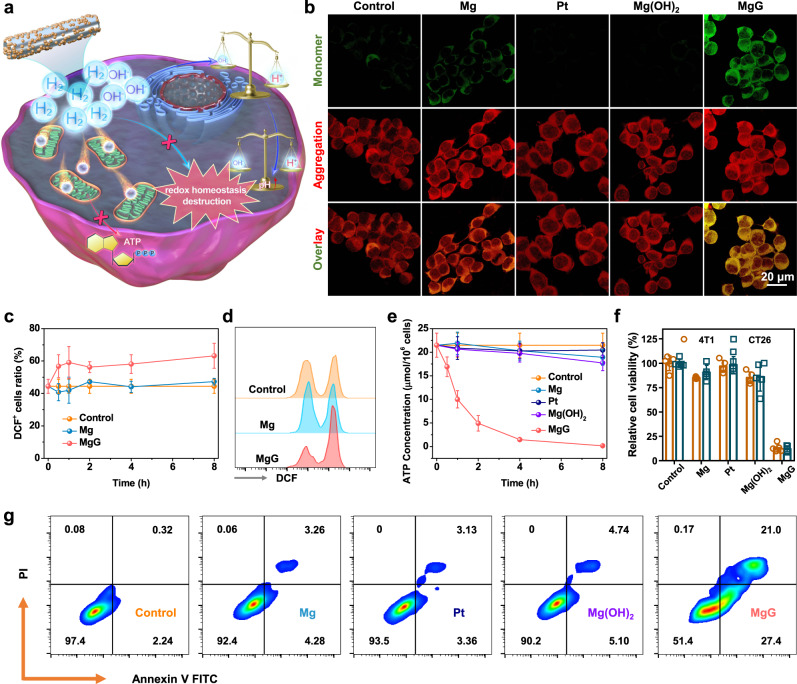
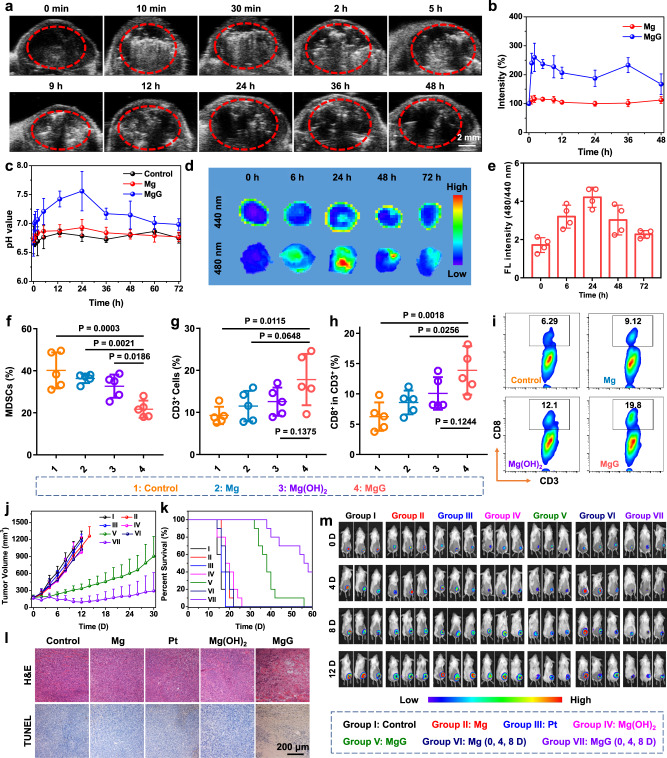
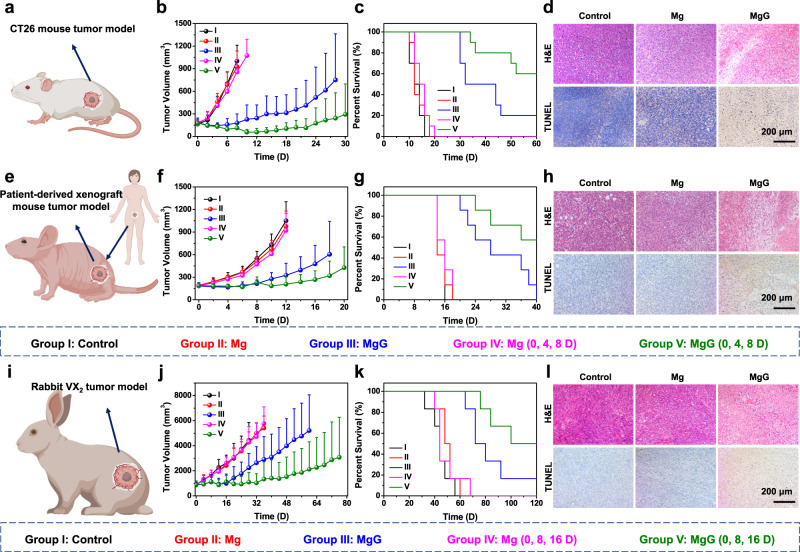
Abstract Hydrogen can be used as an anti-cancer treatment. However, the continuous generation of H2 molecules within the tumor is challenging. Magnesium (Mg) and its alloys have been extensively used in the clinic as implantable metals. Here we develop, by decorating platinum on the surface of Mg rods, a Mg-based galvanic cell (MgG), which allows the continuous generation of H2 in an aqueous environment due to galvanic-cell-accelerated water etching of Mg. By implanting MgG rods into a tumor, H2 molecules can be generated within the tumor, which induces mitochondrial dysfunction and intracellular redox homeostasis destruction. Meanwhile, the Mg(OH)2 residue can neutralize the acidic tumor microenvironment (TME). Such MgG rods with the micro-galvanic cell structure enable hydrogen therapy to inhibit the growth of tumors, including murine tumor models, patient-derived xenografts (PDX), as well as VX2 tumors in rabbits. Our research suggests that the galvanic cells for hydrogen therapy based on implantable metals may be a safe and effective cancer treatment.
Overview
The claims and statistics of this paper haven’t been checked yet.
Run the check — free, no account needed. It reads the open-access text and checks the sources it cites.
Integrity signals
Registry
Cites
Statistics
Figures
Verification
Claims the paper makes
The claims and statistics of this paper haven’t been checked yet.
Run the check — free, no account needed. It reads the open-access text and checks the sources it cites.
Claims other papers make about this one
Each is checked against this paper’s own text: does it say what the citing paper says it does?
The check wasn’t confident either way, so it gives no verdict — never disputed.
In the citing paper
“Concurrently, Mg2+-activated osteogenic pathways (e.g., Wnt signaling) act synergistically with M2 macrophage-derived reparative factors to promote collagen deposition and bone formation [36,66];”
From Nanocatalytic magnesium osteoimplants with biodegradable self-adaptive interfaces for therapeutic repair of infected bone defects (2026) · cites this paper as [36]
Experimental — accuracy not yet measured
Self-check
Percentages, sums and reported differences re-computed from the paper’s own numbers.
The self-check needs the paper’s full text.
Citations
Cites
1 retracted
Li, J., Wang, C., Zhang, J. H., Cai, J., Cao, Y., & Sun, X. (2010) · Brain Research · doi:10.1016/j.brainres.2010.02.046 · Cited by 205
RetractedStructural absorption by barbule microstructures of super black bird of paradise feathers
McCoy, D. E., Feo, T., Harvey, T. A., & Prum, R. O. (2018) · Nature Communications · doi:10.1038/s41467-017-02088-w · Cited by 7,424
U1 snRNP regulates cancer cell migration and invasion in vitro
Oh, J.-M., Venters, C. C., Di, C., Pinto, A. M., Wan, L., Younis, I., Cai, Z., Arai, C., So, B. R., Duan, J., et al. (2020) · Nature Communications · doi:10.1038/s41467-019-13993-7 · Cited by 7,157
Targeting cancer cells by ROS-mediated mechanisms: a radical therapeutic approach?
Trachootham, D., Alexandre, J., & Huang, P. (2009) · Nature Reviews Drug Discovery · doi:10.1038/nrd2803 · Cited by 5,452
Anomalous collapses of Nares Strait ice arches leads to enhanced export of Arctic sea ice
Moore, G. W. K., Howell, S. E. L., Brady, M., Xu, X., & McNeil, K. (2021) · Nature Communications · doi:10.1038/s41467-020-20314-w · Cited by 5,155
Magnesium and its alloys as orthopedic biomaterials: A review
Staiger, M. P., Pietak, A. M., Huadmai, J., & Dias, G. J. (2005) · Biomaterials · doi:10.1016/j.biomaterials.2005.10.003 · Cited by 4,460
Cancer immunotherapy comes of age
Mellman, I., Coukos, G., & Dranoff, G. (2011) · Nature · doi:10.1038/nature10673 · Cited by 3,893
Hydrogen acts as a therapeutic antioxidant by selectively reducing cytotoxic oxygen radicals
Ohsawa, I., Ishikawa, M., Takahashi, K., Watanabe, M., Nishimaki, K., Yamagata, K., Katsura, K., Katayama, Y., Asoh, S., & Ohta, S. (2007) · Nature Medicine · doi:10.1038/nm1577 · Cited by 2,572
The history of biodegradable magnesium implants: A review☆
Witte, F. (2010) · Acta Biomaterialia · doi:10.1016/j.actbio.2010.02.028 · Cited by 1,861
Magnesium in man: implications for health and disease
de Baaij, J. H. F., Hoenderop, J. G. J., & Bindels, R. J. M. (2015) · Physiological Reviews · doi:10.1152/physrev.00012.2014 · Cited by 1,726
Research works printed but not linked: 2
- Vetter, K. J. Electrochemical kinetics: theoretical aspects. (Elsevier, 2013).
- Zoski, C. G. Handbook of electrochemistry. (Elsevier, 2006).
Cited by
Sorted by citations
Bioactive inorganic nanomaterials for cancer theranostics
Pei, Z., Lei, H., & Cheng, L. (2023) · Chemical Society Reviews · doi:10.1039/d2cs00352j · Cited by 264
Self-citationBiomaterials tools to modulate the tumour microenvironment in immunotherapy
Chao, Y., & Liu, Z. (2023) · Nature Reviews Bioengineering · doi:10.1038/s44222-022-00004-6 · Cited by 262
Self-citationQiao, L., Zhu, G., Jiang, T., Qian, Y., Sun, Q., Zhao, G., Gao, H., & Li, C. (2023) · Advanced Materials · doi:10.1002/adma.202308241 · Cited by 227
Li, C., Jiang, G., Yu, J., Ji, W., Liu, L., Zhang, P., Du, J., Zhan, C., Wang, J., & Tang, B. Z. (2022) · Advanced Materials · doi:10.1002/adma.202208229 · Cited by 170
Wang, P., Wu, J., Yang, H., Liu, H., Yao, T., Liu, C., Gong, Y., Wang, M., Ji, G., Huang, P., et al. (2023) · Bioactive Materials · doi:10.1016/j.bioactmat.2023.01.001 · Cited by 153
Self-citationYuan, M., Liang, S., Yang, L., Li, F., Liu, B., Yang, C., Yang, Z., Bian, Y., Ma, P., Cheng, Z., et al. (2022) · Advanced Materials · doi:10.1002/adma.202209589 · Cited by 148
Self-citationSelf-promoted electroactive biomimetic mineralized scaffolds for bacteria-infected bone regeneration
Li, Z., He, D., Guo, B., Wang, Z., Yu, H., Wang, Y., Jin, S., Yu, M., Zhu, L., Chen, L., et al. (2023) · Nature Communications · doi:10.1038/s41467-023-42598-4 · Cited by 143
Self-Cascaded Pyroptosis-STING Initiators for Catalytic Metalloimmunotherapy
Yu, Q., Sun, S., Yang, N., Pei, Z., Chen, Y., Nie, J., Lei, H., Wang, L., Gong, F., & Cheng, L. (2025) · Journal of the American Chemical Society · doi:10.1021/jacs.4c12552 · Cited by 132
Self-citationGas Therapy: Generating, Delivery, and Biomedical Applications
Ghaffari‐Bohlouli, P., Jafari, H., Okoro, O. V., Alimoradi, H., Nie, L., Jiang, G., Kakkar, A. K., & Shavandi, A. (2024) · Small Methods · doi:10.1002/smtd.202301349 · Cited by 113
Nanocatalysts for modulating antitumor immunity: fabrication, mechanisms and applications
Wu, X., Li, Y., Wen, M., Xie, Y., Zeng, K., Liu, Y., Chen, W., & Zhao, Y. (2024) · Chemical Society Reviews · doi:10.1039/d3cs00673e · Cited by 98
Yang, N., Sun, X., Zhou, Y., Yang, X., You, J., Yu, Z., Ge, J., Gong, F., Xiao, Z., Jin, Y. X., et al. (2023) · 中国科学通报:英文版 · doi:10.1016/j.scib.2023.07.025 · Cited by 86
Self-citationOral magnesium prevents acetaminophen-induced acute liver injury by modulating microbial metabolism
Li, D., Chen, Y., Wan, M., Mei, F., Wang, F., Gu, P., Zhang, X., Wei, R., Zeng, Y., Zheng, H., et al. (2023) · Cell Host & Microbe · doi:10.1016/j.chom.2023.11.006 · Cited by 80
Self-citationHe, G., Pan, Y., Zeng, F., Qin, S., Luan, X., Lu, Q., Xie, C., Hu, P., Gao, Y., Yang, J., et al. (2024) · ACS Nano · doi:10.1021/acsnano.3c12796 · Cited by 73
Chen, L., Kang, Z., Shen, J., Zhao, R., Miao, Y., Zhang, L., Zheng, Z., Zhang, Z., Liu, N., Wang, C., et al. (2024) · 中国科学通报:英文版 · doi:10.1016/j.scib.2024.06.016 · Cited by 76
Self-citationCu 2+ ‐Anchored Carbon Nano‐Photocatalysts for Visible Water Splitting to Boost Hydrogen Cuproptosis
Ding, H., Ren, F., Liu, P., Feng, Y., Ma, X., Shen, Z., Shi, Q., Xu, M., Li, W., & Chen, H. (2023) · Angewandte Chemie International Edition · doi:10.1002/anie.202311549 · Cited by 74
Lei, H., Li, Q., Li, G., Wang, T., Lv, X., Pei, Z., Gao, X., Yang, N., Gong, F., Yang, Y., et al. (2023) · Bioactive Materials · doi:10.1016/j.bioactmat.2023.07.026 · Cited by 74
Self-citationWu, X., Zhou, Z., Li, K., & Liu, S. (2024) · Advanced Science · doi:10.1002/advs.202308632 · Cited by 76
Li, G., Lei, H., Yang, Y., Zhong, X., Gong, F., Gong, Y., Zhou, Y., Zhang, Y., Shi, H., Xiao, Z., et al. (2022) · Advanced Science · doi:10.1002/advs.202201069 · Cited by 70
Self-citationZhou, Y., Yang, N., Gong, F., Wang, Y., Yang, X., Dai, Y., Yu, Q., Wang, L., Chen, W., Zhuo, M., et al. (2022) · ACS Nano · doi:10.1021/acsnano.2c07903 · Cited by 73
Self-citationXie, J., Zhang, T., Jiang, J., Xue, W., Wang, W., Ni, J., Zhang, X., & Liu, X. (2025) · Journal of Magnesium and Alloys · doi:10.1016/j.jma.2025.05.009 · Cited by 71
Yang, N., Sun, S., Xu, J., Gong, F., Lei, H., Hao, Y., Pei, Z., Wang, C., Yu, Q., Nie, J., et al. (2025) · Advanced Materials · doi:10.1002/adma.202414929 · Cited by 68
Self-citationZhu, Y., You, Y., Chen, Z., Xu, D., Yue, W., Ma, X., Jiang, J., Wu, W., Lin, H., & Shi, J. (2023) · Nano Letters · doi:10.1021/acs.nanolett.3c00118 · Cited by 63
Bacterial outer membrane vesicle nanorobot
Tang, S., Tang, D., Zhou, H., Li, Y., Zhou, D., Peng, X., Ren, C., Su, Y., Zhang, S., Zheng, H., et al. (2024) · Proceedings of the National Academy of Sciences · doi:10.1073/pnas.2403460121 · Cited by 62
Ma, X., Zhou, Y., Xin, M., Yuan, H., Chao, D., Liu, F., Jia, X., Sun, P., Wang, C., Lu, G., et al. (2024) · Advanced Materials · doi:10.1002/adma.202410205 · Cited by 59
Li, Y., Wang, Y., Li, Z., Stenzel, M. H., & Jiang, Y. (2024) · Materials Horizons · doi:10.1039/d4mh00470a · Cited by 60
Magnesium metal and its corrosion products: Promising materials for tumor interventional therapy
Xu, B., Song, Y., Yang, K., Li, Y., Chen, B., Liao, X., & Jia, Q. (2023) · Journal of Magnesium and Alloys · doi:10.1016/j.jma.2023.02.007 · Cited by 58
Gas-assisted phototherapy for cancer treatment
Zhou, J., Cao, C., Zhang, X., Zhang, X., Li, J., Deng, H., & Wang, S. (2023) · Journal of Controlled Release · doi:10.1016/j.jconrel.2023.07.015 · Cited by 55
Nano‐Engineered Magnesium Implants for Magnetothermal Enhanced Pyroptosis to Boost Immunotherapy
Han, X., Sun, S., Yang, N., Han, Z., Pei, Z., Yu, Q., Nie, J., Wang, L., Liu, A., Meng, X., et al. (2024) · Advanced Functional Materials · doi:10.1002/adfm.202405836 · Cited by 53
Self-citationHydrogen therapy: recent advances and emerging materials
Jiang, Z., Ainiwaer, M., Liu, J., Ying, B., Luo, F., & Sun, X. (2024) · Biomaterials Science · doi:10.1039/d4bm00446a · Cited by 50
Magnesium alloys in tumor treatment: Current research status, challenges and future prospects
Hsu, Y., Lu, Y., Wang, S., Zheng, Y., Xia, D., & Liu, Y. (2023) · Journal of Magnesium and Alloys · doi:10.1016/j.jma.2023.08.008 · Cited by 47
Wang, D., Zhang, L., Nie, J., Yang, N., Sun, S., Wang, C., Pei, Z., Gong, F., Sun, X., Jin, Y. X., et al. (2025) · Journal of the American Chemical Society · doi:10.1021/jacs.5c06039 · Cited by 45
Self-citationMolecular Hydrogen Therapy: Mechanisms, Delivery Methods, Preventive, and Therapeutic Application
Jin, J., Yue, L., Du, M., Geng, F., Gao, X., Zhou, Y., Lu, Q., & Pan, X. (2025) · MedComm · doi:10.1002/mco2.70194 · Cited by 46
Emerging trends in materials and devices‐based electric stimulation therapy for tumors
Xie, S., Huang, J., Pereira, A. T., Xu, L., Luo, D., & Li, Z. (2023) · BMEMat · doi:10.1002/bmm2.12038 · Cited by 42
Zhang, X., Yu, W., Zhang, Y., Zhang, W., Wang, J., Gu, M., Cheng, S., Ren, G., Zhao, B., & Yuan, W. (2024) · Journal of Colloid and Interface Science · doi:10.1016/j.jcis.2024.05.222 · Cited by 43
The Landscape of Smart Biomaterial‐Based Hydrogen Therapy
Xu, M., Wu, G., You, Q., & Chen, X. S. (2024) · Advanced Science · doi:10.1002/advs.202401310 · Cited by 43
Biometallic ions and derivatives: a new direction for cancer immunotherapy
Zhao, L., Gui, Y., Cai, J., & Deng, X. (2025) · Molecular Cancer · doi:10.1186/s12943-025-02225-w · Cited by 46
Immunomodulatory metal-based biomaterials for cancer immunotherapy
Yuan, K., Zhang, C., Pan, X., Hu, B., Zhang, J., & Yang, G. (2024) · Journal of Controlled Release · doi:10.1016/j.jconrel.2024.09.008 · Cited by 40
Amplifying Ca2+ overload by engineered biomaterials for synergistic cancer therapy
Liang, J., Cao, Y., Lv, K., Xiao, B., & Sun, J. (2024) · Biomaterials · doi:10.1016/j.biomaterials.2024.123027 · Cited by 40
Yang, N., Yang, X., Cheng, S., Gao, X., Sun, S., Huang, X., Ge, J., Han, Z., Huang, C., Wang, Y., et al. (2024) · Bioactive Materials · doi:10.1016/j.bioactmat.2024.05.010 · Cited by 38
Self-citationKong, T., Zhang, K., Wang, Y., Ye, Y., Hou, J., Chen, X., Zhao, N., & Xu, F. (2024) · Advanced Functional Materials · doi:10.1002/adfm.202400379 · Cited by 37
Exploration of Ultrasound‐Sensitive Biomaterials in Cancer Theranostics
Yang, Y., Liang, H., Tang, C. Y., Cheng, Y., & Cheng, L. (2024) · Advanced Functional Materials · doi:10.1002/adfm.202313454 · Cited by 35
Self-citationMeng, X., Liu, Z., Deng, L., Yang, Y., Zhu, Y., Sun, X., Hao, Y., He, Y., & Fu, J. (2024) · Advanced Science · doi:10.1002/advs.202401269 · Cited by 39
Self-citationCalcium Hydride‐Based Dressing to Promote Wound Healing
Gong, F., Yang, N., Xu, J., Yang, X., Wei, K., Hou, L., Liu, B., Zhao, H., Liu, Z., & Cheng, L. (2022) · Advanced Healthcare Materials · doi:10.1002/adhm.202201771 · Cited by 39
Self-citationZinc sulfide nanoparticles serve as gas slow-release bioreactors for H2S therapy of ischemic stroke
Li, G., Zhang, R., Chen, K., Dong, J., Yang, Z., Chen, H., Wang, H., Wang, H., Lei, H., Bao, W., et al. (2024) · Biomaterials · doi:10.1016/j.biomaterials.2024.122912 · Cited by 35
Self-citationNanocatalytic Anti‐Tumor Immune Regulation
Li, M., Jiang, H., Hu, P., & Shi, J. (2024) · Angewandte Chemie International Edition · doi:10.1002/anie.202316606 · Cited by 34
Pei, Z., Li, L., Yang, N., Sun, S., Jiang, N., & Cheng, L. (2024) · Coordination Chemistry Reviews · doi:10.1016/j.ccr.2024.215969 · Cited by 34
Self-citationAdvanced implantable energy storage for powering medical devices
Wang, S., Wei, L., Wang, F., Wang, L., & Mao, J. (2025) · eScience · doi:10.1016/j.esci.2025.100409 · Cited by 34
Xie, Y., Li, Q., Huang, L., Wang, P., Wang, T., Bai, M., Guo, J., Geng, W., Wang, X., Qiao, W., et al. (2025) · Journal of the American Chemical Society · doi:10.1021/jacs.5c04242 · Cited by 32
Self-citationImplantable Batteries for Bioelectronics
Jiao, Y., He, E., Ye, T., Wang, Y., Yin, H., & Zhang, Y. (2025) · Accounts of Materials Research · doi:10.1021/accountsmr.4c00342 · Cited by 30
Zhang, W., Hu, X., Cheng, W., Zhang, L., Chen, Y., Fu, Q., Liu, L., & Fan, S. (2025) · BMEMat · doi:10.1002/bmm2.70019 · Cited by 30
Gong, F., Zheng, L., Xu, J., Wu, Y., Jin, Q., Lu, J., Pei, Z., Zhao, Z., Chen, M., Tu, J., et al. (2025) · Science Advances · doi:10.1126/sciadv.adv0885 · Cited by 29
Self-citationRecent advances in implantable batteries: Development and challenge
Zhai, L., Duan, J., Lin, T., & Shao, H. (2024) · Journal of Alloys and Compounds · doi:10.1016/j.jallcom.2024.173551 · Cited by 28
Zhang, H., Wang, Y., Qiang, H., Leng, D., Yang, L., Hu, X., Chen, F., Zhang, T., Gao, J., & Yu, Z. (2024) · Materials Today Bio · doi:10.1016/j.mtbio.2024.101276 · Cited by 28
Kang, H., Chen, L., Li, Q., Chen, H., & Zhang, L. (2023) · ACS Applied Materials & Interfaces · doi:10.1021/acsami.2c22578 · Cited by 28
Wang, H., He, W., Liao, J., Wang, S., Dai, X., Yu, M., Xie, Y., & Chen, Y. (2024) · Advanced Materials · doi:10.1002/adma.202411967 · Cited by 25
Advances in biomaterials and regenerative medicine for diabetic foot ulcer therapy
Li, Y., Lai, X., Cheong, H.-F., Gui, D., Zhao, Y.-H., & Xu, Y. (2025) · Ageing Research Reviews · doi:10.1016/j.arr.2025.102779 · Cited by 26
Sun, S., Yang, N., Nie, J., Pei, Z., Wang, C., Yang, Z., Han, Z., Cai, Y., & Cheng, L. (2025) · Biomaterials · doi:10.1016/j.biomaterials.2025.123652 · Cited by 24
Self-citationProtection of zero-valent iron nanoparticles against sepsis and septic heart failure
Wang, D., Wang, C., Liang, Z., Lei, W., Deng, C., Liu, X., Jiang, S., Zhu, Y., Zhang, S., Yang, W., et al. (2022) · Journal of Nanobiotechnology · doi:10.1186/s12951-022-01589-1 · Cited by 24
A Mitochondrion‐Inspired Magnesium–Oxygen Biobattery with High Energy Density In Vivo
He, E., Ren, J., Wang, L., Li, F., Li, L., Ye, T., Jiao, Y., Li, D., Wang, J., Wang, Y., et al. (2023) · Advanced Materials · doi:10.1002/adma.202304141 · Cited by 24
Bioorthogonal Regulated Metabolic Balance for Promotion of Ferroptosis and Mild Photothermal Therapy
Huang, Y., Zhao, H., Zhang, Y., Zhao, C., Ren, J., & Qu, X. (2024) · ACS Nano · doi:10.1021/acsnano.4c07558 · Cited by 23
Wang, D., Zhang, L., Yang, W., Zhang, L., Yu, C., Qin, J., Feng, L., Liu, Z., & Teng, G. (2024) · Advanced Science · doi:10.1002/advs.202410484 · Cited by 23
Self-citationSha, X., Wang, C., Liu, Y., Zhong, N., Lu, Y., Zhang, Q., Lu, S.-F., He, D., Jin, Y., Tang, Y., et al. (2025) · Journal of Nanobiotechnology · doi:10.1186/s12951-025-03307-z · Cited by 22
Research on the Current Application Status of Magnesium Metal Stents in Human Luminal Cavities
Chen, X., Xia, Y., Shen, S., Wang, C., Zan, R., Yu, H., Yang, S., Zheng, X., Yang, J., Suo, T., et al. (2023) · Journal of Functional Biomaterials · doi:10.3390/jfb14090462 · Cited by 22
Zhao, J., Bian, E., Zhang, R., Xu, T., Nie, Y., Wang, L., Jin, G., Xie, H., Xiang, H., Chen, Y., et al. (2024) · Advanced Science · doi:10.1002/advs.202309542 · Cited by 22
Cao, J., Han, Z., Sun, S., Li, C., Pan, X., Li, J., Zheng, J., Wang, Z., Yang, Y., Zhang, Z., et al. (2025) · Advanced Functional Materials · doi:10.1002/adfm.202500115 · Cited by 23
Self-citationBiohybrid Microrobot Enteric‐Coated Microcapsule for Oral Treatment of Colorectal Cancer
Kang, Y., She, Y., Zang, Y., Yuan, M., Niu, G., Tian, X., Zhang, L., Lin, J., Yang, M., Pei, Z., et al. (2025) · Advanced Materials · doi:10.1002/adma.202420586 · Cited by 22
Self-citationAdvanced Biomaterials with Intrinsic Immunomodulation Effects for Cancer Immunotherapy
Chen, W., Li, C., & Jiang, X. (2023) · Small Methods · doi:10.1002/smtd.202201404 · Cited by 22
Xu, H. J., Yuan, X., Rao, Y., Gao, S., Guo, J., & Yan, F. (2024) · ACS Applied Materials & Interfaces · doi:10.1021/acsami.4c07104 · Cited by 22
Biodegradable power sources for transient bioelectronics
Dong, L., Shan, L., Wang, Y., & Liu, J. (2024) · Supramolecular Materials · doi:10.1016/j.supmat.2024.100082 · Cited by 21
Li, R., Wang, T., Mu, S., Xing, Z., Ding, Z., Wen, Q., Wei, Z., Wang, X., Adeli, M., Li, S., et al. (2025) · Nature Communications · doi:10.1038/s41467-025-62999-x · Cited by 21
Self-citationLi, J., Wang, G., Wen, Z., Sun, S., Han, Z., Yang, Y., Wu, J., Pei, Z., Liu, L., Chen, Y., et al. (2024) · Advanced Materials · doi:10.1002/adma.202412925 · Cited by 22
Self-citationMechanism and application prospect of magnesium-based materials in cancer treatment
Ma, Y., Wang, Y., Song, S., Yu, X., Xu, C., Wan, L., Yao, F., Yang, K., Witte, F., & Yang, S. (2025) · Journal of Magnesium and Alloys · doi:10.1016/j.jma.2025.02.010 · Cited by 20
Mesoporous carbon nanoparticles embedded with iron in hydrogen-photothermal synergistic therapy
Wang, Z., Zhou, X. F., Chen, X., Li, L., Wang, T., Zhan, W., Zhang, L., & Wang, C. (2024) · Journal of Colloid and Interface Science · doi:10.1016/j.jcis.2024.02.064 · Cited by 20
Shi, Q., Yin, T., Zeng, C., Pan, H., Chen, Z., Wang, L., Wang, B., Zheng, M., & Cai, L. (2024) · Bioactive Materials · doi:10.1016/j.bioactmat.2024.03.032 · Cited by 20
Xu, Z., He, Y., Zhang, X., Tu, W., Li, X., Wang, D., Yan, Y., Gao, J., Wang, D., & Gao, D. (2024) · Advanced Healthcare Materials · doi:10.1002/adhm.202401741 · Cited by 19
Zhang, L. L., Zhu, C., Zhao, J., Scimeca, L., Dong, M., Liu, R., Jia, Y., & Xu, Z. P. (2024) · Advanced Functional Materials · doi:10.1002/adfm.202311914 · Cited by 21
Li, H., Li, Y., Su, L., Zheng, K., Zhang, Y., Li, J., Lv, F., Huang, M., Chen, T., Zhang, H., et al. (2024) · Advanced Science · doi:10.1002/advs.202308251 · Cited by 19
Flexocatalysis Enhances Tumor Photodynamic Therapy
Li, A., Xu, L., Jia, Y., Yuan, M., Zhang, J., Liu, H. F., Liu, S., Zhu, Y., Wei, X., Tu, W., et al. (2024) · Small · doi:10.1002/smll.202310964 · Cited by 19
Stimuli‐responsive magnesium‐based materials for biomedical applications: A review
Wang, X., Zhao, Y., Dong, Q., Chu, C., Xue, F., Wang, C., & Bai, J. (2025) · Responsive materials · doi:10.1002/rpm.20240037 · Cited by 18
Self-citationLiu, X., Li, J., Zhang, F., Yan, D., Wang, L., Wang, D., & Tang, B. Z. (2024) · Science China Chemistry · doi:10.1007/s11426-024-2086-8 · Cited by 18
A highly degradable Mg-Al-Ca alloy with superior anti-tumor efficacy
Chen, Q., Fan, Y., Dong, S., Han, P., Xie, T., Wang, C., Zeng, X., Ding, W., Meng, Z., & Wang, L. (2023) · Journal of Magnesium and Alloys · doi:10.1016/j.jma.2023.07.018 · Cited by 17
Wang, S., Liang, J., Ding, R., Zhao, W., Zhang, J., Peng, P., Chai, J., Yan, Y., & Peng, L. (2025) · Journal of Controlled Release · doi:10.1016/j.jconrel.2025.114247 · Cited by 16
Advances in responsive liquid metal composites for cancer therapy
Yang, N., Gong, F., Ge, J., Wang, L., Wang, G., & Cheng, L. (2022) · Materials Today Nano · doi:10.1016/j.mtnano.2022.100285 · Cited by 16
Self-citationSong, Q., Liu, Y., Ding, X., Feng, M., Li, J., Liu, W., Wang, B., & Gu, Z. (2023) · Nanoscale · doi:10.1039/d3nr01548c · Cited by 16
Biomedical engineering targeting cancer stem cells to reinforce cancer therapy
Sun, S., Yang, N., Pei, Z., Gong, F., & Cheng, L. (2025) · Coordination Chemistry Reviews · doi:10.1016/j.ccr.2025.216494 · Cited by 16
Self-citationLiu, L., Liu, T., & Cheung, T. T. (2024) · Journal of Magnesium and Alloys · doi:10.1016/j.jma.2024.11.014 · Cited by 15
Cao, Z., Xin, R., Ma, Q., Wang, Q., Feng, S., Su, H., Zhao, A., Li, K., Liu, S., He, L., et al. (2025) · ACS Nano · doi:10.1021/acsnano.5c10754 · Cited by 15
Yang, N., Cai, Y., Sun, S., Nie, J., Gong, F., Pei, Z., & Cheng, L. (2025) · Advanced Drug Delivery Reviews · doi:10.1016/j.addr.2025.115717 · Cited by 15
Self-citationPosada, V. M., Ramírez, J., Civantos, A., Fernández‐Morales, P., & Allain, J. P. (2023) · Colloids and Surfaces B Biointerfaces · doi:10.1016/j.colsurfb.2023.113717 · Cited by 15
Hydrogen evolution and dynamics in hydrogel electrochemical cells for ischemia–reperfusion therapy
Li, W., Zhang, J., Nith, R., Yue, J., Kamath, A., Yang, C., Chen, W., Lee, B., Li, P., Tsai, H., et al. (2025) · Nature Chemical Engineering · doi:10.1038/s44286-025-00259-x · Cited by 14
Advances in hydrogen delivery strategies for therapeutic applications
Nguyen, L.-D.-H., Peng, S., Mac, C., Nguyen, N., Lo, S., Lin, P.-H., Pham, N.-S., Chang, H., Lin, Y., & Sung, H. (2025) · Advanced Drug Delivery Reviews · doi:10.1016/j.addr.2025.115734 · Cited by 14
Mei, R., Sun, J., Cao, S., Shi, M., Song, Z., Hua, F., Zhou, G., Zhang, M., & Liu, J. (2024) · Acta Biomaterialia · doi:10.1016/j.actbio.2024.09.006 · Cited by 14
Micro-/nanomotors as platforms for gas therapy
Sun, S., Liu, Y., Wang, S., Gui, Q., Liu, W., & Long, W. (2025) · Biomaterials · doi:10.1016/j.biomaterials.2025.123492 · Cited by 16
Zhang, L., Sun, S., Wang, D., Yang, N., Wang, D., Nie, J., Pei, Z., Qin, J., Zhang, L., Zhu, H., et al. (2025) · Advanced Science · doi:10.1002/advs.202511144 · Cited by 13
Self-citationChen, S., Li, M., Zhang, Y., Dong, Y., Wu, J., Li, L., Guo, X., Liu, X., Hou, J., & Zhou, S. (2025) · Science Advances · doi:10.1126/sciadv.adw4212 · Cited by 13
Lin, Z., Wei, Y., & Yang, H. (2024) · APL Bioengineering · doi:10.1063/5.0191800 · Cited by 13
Yin, J., Sun, W., Xiong, H., Yao, W., Liu, X., Jiang, H., & Wang, X. (2025) · Biomaterials · doi:10.1016/j.biomaterials.2025.123388 · Cited by 13
Self-citationZhang, L., Wang, D., Liu, Y., Yang, N., Sun, S., Wang, C., Wang, D., Nie, J., Qin, J., Zhang, L., et al. (2025) · Bioactive Materials · doi:10.1016/j.bioactmat.2025.07.040 · Cited by 13
Self-citationChen, L., Cheng, S., Lu, S., Gao, X., Gong, F., Shi, J., Han, Z., Wang, Y., Yang, X., Zhou, X., et al. (2024) · Small · doi:10.1002/smll.202306315 · Cited by 12
Self-citationNanocatalytic Anti‐Tumor Immune Regulation
Li, M., Jiang, H., Hu, P., & Shi, J. (2024) · Angewandte Chemie · doi:10.1002/ange.202316606 · Cited by 12
Metadata
- Authors
- Yang, N., Gong, F., Liu, B., Hao, Y., Chao, Y., Lei, H., Yang, X., Gong, Y., Wang, X., Liu, Z., & Cheng, L.
- Affiliations
- Soochow University (CN)
- Corresponding author
- Liu, Zhuang
- Cheng, Liang
- ORCID
- Venue
- Nature Communications
- Published
- 2022-04-28
- Volume
- 13
- Issue
- 1
- Pages
- 2336-2336
- ISSN
- 2041-1723 (ISSN-L)
- PMC
- PMC9051066
- OpenAlex
- W4225002645
- Cited by
- 196
- References
- 52
- Citations by year
- 2026: 32 · 2025: 70 · 2024: 62 · 2023: 23 · 2022: 9
- FWCI
- 39.19
- Type
- journal article
- Language
- en
- Open access
- gold
- doi.org
- Locations
- Nature Communications (publishedVersion, cc-by)
- PubMed Central (publishedVersion, cc-by)
- PubMed (publishedVersion)
- RePEc: Research Papers in Economics (submittedVersion)
- DOAJ (DOAJ: Directory of Open Access Journals) (submittedVersion, cc-by-sa)
- Funders
- National Natural Science Foundation of China (U20A20254, 52072253)
- Topics
- Life Sciences › Pharmacology, Toxicology and Pharmaceutics › Pharmacology › Hydrogen's biological and therapeutic effects
- Physical Sciences › Materials Science › Materials Chemistry › Hydrogen Storage and Materials
- Physical Sciences › Engineering › Biomedical Engineering › Nanoplatforms for cancer theranostics
- Keywords
- hydrogen treatment, tumor microenvironment, mitochondrial dysfunction, redox homeostasis, magnesium hydroxide, cancer growth inhibition, patient-derived xenografts
- MeSH terms
- Alloys, Animals, Humans, Hydrogen, Magnesium, Neoplasms, Rabbits, Mice, Tumor Microenvironment
About these checks
Registry, retraction, Cites and statistics results are computed, not judged, with one exception: a printed reference that no index lists is read once by a model before it counts as a citation error. Claims are extracted by a model and kept only when their quote appears verbatim in the text; each cited source is then checked, with a model’s help, for whether it says what the claim relies on. Those verdicts can be wrong — read the claim’s quote and the cited source before relying on one.
Statistics and arithmetic are recomputed, not judged.
Confidence bands are shown only for fields calibrated on our annotated test set. None is calibrated yet, so no band is shown.
What counts as a claim ›How we measure confidence ›How we check this ›
Are you an author, or do you see a problem with this page? Request a review
