Cited by 107Antifungal resistance and susceptibilityFungal and yeast genetics researchFungal Infections and Studies

The DOI matches its Crossref record; 70 of the 70 references it cites were found in a registry or an index.

Innate immune responses against the fungal pathogen Candida auris

Open access

Abstract

Candida auris is a multidrug-resistant human fungal pathogen responsible for nosocomial outbreaks worldwide. Although considerable progress has increased our understanding of the biological and clinical aspects of C. auris, its interaction with the host immune system is only now beginning to be investigated in-depth. Here, we compare the innate immune responses induced by C. auris BJCA001 and Candida albicans SC5314 in vitro and in vivo. Our results indicate that C. auris BJCA001 appears to be less immunoinflammatory than C. albicans SC5314, and this differential response correlates with structural features of the cell wall.

Overview

The claims and statistics of this paper haven’t been checked yet.

Run the check — free, no account needed. It reads the open-access text and checks the sources it cites.

A few free checks a day · papers already verified open instantly · results are public

Integrity signals

Registry

Crossref · 10.1038/s41467-022-31201-x

Cites

70 of 70 references verified0 citation errors · 0 not checkable

Statistics

Figures

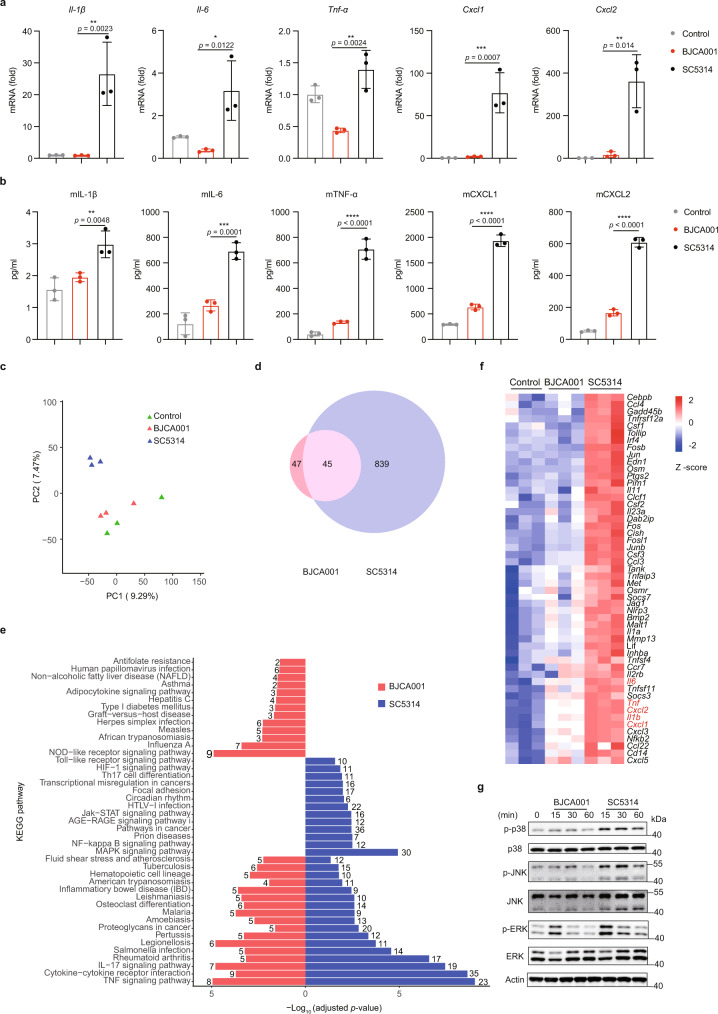
Fig. 1 In vitro studies showing that C. auris BJCA001 induces a less potent innate immune response than C. albicans SC5314. a Expression levels of IL-1β, IL-6, TNF-α, CXCL1, and CXCL2, as determined by real-time RT-qPCR, in BMDMs that were infected without (PBS; negative control) or with live C. auris or C. albicans yeast cells (MOI = 5) for 3 h (n = 3 biologically independent samples). Results were normalized to the expression of the control gene GAPDH and are presented relative to those of negative control, set as 1. b Production of IL-1β, IL-6, TNF-α, CXCL1, and CXCL2, as determined by ELISA, in the culture supernatants of BMDM that were infected without or with live C. auris or C. albicans yeast cells (MOI = 5) for 6 h (n = 3). c Principal component analysis (PCA) of the normalized RNA-seq data of BMDMs in response to challenge with PBS (control), live C. auris or C. albicans yeast cells (MOI = 5) for 6 h. d Venn diagram showing differentially expressed genes (DEGs; fold change ≥2, adjusted p ≤ 0.05). The number in each circle represents the total number of genes that are differentially expressed in each sample, and the overlapping part of circles indicates that the gene is down- or upregulated in both samples. e A schematic diagram of a bar chart for the top 30 enriched KEGG pathways ranked according to their values of −log10 (adjusted p value). The number of DEGs in a given pathway is listed. f Heatmap of changes in gene expression of selected innate immune-related genes. g Immunoblot analysis for the indicated MAPKs using lysates from BMDMs that were infected with live C. auris or C. albicans yeast cells (MOI = 5) for the indicated amounts of time. Data are representative of two independent experiments. Data are expressed as mean ± SD and are representative of three independent experiments. *p < 0.05, **p < 0.01, ***p < 0.001, ****p < 0.0001, by one-way ANOVA with Sidak’s test (a, b). Source data are provided as a Source Data file.
Fig. 1 In vitro studies showing that C. auris BJCA001 induces a less potent innate immune response than C. albicans SC5314. a Expression levels of IL-1β, IL-6, TNF-α, CXCL1, and CXCL2, as determined by real-time RT-qPCR, in BMDMs that were infected without (PBS; negative control) or with live C. auris or C. albicans yeast cells (MOI = 5) for 3 h (n = 3 biologically independent samples). Results were normalized to the expression of the control gene GAPDH and are presented relative to those of negative control, set as 1. b Production of IL-1β, IL-6, TNF-α, CXCL1, and CXCL2, as determined by ELISA, in the culture supernatants of BMDM that were infected without or with live C. auris or C. albicans yeast cells (MOI = 5) for 6 h (n = 3). c Principal component analysis (PCA) of the normalized RNA-seq data of BMDMs in response to challenge with PBS (control), live C. auris or C. albicans yeast cells (MOI = 5) for 6 h. d Venn diagram showing differentially expressed genes (DEGs; fold change ≥2, adjusted p ≤ 0.05). The number in each circle represents the total number of genes that are differentially expressed in each sample, and the overlapping part of circles indicates that the gene is down- or upregulated in both samples. e A schematic diagram of a bar chart for the top 30 enriched KEGG pathways ranked according to their values of −log10 (adjusted p value). The number of DEGs in a given pathway is listed. f Heatmap of changes in gene expression of selected innate immune-related genes. g Immunoblot analysis for the indicated MAPKs using lysates from BMDMs that were infected with live C. auris or C. albicans yeast cells (MOI = 5) for the indicated amounts of time. Data are representative of two independent experiments. Data are expressed as mean ± SD and are representative of three independent experiments. *p < 0.05, **p < 0.01, ***p < 0.001, ****p < 0.0001, by one-way ANOVA with Sidak’s test (a, b). Source data are provided as a Source Data file.CC BY · PubMed Central
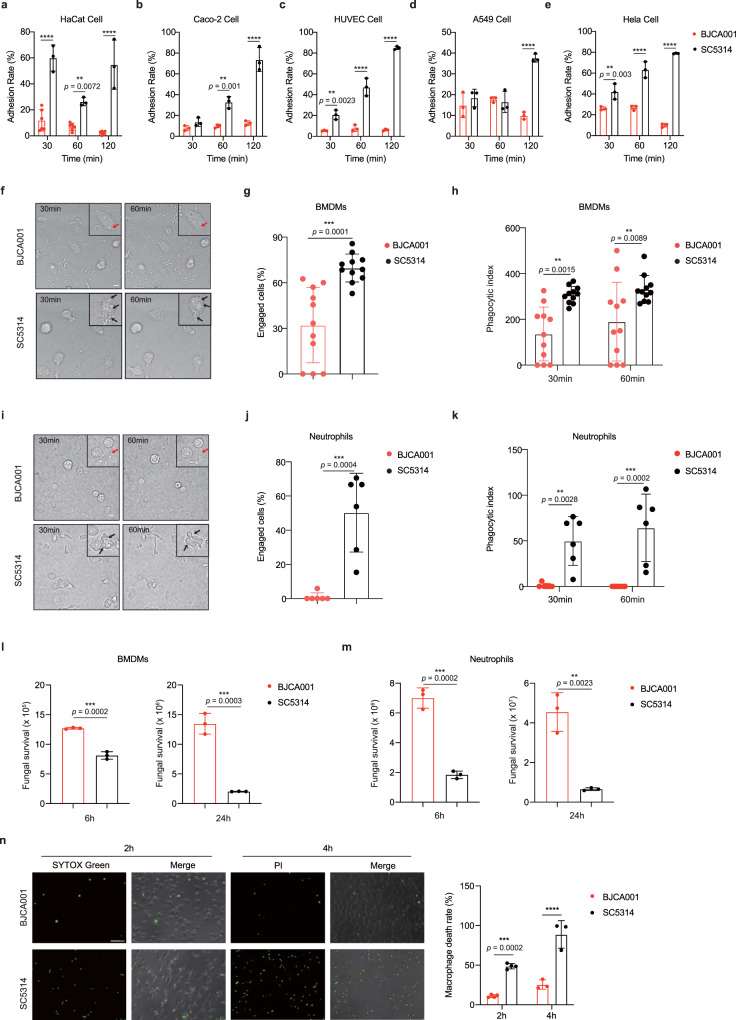
Fig. 2 C. auris BJCA001 is weakly recognized by the host cells, compared with C. albicans SC5314. a–e Time course of adherence to the human skin keratinocyte cell line (HaCat) (a), human colorectal adenocarcinoma cell line (Caco-2) (b), human umbilical vein endothelial cell line (HUVEC) (c), human adenocarcinoma cancer cell line (A549) (d) and human HeLa cells (e) by C. auris BJCA001 and C. albicans SC5314. Adherence of Candida species to epithelial or endothelial cells was determined by counting the adhering CFU of the yeast and expressed as the percentage of the original inoculum (n = 3). f Representative snapshots were taken from live-cell videos after 30 and 60 mins co-incubation of murine BMDMs with live C. albicans SC5314 and C. auris BJCA001 cells (MOI = 1). The numbers in the upper left corner of each image represent the time of the phagocytic events, arrows indicate the fungal cells engulfed by BMDMs (scare bar = 10 μm). g, h Percentage uptake and phagocytic index for BMDMs ingesting C. albicans and C. auris (n = 11). Macrophages that have taken up at least one fungal cells were manually tracked to allow a quantitative analysis of percentage uptake during the 60 min co-incubation (g). The number of fungal cells ingested (phagocytic index) per 100 macrophages was manually counted during the 30 and 60 min co-incubation (h). i–k Live-cell imaging data from co-incubations with murine neutrophils and C. albicans or C. auris (MOI = 1). Data were analyzed using exactly the same methods described in f–h (n = 6). l, m The survival of C. albicans and C. auris after infection of murine BMDMs (l) or neutrophils (m) at a MOI of 1 for 6 and 24 h was evaluated by plating dilutions of sample on YPD agar (n = 3). n C. auris or C. albicans cells were co-cultured with murine BMDMs at MOI = 5 for 2 h and 4 h, and samples were stained by membrane-impermeable fluorescent dyes such as SYTOX green (2 h; n = 4) or PI (4 h; n = 3) and the nonviable cells (green) were examined by fluorescent microscope (Olympus IX73). Acquired images were automatically analyzed by ImageJ image analysis software (NIH, Bethesda, MD, USA). The dead BMDM cells were counted by the count function of ImageJ. Scare bar = 10 μm. Each data were analyzed by 10 different images. Data are representative of at least three independent experiments. Data are expressed as mean ± SD and are representative of three independent experiments. **p < 0.01; ***p < 0.001; ****p < 0.0001; by two-way ANOVA with Sidak’s test (a–e, h, k, n) or two-side unpaired t test (g, j, l, m). Source data are provided as a Source Data file.
Fig. 2 C. auris BJCA001 is weakly recognized by the host cells, compared with C. albicans SC5314. a–e Time course of adherence to the human skin keratinocyte cell line (HaCat) (a), human colorectal adenocarcinoma cell line (Caco-2) (b), human umbilical vein endothelial cell line (HUVEC) (c), human adenocarcinoma cancer cell line (A549) (d) and human HeLa cells (e) by C. auris BJCA001 and C. albicans SC5314. Adherence of Candida species to epithelial or endothelial cells was determined by counting the adhering CFU of the yeast and expressed as the percentage of the original inoculum (n = 3). f Representative snapshots were taken from live-cell videos after 30 and 60 mins co-incubation of murine BMDMs with live C. albicans SC5314 and C. auris BJCA001 cells (MOI = 1). The numbers in the upper left corner of each image represent the time of the phagocytic events, arrows indicate the fungal cells engulfed by BMDMs (scare bar = 10 μm). g, h Percentage uptake and phagocytic index for BMDMs ingesting C. albicans and C. auris (n = 11). Macrophages that have taken up at least one fungal cells were manually tracked to allow a quantitative analysis of percentage uptake during the 60 min co-incubation (g). The number of fungal cells ingested (phagocytic index) per 100 macrophages was manually counted during the 30 and 60 min co-incubation (h). i–k Live-cell imaging data from co-incubations with murine neutrophils and C. albicans or C. auris (MOI = 1). Data were analyzed using exactly the same methods described in f–h (n = 6). l, m The survival of C. albicans and C. auris after infection of murine BMDMs (l) or neutrophils (m) at a MOI of 1 for 6 and 24 h was evaluated by plating dilutions of sample on YPD agar (n = 3). n C. auris or C. albicans cells were co-cultured with murine BMDMs at MOI = 5 for 2 h and 4 h, and samples were stained by membrane-impermeable fluorescent dyes such as SYTOX green (2 h; n = 4) or PI (4 h; n = 3) and the nonviable cells (green) were examined by fluorescent microscope (Olympus IX73). Acquired images were automatically analyzed by ImageJ image analysis software (NIH, Bethesda, MD, USA). The dead BMDM cells were counted by the count function of ImageJ. Scare bar = 10 μm. Each data were analyzed by 10 different images. Data are representative of at least three independent experiments. Data are expressed as mean ± SD and are representative of three independent experiments. **p < 0.01; ***p < 0.001; ****p < 0.0001; by two-way ANOVA with Sidak’s test (a–e, h, k, n) or two-side unpaired t test (g, j, l, m). Source data are provided as a Source Data file.CC BY · PubMed Central
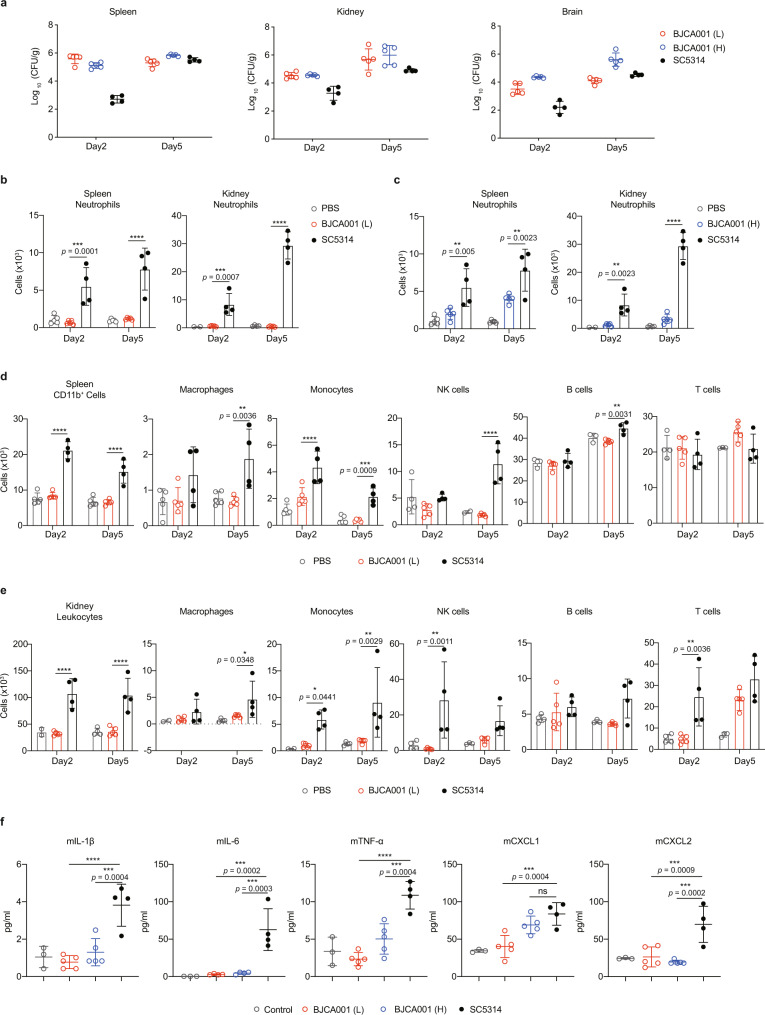
Fig. 3 In vivo studies showing that C. auris BJCA001 induces a less potent innate immune response than C. albicans SC5314. a Quantitative fungal burden of spleen, kidney, and brain of C57BL/6 mice (n = 5 mice/group/time point) intravenously infected with either 1 × 10⁶ (L) or 2 × 10⁷ (H) of C. auris yeast cells at day 2 and 5 post-inoculations. For comparison, a parallel experiment was conducted using C. albicans (5 × 10⁴ CFU; n = 4 mice/group/time point). b, c Shown are neutrophil populations in spleen (b) and kidney (c) cell suspensions of mice that were infected without (PBS, negative control) or with live C. auris (n = 5) or C. albicans (n = 4) for 2 and 5 days. The number of neutrophils was determined by flow cytometry. C. albicans was injected into mice at an inoculum of 5 × 10⁴ CFU and C. auris was injected at an inoculum of 1 × 10⁶ CFU(L) or 2 × 10⁷ CFU (H). d, e Shown are the major immune cell populations in spleen (d) and kidney (e) cell suspensions of mice treated as in b. The number of each immune population was determined by flow cytometry. f Serum cytokine and chemokine levels, as determined by ELISA, in mice treated as in a. Data are expressed as mean ± SD and are representative of three independent experiments. ns, no significance; *p < 0.05; **p < 0.01; ***p < 0.001; ****p < 0.0001; by two-way ANOVA with Tukey’s test (b–e) or one-way ANOVA with Dunnett’s test (f). Source data are provided as a Source Data file.
Fig. 3 In vivo studies showing that C. auris BJCA001 induces a less potent innate immune response than C. albicans SC5314. a Quantitative fungal burden of spleen, kidney, and brain of C57BL/6 mice (n = 5 mice/group/time point) intravenously infected with either 1 × 10⁶ (L) or 2 × 10⁷ (H) of C. auris yeast cells at day 2 and 5 post-inoculations. For comparison, a parallel experiment was conducted using C. albicans (5 × 10⁴ CFU; n = 4 mice/group/time point). b, c Shown are neutrophil populations in spleen (b) and kidney (c) cell suspensions of mice that were infected without (PBS, negative control) or with live C. auris (n = 5) or C. albicans (n = 4) for 2 and 5 days. The number of neutrophils was determined by flow cytometry. C. albicans was injected into mice at an inoculum of 5 × 10⁴ CFU and C. auris was injected at an inoculum of 1 × 10⁶ CFU(L) or 2 × 10⁷ CFU (H). d, e Shown are the major immune cell populations in spleen (d) and kidney (e) cell suspensions of mice treated as in b. The number of each immune population was determined by flow cytometry. f Serum cytokine and chemokine levels, as determined by ELISA, in mice treated as in a. Data are expressed as mean ± SD and are representative of three independent experiments. ns, no significance; *p < 0.05; **p < 0.01; ***p < 0.001; ****p < 0.0001; by two-way ANOVA with Tukey’s test (b–e) or one-way ANOVA with Dunnett’s test (f). Source data are provided as a Source Data file.CC BY · PubMed Central
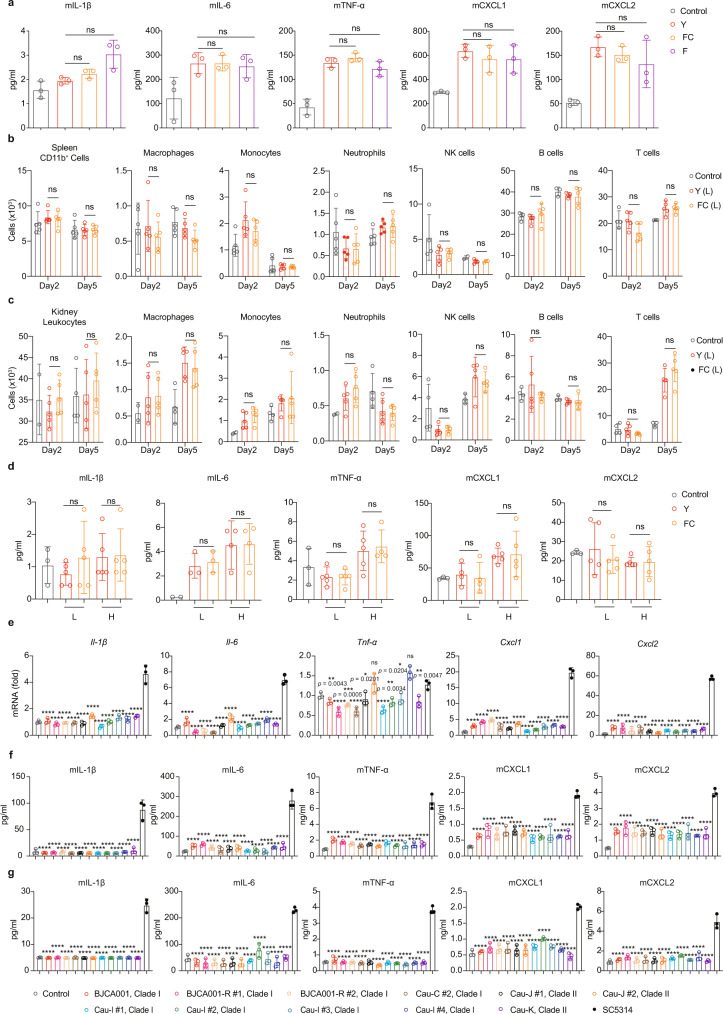
Fig. 4 Reduced innate immune response to C. auris is morphology-independent and functionally conserved. a Production of TNF-α, IL-6, IL-1β, CXCL1, and CXCL2, as determined by ELISA, in the culture supernatants of BMDM that were stimulated without (PBS) or with the yeast (Y), filamentation-competent (FC) yeast or filamentous (F) form of C. auris BJCA001 (MOI = 5) for 6 h (n = 3). b, c Shown are the major immune cell populations in spleen (b) and kidney (c) cell suspensions of mice that were infected without (PBS, negative control) or with the yeast (Y; n = 5) or filamentation-competent (FC; n = 5) yeast form of C. auris BJCA001 for 2 and 5 days. C. auris was injected into mice at an inoculum of 1× 10⁶ CFU (L). d Serum cytokine and chemokine levels were determined by ELISA, using mice treated as in b, c. e–g The innate immune response against various fluconazole-resistant clinical isolates of C. auris. e Expression of IL-1β, IL-6, TNF-α, CXCL1 and CXCL2 were analyzed by real-time RT-qPCR. BMDMs were stimulated without (PBS control) or with each of the eleven fluconazole-resistant clinical isolates of C. auris or C. albicans SC5314 at MOI = 5 for 3 h. Results were normalized to the expression of the control gene GAPDH and are presented relative to those of negative control, set as 1. f Production of the cytokines and chemokines were analyzed by ELISA after BMDMs were stimulated with indicated strains at MOI = 5 for 6 h (n = 3). g Similar to f, except for lower inoculum of C. auris (MOI = 0.1) and longer stimulation time (24 h). Data are expressed as mean ± SD and are representative of three independent experiments. ns, no significance; *p < 0.05; **p < 0.01; ***p < 0.001; ****p < 0.0001; by one-way ANOVA with Sidak’s test (a, d–g) or two-way ANOVA with Tukey’s test (b, c). Source data are provided as a Source Data file.
Fig. 4 Reduced innate immune response to C. auris is morphology-independent and functionally conserved. a Production of TNF-α, IL-6, IL-1β, CXCL1, and CXCL2, as determined by ELISA, in the culture supernatants of BMDM that were stimulated without (PBS) or with the yeast (Y), filamentation-competent (FC) yeast or filamentous (F) form of C. auris BJCA001 (MOI = 5) for 6 h (n = 3). b, c Shown are the major immune cell populations in spleen (b) and kidney (c) cell suspensions of mice that were infected without (PBS, negative control) or with the yeast (Y; n = 5) or filamentation-competent (FC; n = 5) yeast form of C. auris BJCA001 for 2 and 5 days. C. auris was injected into mice at an inoculum of 1× 10⁶ CFU (L). d Serum cytokine and chemokine levels were determined by ELISA, using mice treated as in b, c. e–g The innate immune response against various fluconazole-resistant clinical isolates of C. auris. e Expression of IL-1β, IL-6, TNF-α, CXCL1 and CXCL2 were analyzed by real-time RT-qPCR. BMDMs were stimulated without (PBS control) or with each of the eleven fluconazole-resistant clinical isolates of C. auris or C. albicans SC5314 at MOI = 5 for 3 h. Results were normalized to the expression of the control gene GAPDH and are presented relative to those of negative control, set as 1. f Production of the cytokines and chemokines were analyzed by ELISA after BMDMs were stimulated with indicated strains at MOI = 5 for 6 h (n = 3). g Similar to f, except for lower inoculum of C. auris (MOI = 0.1) and longer stimulation time (24 h). Data are expressed as mean ± SD and are representative of three independent experiments. ns, no significance; *p < 0.05; **p < 0.01; ***p < 0.001; ****p < 0.0001; by one-way ANOVA with Sidak’s test (a, d–g) or two-way ANOVA with Tukey’s test (b, c). Source data are provided as a Source Data file.CC BY · PubMed Central
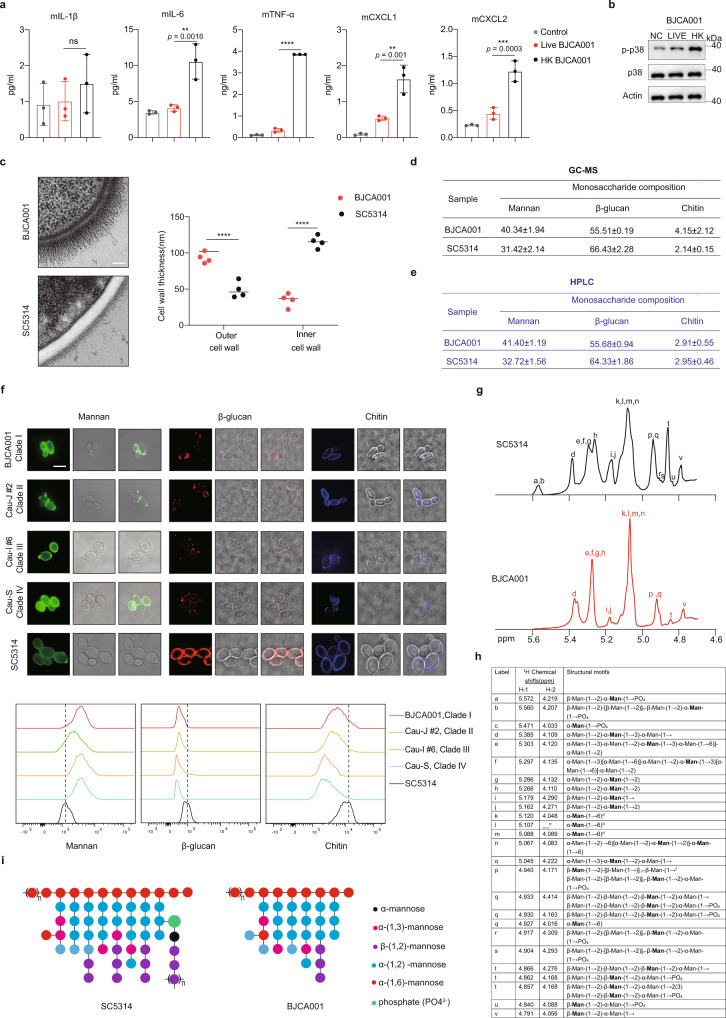
Fig. 5 The distinct structure of the cell wall mannan may shield C. auris from innate immune recognition. a, b The host innate immune response against live or heat-inactivated C. auris. BMDMs were stimulated with live or heat-killed (HK) C. auris yeast (65 °C for 3 h) at MOI = 5 for 24 h. a The production of IL-1β, IL-6, TNF-α, CXCL1, and CXCL2 were analyzed by ELISA (n = 3). b Cell lysates were subjected to immunoblotting analysis using the indicated p38 MAPK antibodies. Data are representative of two independent experiments. c TEM imaging shows the ultrastructural architecture of C. auris and C. albicans cell wall (left panel, Scale bar = 100 nm). Mannan fibril length (right panel) was measured in four randomly selected cells (n = 4). Each cell was measured 10 times in different locations. d, e The monosaccharide composition of the cell wall, as determined by GC-MS (d) and HPLC (e), in C. auris and C. albicans. Values are percentage of each molecule. f Representative fluorescence micrographs showing the three main polysaccharide layers of C. auris or C. albicans cell wall. Exponentially growing fungal cells were stained with ConA-FITC to visualize mannan, Fc-Dectin-1 to visualize β-glucan, and calcofluor white (CFW) to visualize chitin. Scale bar, 5 μm. The intensity of fluorescence representing the level of mannan, β-glucan, or chitin (upper) and was quantified by flow cytometry (bottom). Data are representative of three independent and reproducible experiments. g, h Chemical structure of the cell wall mannan, as determined by NMR analysis, in C. auris BJCA001 and C. albicans SC5314. g The proton NMR spectra of mannans isolated from C. albicans and C. auris cell wall isolations, showing the structural variations. h The proton 1H chemical shift and structural motif assignments are presented for the mannans of C. albicans and C. auris. i Proposed mannan structures of C. albicans and C. auris, as identified by NMR. Data are expressed as mean ± SD and are representative of three independent experiments. ns, no significance; **p < 0.01; ***p < 0.001, ****p < 0.0001; by one-way ANOVA with Sidak’s test (a, c). Source data are provided as a Source Data file.
Fig. 5 The distinct structure of the cell wall mannan may shield C. auris from innate immune recognition. a, b The host innate immune response against live or heat-inactivated C. auris. BMDMs were stimulated with live or heat-killed (HK) C. auris yeast (65 °C for 3 h) at MOI = 5 for 24 h. a The production of IL-1β, IL-6, TNF-α, CXCL1, and CXCL2 were analyzed by ELISA (n = 3). b Cell lysates were subjected to immunoblotting analysis using the indicated p38 MAPK antibodies. Data are representative of two independent experiments. c TEM imaging shows the ultrastructural architecture of C. auris and C. albicans cell wall (left panel, Scale bar = 100 nm). Mannan fibril length (right panel) was measured in four randomly selected cells (n = 4). Each cell was measured 10 times in different locations. d, e The monosaccharide composition of the cell wall, as determined by GC-MS (d) and HPLC (e), in C. auris and C. albicans. Values are percentage of each molecule. f Representative fluorescence micrographs showing the three main polysaccharide layers of C. auris or C. albicans cell wall. Exponentially growing fungal cells were stained with ConA-FITC to visualize mannan, Fc-Dectin-1 to visualize β-glucan, and calcofluor white (CFW) to visualize chitin. Scale bar, 5 μm. The intensity of fluorescence representing the level of mannan, β-glucan, or chitin (upper) and was quantified by flow cytometry (bottom). Data are representative of three independent and reproducible experiments. g, h Chemical structure of the cell wall mannan, as determined by NMR analysis, in C. auris BJCA001 and C. albicans SC5314. g The proton NMR spectra of mannans isolated from C. albicans and C. auris cell wall isolations, showing the structural variations. h The proton 1H chemical shift and structural motif assignments are presented for the mannans of C. albicans and C. auris. i Proposed mannan structures of C. albicans and C. auris, as identified by NMR. Data are expressed as mean ± SD and are representative of three independent experiments. ns, no significance; **p < 0.01; ***p < 0.001, ****p < 0.0001; by one-way ANOVA with Sidak’s test (a, c). Source data are provided as a Source Data file.CC BY · PubMed Central
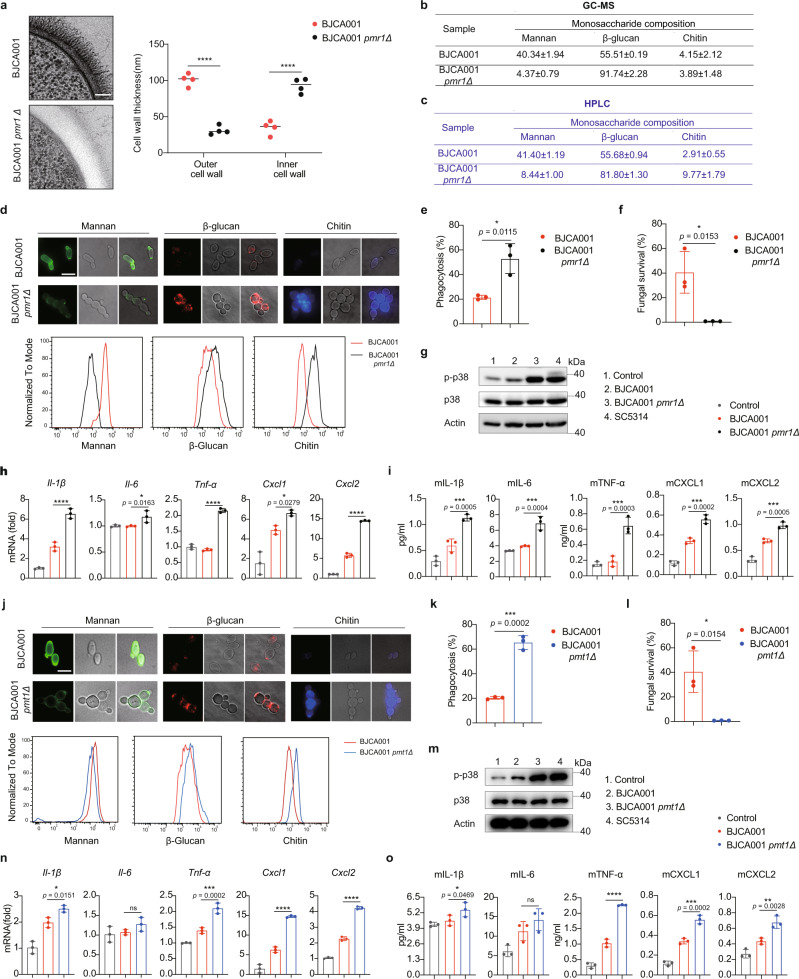
Fig. 6 C. auris mutants with impaired cell wall mannosylation trigger more potent innate immune activation. a TEM imaging shows the ultrastructural architecture of wild type and pmr1Δ in C. auris cell wall. Mannan fibril length was measured in four randomly selected cells (n = 4). Each cell was measured 10 times in different locations. Scale bar = 100 nm. b, c The monosaccharide composition of the cell wall, as determined by GC-MS (b) and HPLC (c), in C. auris WT or pmr1Δ mutant. d Representative fluorescence micrographs showing the three main polysaccharide layers of wild type and pmr1Δ mutant cell wall. Exponentially growing fungal cells were stained with ConA-FITC to visualize mannan, Fc-Dectin-1 to visualize β-glucan, and calcofluor white (CFW) to visualize chitin. Scale bar, 5 μm. The intensity of fluorescence represents the level of mannan, β-glucan, or chitin (upper) and was quantified by flow cytometry (bottom). Data are representative of three independent and reproducible experiments. e, f BMDMs were infected with C. auris WT or pmr1Δ mutant at an MOI of 1. The phagocytized fungal cells at 1 h post infection (e) or the survived fungal cells at 24 h post infection (f) were harvested, diluted, and plated on YPD agar (n = 3). g BMDMs were infected with indicated strains and cell lysates were subjected to immunoblotting analysis using the indicated p38 MAPK antibodies. h Expression levels of IL-1β, IL-6, TNF-α, CXCL1, and CXCL2, as determined by real-time RT-qPCR, in BMDMs that were infected without (PBS control) or with live C. auris WT or pmr1Δ mutant (MOI = 5) for 3 h (n = 3). Results were normalized to the expression of the control gene GAPDH and are presented relative to those of negative control, set as 1. i Production of IL-1β, IL-6, TNF-α, CXCL1, and CXCL2, as determined by ELISA, in the culture supernatants of BMDMs that were infected without (PBS control) or with live C. auris WT or pmr1Δ mutant (MOI = 5) for 6 h (n = 3). j Representative fluorescence micrographs showing the three main polysaccharide layers of wild type and pmt1Δ mutant cell wall. k, l As in e, f, BMDMs were infected with C. auris WT or pmt1Δ mutant at an MOI of 1. The phagocytized fungal cells at 1 h post-infection (k) or the survived fungal cells at 24 h post infection (l) were determined by CFU counting (n = 3). m–o The same as g–I, except the indicated strains (n = 3). Data are expressed as mean ± SD and are representative of three independent experiments. ns, no significance; *p < 0.05; **p < 0.01; ***p < 0.001; ****p < 0.0001; by one-way ANOVA with Sidak’s test (a, h, i, n, o) or two-side unpaired t test (e, f, k, l). Source data are provided as a Source Data file.
Fig. 6 C. auris mutants with impaired cell wall mannosylation trigger more potent innate immune activation. a TEM imaging shows the ultrastructural architecture of wild type and pmr1Δ in C. auris cell wall. Mannan fibril length was measured in four randomly selected cells (n = 4). Each cell was measured 10 times in different locations. Scale bar = 100 nm. b, c The monosaccharide composition of the cell wall, as determined by GC-MS (b) and HPLC (c), in C. auris WT or pmr1Δ mutant. d Representative fluorescence micrographs showing the three main polysaccharide layers of wild type and pmr1Δ mutant cell wall. Exponentially growing fungal cells were stained with ConA-FITC to visualize mannan, Fc-Dectin-1 to visualize β-glucan, and calcofluor white (CFW) to visualize chitin. Scale bar, 5 μm. The intensity of fluorescence represents the level of mannan, β-glucan, or chitin (upper) and was quantified by flow cytometry (bottom). Data are representative of three independent and reproducible experiments. e, f BMDMs were infected with C. auris WT or pmr1Δ mutant at an MOI of 1. The phagocytized fungal cells at 1 h post infection (e) or the survived fungal cells at 24 h post infection (f) were harvested, diluted, and plated on YPD agar (n = 3). g BMDMs were infected with indicated strains and cell lysates were subjected to immunoblotting analysis using the indicated p38 MAPK antibodies. h Expression levels of IL-1β, IL-6, TNF-α, CXCL1, and CXCL2, as determined by real-time RT-qPCR, in BMDMs that were infected without (PBS control) or with live C. auris WT or pmr1Δ mutant (MOI = 5) for 3 h (n = 3). Results were normalized to the expression of the control gene GAPDH and are presented relative to those of negative control, set as 1. i Production of IL-1β, IL-6, TNF-α, CXCL1, and CXCL2, as determined by ELISA, in the culture supernatants of BMDMs that were infected without (PBS control) or with live C. auris WT or pmr1Δ mutant (MOI = 5) for 6 h (n = 3). j Representative fluorescence micrographs showing the three main polysaccharide layers of wild type and pmt1Δ mutant cell wall. k, l As in e, f, BMDMs were infected with C. auris WT or pmt1Δ mutant at an MOI of 1. The phagocytized fungal cells at 1 h post-infection (k) or the survived fungal cells at 24 h post infection (l) were determined by CFU counting (n = 3). m–o The same as g–I, except the indicated strains (n = 3). Data are expressed as mean ± SD and are representative of three independent experiments. ns, no significance; *p < 0.05; **p < 0.01; ***p < 0.001; ****p < 0.0001; by one-way ANOVA with Sidak’s test (a, h, i, n, o) or two-side unpaired t test (e, f, k, l). Source data are provided as a Source Data file.CC BY · PubMed Central
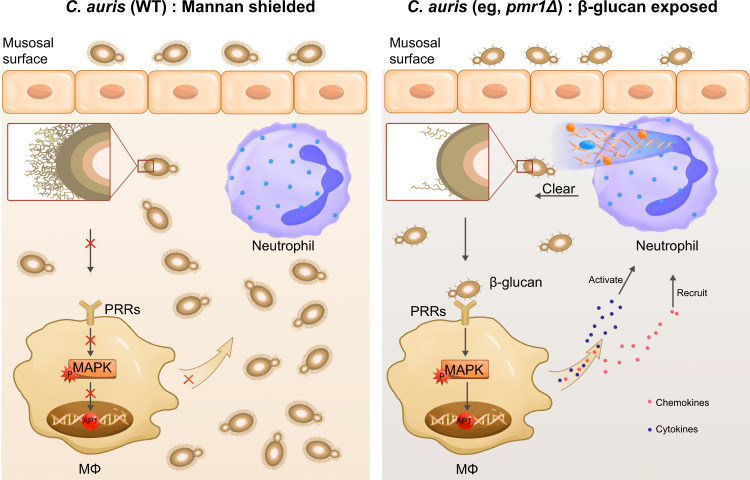
Fig. 7 Proposed model for the role of C. auris outer mannan layer in dampening innate immune responses. C. auris has a structurally distinct mannan layer at the cell wall surface that shields the inner β-glucan, reducing recognition by the receptors of innate immune cells such as macrophages. Reduced macrophage activation leads to successful colonization and proliferation of C. auris by avoiding being cleared by immune cells such as neutrophils. In contrast, the disrupted mannan layer in C. auris leads to exposure to β-glucan, which can be recognized by the surface receptors of macrophages. The host-pathogen interaction results in the activation of MAPK signaling pathway and release of pro-inflammatory cytokines and chemokines, which finally leads to activation and recruitment of neutrophils and triggers the clearance of invading C. auris. Note: Inset represents an enlarged area of the three layers of C. auris cell wall, which is organized in an inner skeletal layer comprising chitin, β-glucan, and an outermost layer dominated by highly glycosylated mannoproteins.
Fig. 7 Proposed model for the role of C. auris outer mannan layer in dampening innate immune responses. C. auris has a structurally distinct mannan layer at the cell wall surface that shields the inner β-glucan, reducing recognition by the receptors of innate immune cells such as macrophages. Reduced macrophage activation leads to successful colonization and proliferation of C. auris by avoiding being cleared by immune cells such as neutrophils. In contrast, the disrupted mannan layer in C. auris leads to exposure to β-glucan, which can be recognized by the surface receptors of macrophages. The host-pathogen interaction results in the activation of MAPK signaling pathway and release of pro-inflammatory cytokines and chemokines, which finally leads to activation and recruitment of neutrophils and triggers the clearance of invading C. auris. Note: Inset represents an enlarged area of the three layers of C. auris cell wall, which is organized in an inner skeletal layer comprising chitin, β-glucan, and an outermost layer dominated by highly glycosylated mannoproteins.CC BY · PubMed Central

Verification

Claims the paper makes

The claims and statistics of this paper haven’t been checked yet.

Run the check — free, no account needed. It reads the open-access text and checks the sources it cites.

A few free checks a day · papers already verified open instantly · results are public

Claims other papers make about this one

Each is checked against this paper’s own text: does it say what the citing paper says it does?

Self-check

Percentages, sums and reported differences re-computed from the paper’s own numbers.

The self-check needs the paper’s full text.

Citations

Cites

Show all 70 references

Cited by

Sorted by citations

Items 101–107 of 107

Metadata

Authors
Wang, Y., Zou, Y., Chen, X., Li, H., Yin, Z., Zhang, B., Xu, Y., Zhang, Y., Zhang, R., Huang, X., Yang, W., Xu, C., Jiang, T., Tang, Q., Zhou, Z., Ji, Y., Liu, Y., Hu, L., Zhou, J., Zhou, Y., Zhao, J., Liu, N., Huang, G., Chang, H., Fang, W., Chen, C., & Zhou, D.
Affiliations
  • Chinese Academy of Sciences (CN)
  • Shanghai Jiao Tong University (CN)
  • Beijing Institute of Microbiology and Epidemiology (CN)
  • Shanghai University of Traditional Chinese Medicine (CN)
  • Jiangnan University (CN)
  • Shanghai University (CN)
  • Tongji University (CN)
  • Gannan Medical University (CN)
  • Guangxi Academy of Sciences (CN)
  • Fudan University (CN)
Corresponding author
  • Chen, Changbin
  • Zhou, Dongsheng
Venue
Nature Communications
Published
2022-06-21
Volume
13
Issue
1
Pages
3553-3553
ISSN
2041-1723 (ISSN-L)
OpenAlex
W4283321860
Cited by
107
References
70
Citations by year
2026: 26 · 2025: 27 · 2024: 32 · 2023: 18 · 2022: 4
FWCI
9.90
Type
journal article
Language
en
Open access
Locations
  • Nature Communications (publishedVersion, cc-by)
  • PubMed Central (publishedVersion, cc-by)
  • PubMed (publishedVersion)
  • RePEc: Research Papers in Economics (submittedVersion)
  • DOAJ (DOAJ: Directory of Open Access Journals) (submittedVersion, cc-by-sa)
Funders
  • Natural Science Foundation of Shanghai (2019SHZDZX02, 20ZR1463800)
  • National Natural Science Foundation of China (31600119, BM2020019, 2020YFA0907200, 2019SHZDZX02, 32070146, 32170195, 31870141)
  • Chinese Academy of Sciences (153831KYSB20170043, KGFZD-135-19-11)
  • Government of Jiangsu Province
  • Youth Innovation Promotion Association of the Chinese Academy of Sciences (31600119)
  • State Key Laboratory of Pathogen and Biosecurity
  • Youth Innovation Promotion Association
  • Institute of Microbiology, Chinese Academy of Sciences
Topics
  • Health Sciences › Medicine › Infectious Diseases › Antifungal resistance and susceptibility
  • Life Sciences › Biochemistry, Genetics and Molecular Biology › Molecular Biology › Fungal and yeast genetics research
  • Health Sciences › Medicine › Infectious Diseases › Fungal Infections and Studies
Keywords
Candida auris, innate immunity, Candida albicans, fungal pathogen-host interaction, immune inflammation, cell wall structure, multidrug resistance, hospital outbreak
MeSH terms
Candida auris, Antifungal Agents, Candida, Candida albicans, Candidiasis, Humans, Immunity, Innate, Microbial Sensitivity Tests

About these checks

Registry, retraction, Cites and statistics results are computed, not judged, with one exception: a printed reference that no index lists is read once by a model before it counts as a citation error. Claims are extracted by a model and kept only when their quote appears verbatim in the text; each cited source is then checked, with a model’s help, for whether it says what the claim relies on. Those verdicts can be wrong — read the claim’s quote and the cited source before relying on one.

Statistics and arithmetic are recomputed, not judged.

Confidence bands are shown only for fields calibrated on our annotated test set. None is calibrated yet, so no band is shown.

What counts as a claim ›How we measure confidence ›How we check this ›

Are you an author, or do you see a problem with this page? Request a review