Student or educator? Sign up with your school email and get 6 months of Pro free.
CoChat

The DOI matches its Crossref record; 47 of the 47 references it cites were found in a registry or an index.

Uncertainty-informed deep learning models enable high-confidence predictions for digital histopathology

Open access

Abstract

A model’s ability to express its own predictive uncertainty is an essential attribute for maintaining clinical user confidence as computational biomarkers are deployed into real-world medical settings. In the domain of cancer digital histopathology, we describe a clinically-oriented approach to uncertainty quantification for whole-slide images, estimating uncertainty using dropout and calculating thresholds on training data to establish cutoffs for low- and high-confidence predictions. We train models to identify lung adenocarcinoma vs. squamous cell carcinoma and show that high-confidence predictions outperform predictions without uncertainty, in both cross-validation and testing on two large external datasets spanning multiple institutions. Our testing strategy closely approximates real-world application, with predictions generated on unsupervised, unannotated slides using predetermined thresholds. Furthermore, we show that uncertainty thresholding remains reliable in the setting of domain shift, with accurate high-confidence predictions of adenocarcinoma vs. squamous cell carcinoma for out-of-distribution, non-lung cancer cohorts.

Overview

The claims and statistics of this paper haven’t been checked yet.

Free: it reads the open-access text and checks the first 5 claims that cite a source we can check. Create a free account to check every claim.

A few free checks a day · papers already verified open instantly · results are public

Integrity signals

Registry

Crossref · 10.1038/s41467-022-34025-x

Cites

47 of 47 references verified0 citation errors · 0 not checkable

Statistics

Figures

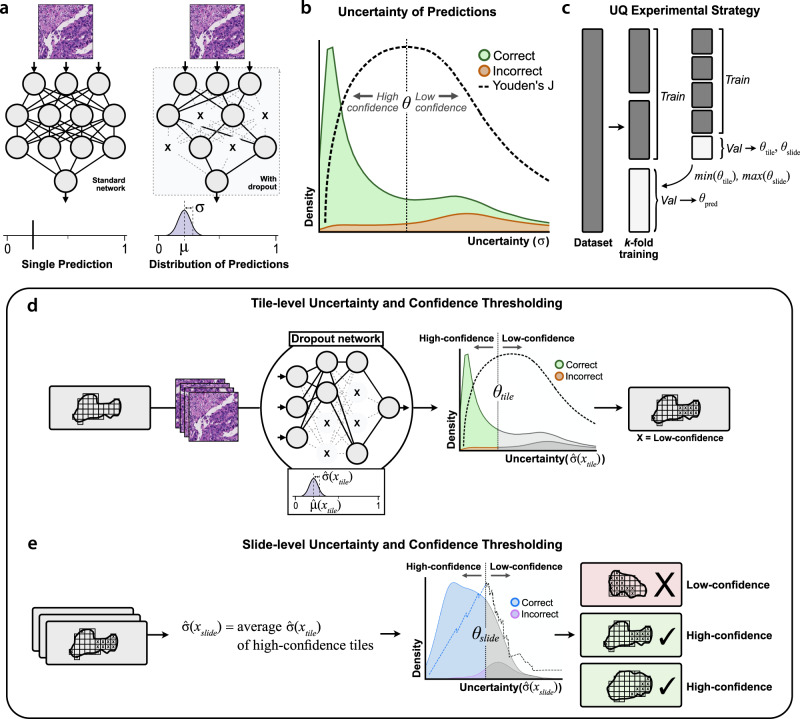
Fig. 1 Estimation of uncertainty and confidence thresholding. a With standard deep learning neural networks, a single image yields a single output prediction. When dropout is enabled during inference, predictions for a single image will vary based on which nodes are randomly dropped out. To estimate tile-level uncertainty, images undergo 30 forward passes through the network, resulting in a distribution of predictions. The mean of this distribution, μ^(xtile), represents the final tile-level prediction, and the standard deviation, σ^(xtile), represents the tile-level uncertainty. b When uncertainty quantification (UQ) methods are used, incorrect predictions are associated with higher uncertainties than correct predictions32–38. From a given distribution of tile- or slide-level uncertainties, we determine the uncertainty threshold θ which optimally separates correct and incorrect predictions by maximizing Youden’s index (J). Predictions with uncertainty below this threshold are high-confidence, and all others are low-confidence. c To prevent data leakage and overfitting, optimal tile- and slide-level uncertainty thresholds are determined through nested cross-validation within training folds. d Schematic for calculating tile-level uncertainty and confidence. The optimal tile-level uncertainty threshold θtile is calculated from a given validation dataset. Tiles from the dataset are separated into high- and low-confidence by whether the tile-level uncertainty falls below or above θtile, respectively. e Schematic for slide-level uncertainty and confidence. Slide-level uncertainty is defined as the average uncertainty among high-confidence tiles for a given slide. The optimal slide-level uncertainty threshold θslide is found and used to classify slides as high- and low-confidence.
Fig. 1 Estimation of uncertainty and confidence thresholding. a With standard deep learning neural networks, a single image yields a single output prediction. When dropout is enabled during inference, predictions for a single image will vary based on which nodes are randomly dropped out. To estimate tile-level uncertainty, images undergo 30 forward passes through the network, resulting in a distribution of predictions. The mean of this distribution, μ^(xtile), represents the final tile-level prediction, and the standard deviation, σ^(xtile), represents the tile-level uncertainty. b When uncertainty quantification (UQ) methods are used, incorrect predictions are associated with higher uncertainties than correct predictions32–38. From a given distribution of tile- or slide-level uncertainties, we determine the uncertainty threshold θ which optimally separates correct and incorrect predictions by maximizing Youden’s index (J). Predictions with uncertainty below this threshold are high-confidence, and all others are low-confidence. c To prevent data leakage and overfitting, optimal tile- and slide-level uncertainty thresholds are determined through nested cross-validation within training folds. d Schematic for calculating tile-level uncertainty and confidence. The optimal tile-level uncertainty threshold θtile is calculated from a given validation dataset. Tiles from the dataset are separated into high- and low-confidence by whether the tile-level uncertainty falls below or above θtile, respectively. e Schematic for slide-level uncertainty and confidence. Slide-level uncertainty is defined as the average uncertainty among high-confidence tiles for a given slide. The optimal slide-level uncertainty threshold θslide is found and used to classify slides as high- and low-confidence.CC BY · PubMed Central
Fig. 2 Uncertainty thresholding yields improved accuracy for high-confidence predictions. a Cross-validation area under receiver operator curve (AUROC) from 276 models trained on The Cancer Genome Atlas (TCGA) to predict lung adenocarcinoma vs. squamous cell carcinoma, using varying amounts of training data. AUROC at the largest dataset size is 0.960 ± 0.008. The regression line shown is a Loess estimate, shown with a 95% confidence interval obtained through bootstrapping with center line representing the mean. b For datasets larger than 100 slides, uncertainty quantification (UQ) was performed to identify low and high-confidence predictions, with the high-confidence predictions shown in comparison to all predictions. AUROCs from high-confidence UQ cohorts are significantly higher than those without UQ for all dataset sizes ≥ 100 slides with α = 0.05. Statistical comparisons were made using one-sided, paired t-tests. The shaded interval represents the AUROC 95% confidence interval at each dataset size, with the center line representing the mean. c Across all cross-validation experiments with UQ, 81.9% of predictions are classified as high-confidence. At each dataset size, the average percent of validation predictions classified as high-confidence is 82.8%, with a median of 84.6% (43.8–100%). The shaded interval represents the 95% confidence interval at each dataset size, with the center line representing the mean. Source data are provided as a Source Data file.
Fig. 2 Uncertainty thresholding yields improved accuracy for high-confidence predictions. a Cross-validation area under receiver operator curve (AUROC) from 276 models trained on The Cancer Genome Atlas (TCGA) to predict lung adenocarcinoma vs. squamous cell carcinoma, using varying amounts of training data. AUROC at the largest dataset size is 0.960 ± 0.008. The regression line shown is a Loess estimate, shown with a 95% confidence interval obtained through bootstrapping with center line representing the mean. b For datasets larger than 100 slides, uncertainty quantification (UQ) was performed to identify low and high-confidence predictions, with the high-confidence predictions shown in comparison to all predictions. AUROCs from high-confidence UQ cohorts are significantly higher than those without UQ for all dataset sizes ≥ 100 slides with α = 0.05. Statistical comparisons were made using one-sided, paired t-tests. The shaded interval represents the AUROC 95% confidence interval at each dataset size, with the center line representing the mean. c Across all cross-validation experiments with UQ, 81.9% of predictions are classified as high-confidence. At each dataset size, the average percent of validation predictions classified as high-confidence is 82.8%, with a median of 84.6% (43.8–100%). The shaded interval represents the 95% confidence interval at each dataset size, with the center line representing the mean. Source data are provided as a Source Data file.CC BY · PubMed Central
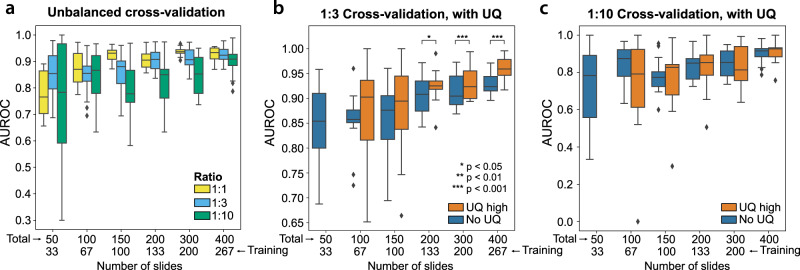
Fig. 3 Uncertainty thresholding for unbalanced data. a Datasets with unbalanced ratios of outcomes yield inferior cross-validation performance compared to balanced datasets at equivalent dataset sizes. Boxplots summarize results from 12 models trained at each dataset size for the 1:1 ratio experiments and 24 models trained at each dataset size for the 1:3 and 1:10 ratio experiments. b Datasets unbalanced at 1:3 ratios also experience improvement from the use of uncertainty quantification (UQ), with area under receiver operator curves (AUROCs) improved in the high-confidence cohorts. For dataset sizes of 200, 300, and 400 slides, p = 0.018, 0.00037, and <0.0001, respectively. Statistical comparisons were made using one-sided, paired t-tests. Boxplots summarize results from 12 models trained at each dataset size. c Datasets unbalanced at 1:10 ratios do not benefit from UQ, with similar performance in high-confidence cohorts compared to all predictions. Boxplots summarize results from 12 models trained at each dataset size. For all boxplots, center line represents the median (50th percentile), lower and upper box bounds represent interquartile range (25th–75th percentile), and minimum (lower whisker) and maximum (upper whisker) bounds extend to furthest datapoint up to 1.5 times the interquartile range, with outliers shown as diamonds. Source data are provided as a Source Data file.
Fig. 3 Uncertainty thresholding for unbalanced data. a Datasets with unbalanced ratios of outcomes yield inferior cross-validation performance compared to balanced datasets at equivalent dataset sizes. Boxplots summarize results from 12 models trained at each dataset size for the 1:1 ratio experiments and 24 models trained at each dataset size for the 1:3 and 1:10 ratio experiments. b Datasets unbalanced at 1:3 ratios also experience improvement from the use of uncertainty quantification (UQ), with area under receiver operator curves (AUROCs) improved in the high-confidence cohorts. For dataset sizes of 200, 300, and 400 slides, p = 0.018, 0.00037, and <0.0001, respectively. Statistical comparisons were made using one-sided, paired t-tests. Boxplots summarize results from 12 models trained at each dataset size. c Datasets unbalanced at 1:10 ratios do not benefit from UQ, with similar performance in high-confidence cohorts compared to all predictions. Boxplots summarize results from 12 models trained at each dataset size. For all boxplots, center line represents the median (50th percentile), lower and upper box bounds represent interquartile range (25th–75th percentile), and minimum (lower whisker) and maximum (upper whisker) bounds extend to furthest datapoint up to 1.5 times the interquartile range, with outliers shown as diamonds. Source data are provided as a Source Data file.CC BY · PubMed Central
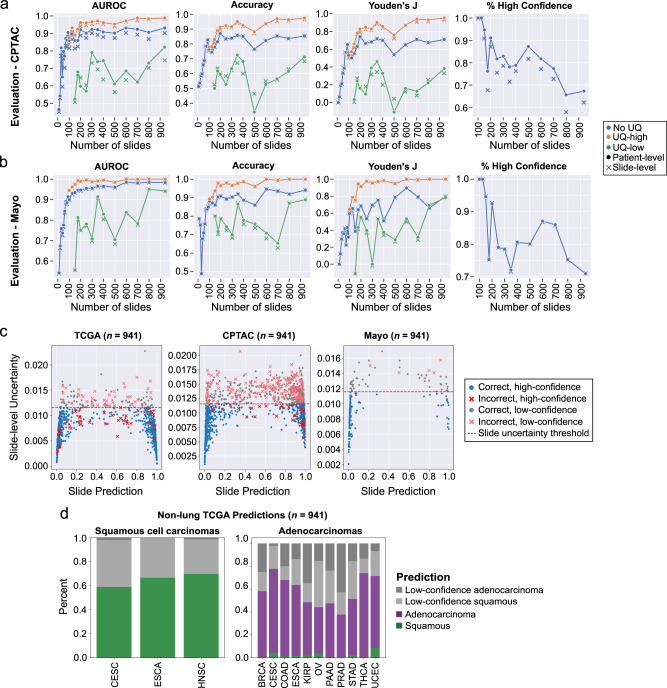
Fig. 4 Uncertainty thresholding improves predictions on external datasets and in the setting of domain shift. a Models trained on The Cancer Genome Atlas (TCGA) at varying dataset sizes were validated on lung adenocarcinomas and squamous cell carcinomas from the Clinical Proteomic Tumor Analysis Consortium (CPTAC). Patient-level metrics are shown with the dotted lines, and slide-level metrics are shown with Xs. Area under receiver operator curve (AUROC), accuracy, and Youden’s J are all improved in the high-confidence uncertainty quantification (UQ) cohorts. The proportion of patients and slides reported as high-confidence is shown in the last panel. b Evaluation results on an institutional dataset of 150 adenocarcinomas and 40 squamous cell carcinomas. Overall performance is higher than on CPTAC, but the same pattern of superior performance in the high-confidence UQ cohorts remains. Fewer slides were excluded as low-confidence in this dataset. c The relationship between slide-level uncertainty and slide prediction is shown for the aggregated TCGA cross-validation results, CPTAC predictions, and Mayo predictions for the experiment trained on the full TCGA dataset (number of slides = 941). Predictions near 0 are consistent with adenocarcinoma, and predictions near 1 are consistent with squamous cell carcinoma. The red dotted line indicates the slide-level uncertainty threshold. d For this same model, predictions were then generated for 700 domain-shifted, non-lung squamous cell cancers and 2456 non-lung adenocarcinomas, with both high-confidence and low-confidence predictions shown. Predictions from bladder (BLCA) and liver (LIHC) cohorts are not shown due to low sample sizes (n < 2). With uncertainty thresholding, classification accuracy in high confidence cohorts for non-lung squamous cell cancers and non-lung adenocarcinomas is 99.8 and 95.2%, respectively. Source data are provided as a Source Data file.
Fig. 4 Uncertainty thresholding improves predictions on external datasets and in the setting of domain shift. a Models trained on The Cancer Genome Atlas (TCGA) at varying dataset sizes were validated on lung adenocarcinomas and squamous cell carcinomas from the Clinical Proteomic Tumor Analysis Consortium (CPTAC). Patient-level metrics are shown with the dotted lines, and slide-level metrics are shown with Xs. Area under receiver operator curve (AUROC), accuracy, and Youden’s J are all improved in the high-confidence uncertainty quantification (UQ) cohorts. The proportion of patients and slides reported as high-confidence is shown in the last panel. b Evaluation results on an institutional dataset of 150 adenocarcinomas and 40 squamous cell carcinomas. Overall performance is higher than on CPTAC, but the same pattern of superior performance in the high-confidence UQ cohorts remains. Fewer slides were excluded as low-confidence in this dataset. c The relationship between slide-level uncertainty and slide prediction is shown for the aggregated TCGA cross-validation results, CPTAC predictions, and Mayo predictions for the experiment trained on the full TCGA dataset (number of slides = 941). Predictions near 0 are consistent with adenocarcinoma, and predictions near 1 are consistent with squamous cell carcinoma. The red dotted line indicates the slide-level uncertainty threshold. d For this same model, predictions were then generated for 700 domain-shifted, non-lung squamous cell cancers and 2456 non-lung adenocarcinomas, with both high-confidence and low-confidence predictions shown. Predictions from bladder (BLCA) and liver (LIHC) cohorts are not shown due to low sample sizes (n < 2). With uncertainty thresholding, classification accuracy in high confidence cohorts for non-lung squamous cell cancers and non-lung adenocarcinomas is 99.8 and 95.2%, respectively. Source data are provided as a Source Data file.CC BY · PubMed Central
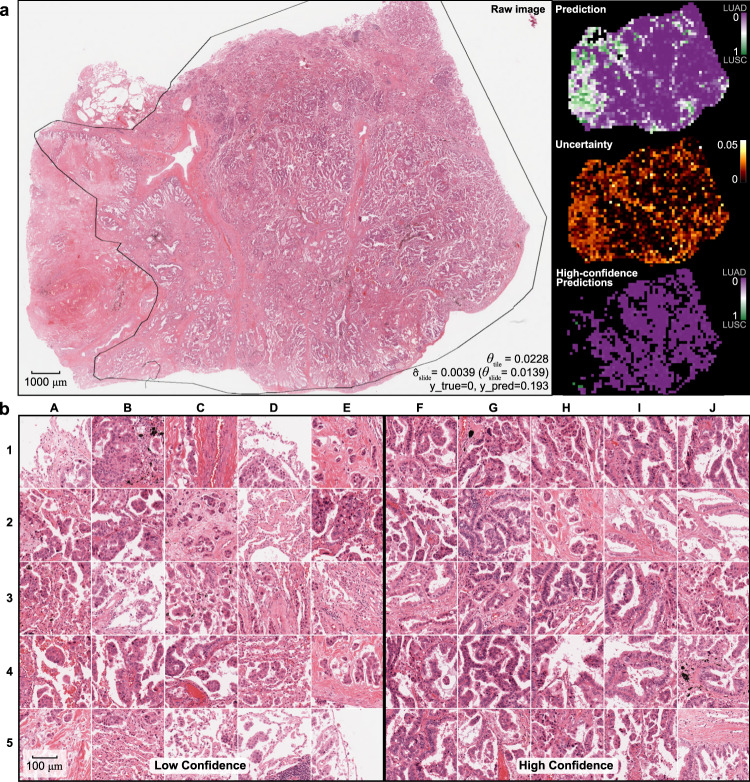
Fig. 5 Visualization of uncertainty and confidence in a validation slide. a One representative adenocarcinoma from the CPTAC evaluation dataset is shown, outlined with a pathologist-annotated ROI for reference only. Predictions were generated for all tiles from this whole-slide image excluding only background whitespace. Tile-level predictions from a model trained on the full TCGA dataset is shown in the top-right, with purple indicating prediction near 0 (consistent with the correct diagnosis of adenocarcinoma), and green indicating predictions near 1 (squamous cell carcinoma). Tile-level uncertainty is shown in the middle-right panel. The bottom right shows only high-confidence tile-level predictions using the predetermined uncertainty threshold, demonstrating that virtually all high-confidence predictions are consistent with the correct diagnosis. b Twenty-five of the lowest confidence tiles are shown on the left, and the 25 highest confidence tiles are shown on the right. All high-confidence tiles show clear adenocarcinoma morphology. Glandular structures are dominant among these tiles, although tiles I2 and J2 appear lepidic in nature, and H3 shows micropapillary morphology. In contrast, the majority of low-confidence tiles lack clear glandular structures. Lepidic morphology is seen in B4, C4, D5, and E5, and micropapillary structures can be found in E1, C2, B3, C4, D4, and E4. All image tiles have a width of 302 μm.
Fig. 5 Visualization of uncertainty and confidence in a validation slide. a One representative adenocarcinoma from the CPTAC evaluation dataset is shown, outlined with a pathologist-annotated ROI for reference only. Predictions were generated for all tiles from this whole-slide image excluding only background whitespace. Tile-level predictions from a model trained on the full TCGA dataset is shown in the top-right, with purple indicating prediction near 0 (consistent with the correct diagnosis of adenocarcinoma), and green indicating predictions near 1 (squamous cell carcinoma). Tile-level uncertainty is shown in the middle-right panel. The bottom right shows only high-confidence tile-level predictions using the predetermined uncertainty threshold, demonstrating that virtually all high-confidence predictions are consistent with the correct diagnosis. b Twenty-five of the lowest confidence tiles are shown on the left, and the 25 highest confidence tiles are shown on the right. All high-confidence tiles show clear adenocarcinoma morphology. Glandular structures are dominant among these tiles, although tiles I2 and J2 appear lepidic in nature, and H3 shows micropapillary morphology. In contrast, the majority of low-confidence tiles lack clear glandular structures. Lepidic morphology is seen in B4, C4, D5, and E5, and micropapillary structures can be found in E1, C2, B3, C4, D4, and E4. All image tiles have a width of 302 μm.CC BY · PubMed Central
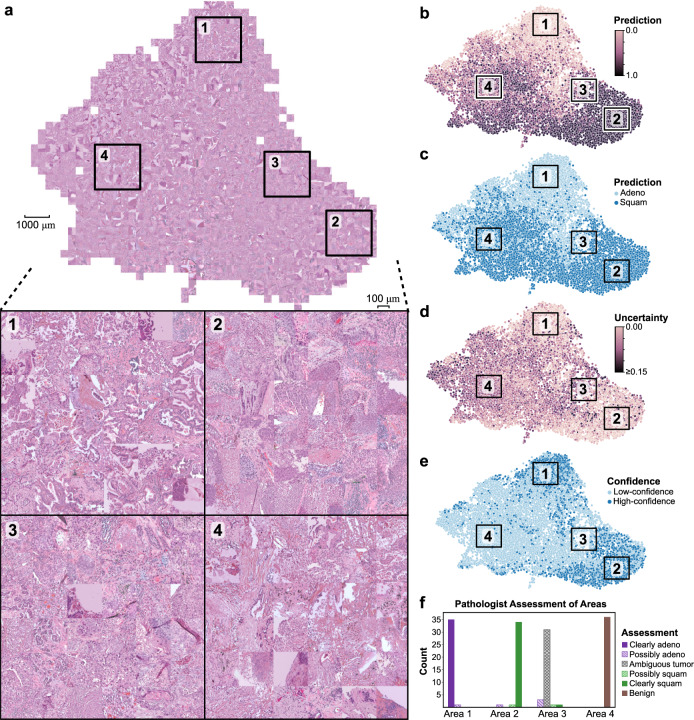
Fig. 6 Activation maps of external predictions highlighting areas of uncertainty. a Penultimate hidden layer activations were calculated for image tiles in the CPTAC dataset and plotted with UMAP. Corresponding images for tiles were then overlaid in a grid-wise fashion to create the shown mosaic map. Four areas of interest are highlighted for magnified display, each with a total of 36 image tiles: (1) high-confidence adenocarcinoma predictions, (2) high-confidence squamous cell predictions, (3) low-confidence images at the boundary between the high-confidence adenocarcinoma and squamous cell predictions, and (4) low-confidence images far away from the high-confidence class boundary. b Tile-level predictions are shown overlaid on the UMAP, scaled from 0 (adenocarcinoma) to 1 (squamous cell). c Discretized tile-level class predictions. d Tile-level uncertainty. e Tile-level confidence, where high-confidence image tiles are defined as having uncertainty below θtile. f Two pathologists reviewed the 144 images shown in Areas 1–4, and pathologic assessment of these images is summarized in the shown bar chart. All image tiles have a width of 302 μm. Source data are provided as a Source Data file.
Fig. 6 Activation maps of external predictions highlighting areas of uncertainty. a Penultimate hidden layer activations were calculated for image tiles in the CPTAC dataset and plotted with UMAP. Corresponding images for tiles were then overlaid in a grid-wise fashion to create the shown mosaic map. Four areas of interest are highlighted for magnified display, each with a total of 36 image tiles: (1) high-confidence adenocarcinoma predictions, (2) high-confidence squamous cell predictions, (3) low-confidence images at the boundary between the high-confidence adenocarcinoma and squamous cell predictions, and (4) low-confidence images far away from the high-confidence class boundary. b Tile-level predictions are shown overlaid on the UMAP, scaled from 0 (adenocarcinoma) to 1 (squamous cell). c Discretized tile-level class predictions. d Tile-level uncertainty. e Tile-level confidence, where high-confidence image tiles are defined as having uncertainty below θtile. f Two pathologists reviewed the 144 images shown in Areas 1–4, and pathologic assessment of these images is summarized in the shown bar chart. All image tiles have a width of 302 μm. Source data are provided as a Source Data file.CC BY · PubMed Central
Fig. 7 Uncertainty thresholding in a synthetic test using GAN-generated images. a A class-conditional generative adversarial network (GAN) was trained on TCGA to generate adenocarcinoma (LUAD) or squamous cell carcinoma (LUSC) synthetic images. Using embedding interpolation, intermediate neutral images are also generated to approximate images near the decision boundary. Example synthetic images are shown here using the LUAD, LUSC, and Intermediate class labels. b Using a model trained on the full TCGA dataset, predictions were calculated for 1000 LUAD, LUSC, and Intermediate GAN images. Synthetic LUAD and LUSC images were predicted accurately, and Intermediate synthetic images showed an even spread of predictions. c Models were trained with the addition of varying amounts of GAN-Intermediate slides with randomly assigned labels. Cross-validation slide-level area under receiver operator curve (AUROC) is shown. Performance degrades with increasing proportion of GAN-Intermediate slides. The shaded intervals represent the AUROC 95% confidence interval at each dataset size. d Cross-validation slide-level AUROC is shown from models trained with a dataset size of 500 slides plus varying amounts of GAN-Intermediate slides. Performance degrades as increasing number of uninformative GAN-Intermediate slides are added, but performance in the high-confidence uncertainty quantification (UQ) cohorts remains high despite large numbers of uninformative slides. For the +0%, +10%, +20%, +30%, +40%, and +50% GAN experiments, p values comparing high-confidence AUROC to AUROC without UQ are 0.00032, 0.00014, 0.0034, <0.0001, 0.00068, and 0.00090, respectively. Statistical comparisons were made with one-sided, paired t-tests. e Distribution of low- and high-confidence predictions in the experiments shown in d. Virtually none of the GAN-Intermediate slides are classified as high-confidence in these experiments. For all boxplots, center line represents the median (50th percentile), lower and upper box bounds represent interquartile range (25th–75th percentile), and minimum (lower whisker) and maximum (upper whisker) bounds extend to furthest datapoint up to 1.5 times the interquartile range, with outliers shown as diamonds. Source data are provided as a Source Data file.
Fig. 7 Uncertainty thresholding in a synthetic test using GAN-generated images. a A class-conditional generative adversarial network (GAN) was trained on TCGA to generate adenocarcinoma (LUAD) or squamous cell carcinoma (LUSC) synthetic images. Using embedding interpolation, intermediate neutral images are also generated to approximate images near the decision boundary. Example synthetic images are shown here using the LUAD, LUSC, and Intermediate class labels. b Using a model trained on the full TCGA dataset, predictions were calculated for 1000 LUAD, LUSC, and Intermediate GAN images. Synthetic LUAD and LUSC images were predicted accurately, and Intermediate synthetic images showed an even spread of predictions. c Models were trained with the addition of varying amounts of GAN-Intermediate slides with randomly assigned labels. Cross-validation slide-level area under receiver operator curve (AUROC) is shown. Performance degrades with increasing proportion of GAN-Intermediate slides. The shaded intervals represent the AUROC 95% confidence interval at each dataset size. d Cross-validation slide-level AUROC is shown from models trained with a dataset size of 500 slides plus varying amounts of GAN-Intermediate slides. Performance degrades as increasing number of uninformative GAN-Intermediate slides are added, but performance in the high-confidence uncertainty quantification (UQ) cohorts remains high despite large numbers of uninformative slides. For the +0%, +10%, +20%, +30%, +40%, and +50% GAN experiments, p values comparing high-confidence AUROC to AUROC without UQ are 0.00032, 0.00014, 0.0034, <0.0001, 0.00068, and 0.00090, respectively. Statistical comparisons were made with one-sided, paired t-tests. e Distribution of low- and high-confidence predictions in the experiments shown in d. Virtually none of the GAN-Intermediate slides are classified as high-confidence in these experiments. For all boxplots, center line represents the median (50th percentile), lower and upper box bounds represent interquartile range (25th–75th percentile), and minimum (lower whisker) and maximum (upper whisker) bounds extend to furthest datapoint up to 1.5 times the interquartile range, with outliers shown as diamonds. Source data are provided as a Source Data file.CC BY · PubMed Central

Verification

Claims the paper makes

The claims and statistics of this paper haven’t been checked yet.

Free: it reads the open-access text and checks the first 5 claims that cite a source we can check. Create a free account to check every claim.

A few free checks a day · papers already verified open instantly · results are public

Claims other papers make about this one

Each is checked against this paper’s own text: does it say what the citing paper says it does?

Self-check

Percentages, sums and reported differences re-computed from the paper’s own numbers.

The self-check needs the paper’s full text.

Citations

Cites

Show all 47 references

Research works printed but not linked: 8

  1. Ghosal, S., Xie, A. & Shah, P. Uncertainty quantified deep learning for predicting dice coefficient of digital histopathology image segmentation. Preprint at https://arxiv.org/abs/2109.00115 (2021). · arXiv
  2. Gal, Y. & Ghahramani, Z. Dropout as a Bayesian approximation: Representing model uncertainty in deep learning. Proc. 33rd Int. Conf. Mach. Learn. 48, 1050–1059 (2016).
  3. Sida, W. & Christopher, M. Fast dropout training. Proc. 30th Int. Conf. Mach. Learn. 28, 118–126 (2013).
  4. Lakshminarayanan, B., Pritzel, A. & Blundell, C. Simple and scalable predictive uncertainty estimation using deep ensembles. Adv. Neural Inf. Process. Syst. 30, 6405–6416 (2017).
  5. Wenzel, F., Snoek, J., Tran, D. & Jenatton, R. Hyperparameter ensembles for robustness and uncertainty quantification. Adv. Neural Inf. Process. Syst. 33, 6514–6527 (2020).
  6. Bickel, S., Brückner, M. & Scheffer, T. Discriminative learning under covariate shift. J. Mach. Learn. Res. 10, 2137–2155 (2009).
  7. Tripuraneni, N., Adlam, B. & Pennington, J. Overparameterization improves robustness to covariate shift in high dimensions. Adv. Neural Inf. Process. Syst. 34, 13883–13897 (2021).
  8. Linmans, J., Laak, J. V. D. & Litjens, G. Efficient out-of-distribution detection in digital pathology using multi-head convolutional neural networks. Proc. Third Conf. Med. Imaging Deep Learn. 121, 465–478 (2020).

Cited by

See all 147

Metadata

Authors
Dolezal, J. M., Srisuwananukorn, A., Karpeyev, D., Ramesh, S., Kochanny, S., Cody, B., Mansfield, A. S., Rakshit, S., Bansal, R., Bois, M. C., Bungum, A. O., Schulte, J. J., Vokes, E. E., Garassino, M. C., Husain, A. N., & Pearson, A. T.
Affiliations
  • University of Chicago Medical Center (US)
  • Tisch Cancer Institute (US)
  • University of Chicago (US)
  • Mayo Clinic (US)
  • University of Wisconsin–Madison (US)
Corresponding author
Pearson, Alexander T.
Venue
Nature Communications
Published
2022-11-02
Volume
13
Issue
1
Pages
6572-6572
ISSN
2041-1723 (ISSN-L)
OpenAlex
W4308149258
Cited by
147
References
47
Citations by year
2026: 42 · 2025: 40 · 2024: 41 · 2023: 23 · 2022: 1
FWCI
8.64
Type
journal article
Language
en
Open access
Licence
Locations
  • Nature Communications (publishedVersion, cc-by)
  • PubMed Central (publishedVersion, cc-by)
  • PubMed (publishedVersion)
  • arXiv (Cornell University) (submittedVersion)
  • RePEc: Research Papers in Economics (submittedVersion)
  • DOAJ (DOAJ: Directory of Open Access Journals) (submittedVersion, cc-by-sa)
  • arXiv (Cornell University)
Funders
  • U.S. Department of Health & Human Services | NIH | National Cancer Institute (U01-CA243075)
  • U.S. Department of Health & Human Services | NIH | National Institute of Dental and Craniofacial Research (R56-DE030958)
  • Cancer Research Foundation
  • EIF | Stand Up To Cancer
  • EC | Horizon 2020 Framework Programme (2021-SC1-BHC I3LUNG)
Topics
  • Physical Sciences › Computer Science › Artificial Intelligence › AI in cancer detection
  • Health Sciences › Medicine › Radiology, Nuclear Medicine and Imaging › Radiomics and Machine Learning in Medical Imaging
  • Health Sciences › Medicine › Health Informatics › Artificial Intelligence in Healthcare and Education
Keywords
uncertainty quantification, confidence threshold, digital histopathology, whole slide images, lung adenocarcinoma, squamous cell carcinoma, cancer classification, domain shift, out-of-distribution prediction
MeSH terms
Deep Learning, Adenocarcinoma, Carcinoma, Squamous Cell, Humans, Uncertainty

About these checks

Registry, retraction, Cites and statistics results are computed, not judged, with one exception: a printed reference that no index lists is read once by a model before it counts as a citation error. Claims are extracted by a model and kept only when their quote appears verbatim in the text; each cited source is then checked, with a model’s help, for whether it says what the claim relies on. Those verdicts can be wrong — read the claim’s quote and the cited source before relying on one.

Statistics and arithmetic are recomputed, not judged.

Confidence bands are shown only for fields calibrated on our annotated test set. None is calibrated yet, so no band is shown.

What counts as a claim ›How we measure confidence ›How we check this ›

Are you an author, or do you see a problem with this page? Request a review

How to cite

Cite CoChat for the checks on this page, and the paper for its own findings.

This page
CoChat. (2026). Citation check: Uncertainty-informed deep learning models enable high-confidence predictions for digital histopathology. https://app.cochat.ai/papers/10.1038/s41467-022-34025-x
The paper
Dolezal, J. M., Srisuwananukorn, A., Karpeyev, D., Ramesh, S., Kochanny, S., Cody, B., Mansfield, A. S., Rakshit, S., Bansal, R., Bois, M. C., Bungum, A. O., Schulte, J. J., Vokes, E. E., Garassino, M. C., Husain, A. N., & Pearson, A. T. (2022). Uncertainty-informed deep learning models enable high-confidence predictions for digital histopathology. Nature Communications. https://doi.org/10.1038/s41467-022-34025-x

Data sources

Bibliographic data: Semantic Scholar, OpenAlex, Crossref.

Contains information from the Semantic Scholar Academic Graph Datasets, made available under the ODC Attribution License (ODC-BY 1.0).

Semantic Scholar’s data is described in: Kinney, R., et al. (2023). The Semantic Scholar Open Data Platform. arXiv:2301.10140.