

The DOI matches its Crossref record; 5 of the 5 references it cites were found in a registry or an index.
High-throughput robust single-cell DNA methylation profiling with sciMETv2
Abstract
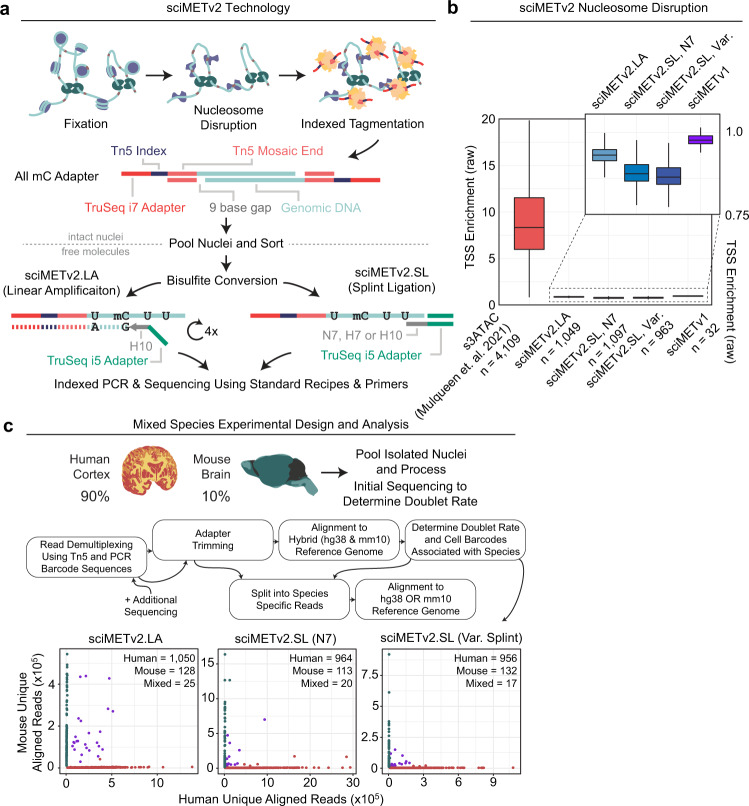
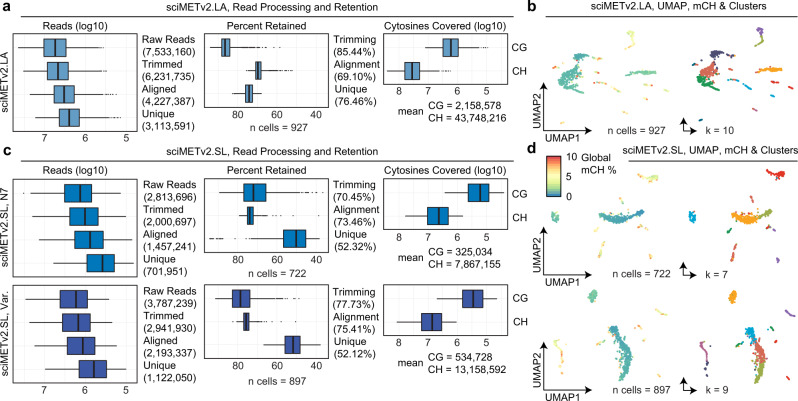
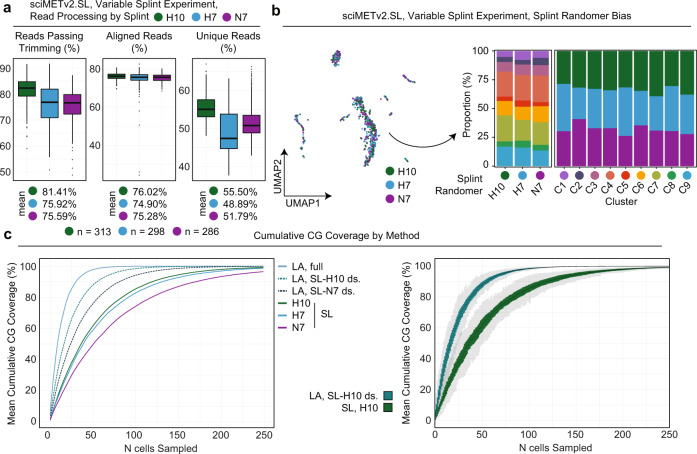
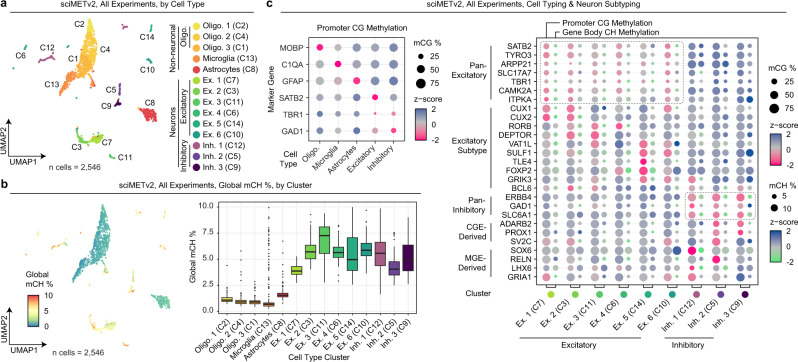
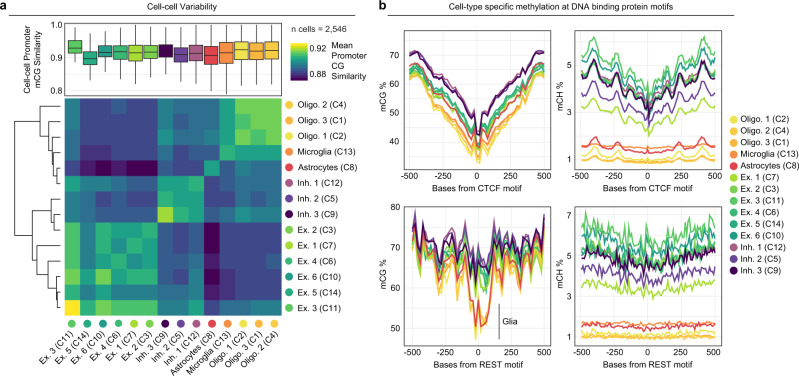
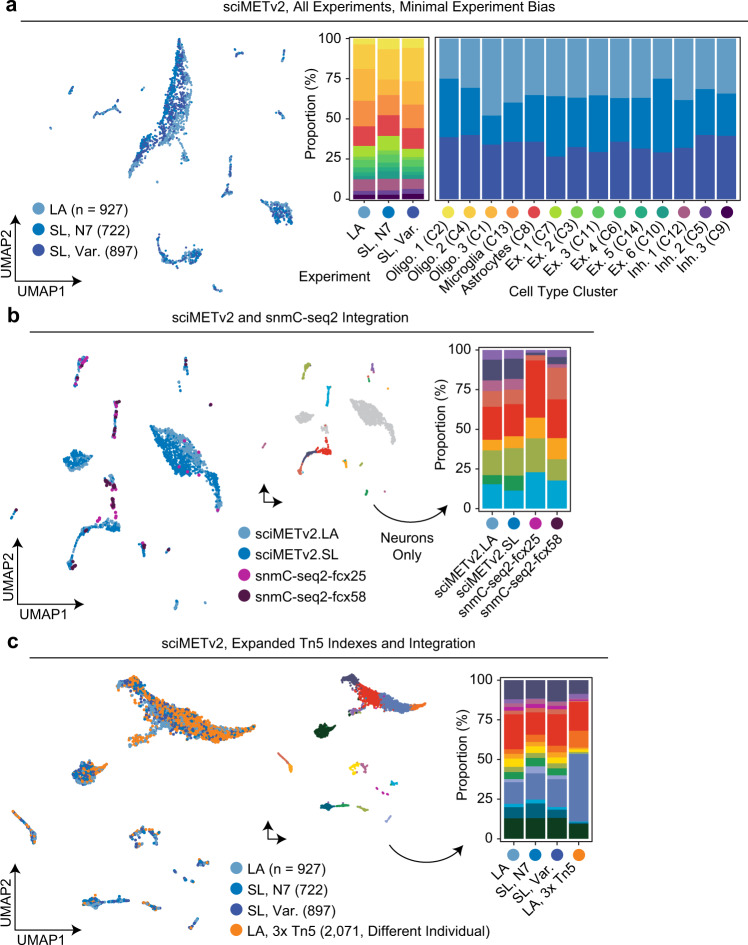
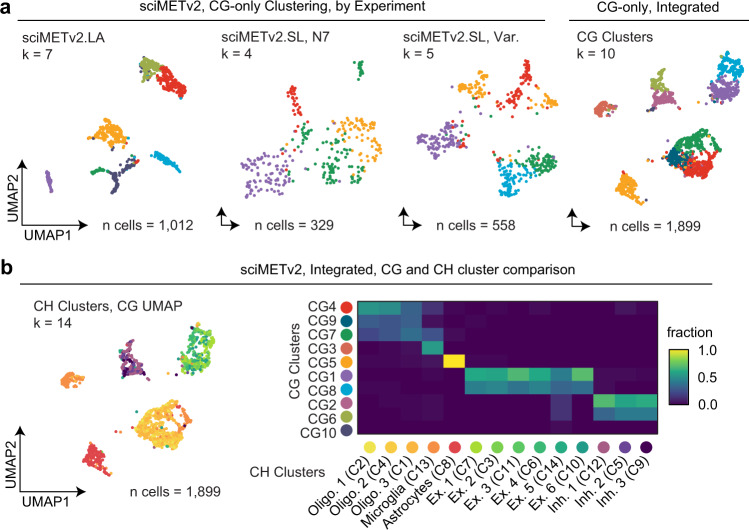
DNA methylation is a key epigenetic property that drives gene regulatory programs in development and disease. Current single-cell methods that produce high quality methylomes are expensive and low throughput without the aid of extensive automation. We previously described a proof-of-principle technique that enabled high cell throughput; however, it produced only low-coverage profiles and was a difficult protocol that required custom sequencing primers and recipes and frequently produced libraries with excessive adapter contamination. Here, we describe a greatly improved version that generates high-coverage profiles (~15-fold increase) using a robust protocol that does not require custom sequencing capabilities, includes multiple stopping points, and exhibits minimal adapter contamination. We demonstrate two versions of sciMETv2 on primary human cortex, a high coverage and rapid version, identifying distinct cell types using CH methylation patterns. These datasets are able to be directly integrated with one another as well as with existing snmC-seq2 datasets with little discernible bias. Finally, we demonstrate the ability to determine cell types using CG methylation alone, which is the dominant context for DNA methylation in most cell types other than neurons and the most applicable analysis outside of brain tissue.
Overview
The claims and statistics of this paper haven’t been checked yet.
Run the check — free, no account needed. It reads the open-access text and checks the sources it cites.
Integrity signals
Registry
Cites
Statistics
Figures
Verification
Claims the paper makes
The claims and statistics of this paper haven’t been checked yet.
Run the check — free, no account needed. It reads the open-access text and checks the sources it cites.
Claims other papers make about this one
Each is checked against this paper’s own text: does it say what the citing paper says it does?
In the citing paper
“Furthermore, current single-cell DNA methylation methods23,24 suffer from data sparsity, which makes it challenging to exploit the stochasticity of epimutations at individual CpGs.”
From Clonal tracing with somatic epimutations reveals dynamics of blood ageing (2025) · cites this paper as [24]
Self-check
Percentages, sums and reported differences re-computed from the paper’s own numbers.
The self-check needs the paper’s full text.
Citations
Cites
Single-cell methylomes identify neuronal subtypes and regulatory elements in mammalian cortex
Luo, C., Keown, C. L., Kurihara, L., Zhou, J., He, Y., Li, J., Castanon, R., Lucero, J., Nery, J. R., Sandoval, J. P., et al. (2017) · Science · doi:10.1126/science.aan3351 · Cited by 545
Sequencing thousands of single-cell genomes with combinatorial indexing
Vitak, S. A., Torkenczy, K. A., Rosenkrantz, J. L., Fields, A. J., Christiansen, L., Wong, M. H., Carbone, L., Steemers, F. J., & Adey, A. (2017) · Nature Methods · doi:10.1038/nmeth.4154 · Cited by 294
Self-citationDNA methylation atlas of the mouse brain at single-cell resolution
Liu, H., Zhou, J., Tian, W., Luo, C., Bartlett, A., Aldridge, A., Lucero, J., Osteen, J. K., Nery, J. R., Chen, H., et al. (2021) · Nature · doi:10.1038/s41586-020-03182-8 · Cited by 289
Highly scalable generation of DNA methylation profiles in single cells
Mulqueen, R. M., Pokholok, D., Norberg, S. J., Torkenczy, K. A., Fields, A. J., Sun, D., Sinnamon, J. R., Shendure, J., Trapnell, C., O'Roak, B. J., et al. (2018) · Nature Biotechnology · doi:10.1038/nbt.4112 · Cited by 289
Self-citationRobust single-cell DNA methylome profiling with snmC-seq2
Luo, C., Rivkin, A., Zhou, J., Sandoval, J. P., Kurihara, L., Lucero, J., Castanon, R., Nery, J. R., Pinto-Duarte, A., Bui, B., et al. (2018) · Nature Communications · doi:10.1038/s41467-018-06355-2 · Cited by 189
Research works printed but not linked: 19
- Smallwood, S. A. et al. Single-cell genome-wide bisulfite sequencing for assessing epigenetic heterogeneity. Nat. Methods 11, 817–820 (2014). · DOI · Paper page
- Farlik, M. et al. Single-cell DNA methylome sequencing and bioinformatic inference of epigenomic cell-state dynamics. Cell Rep. 10, 1386–1397 (2015). · DOI · Paper page
- Hui, T. et al. High-resolution single-cell DNA methylation measurements reveal epigenetically distinct hematopoietic stem cell subpopulations. Stem Cell Rep. 11, 578–592 (2018). · DOI · Paper page
- Raine, A. et al. scSPLAT, a scalable plate-based protocol for single cell WGBS library preparation. Sci. Rep. 12, 5772 (2022). · DOI
- Kobayashi, H. et al. Repetitive DNA methylome analysis by small-scale and single-cell shotgun bisulfite sequencing. Genes Cells 21, 1209–1222 (2016). · DOI
- Miura, F., Enomoto, Y., Dairiki, R. & Ito, T. Amplification-free whole-genome bisulfite sequencing by post-bisulfite adaptor tagging. Nucleic Acids Res. 40, e136 (2012). · DOI
- Mulqueen, R. M. et al. High-content single-cell combinatorial indexing. Nat. Biotechnol. https://doi.org/10.1038/s41587-021-00962-z (2021). · DOI
- Kapp, J. D., Green, R. E. & Shapiro, B. A fast and efficient single-stranded genomic library preparation method optimized for ancient DNA. J. Hered. 112, 241–249 (2021). · DOI
- Dixon, J. R. et al. Topological domains in mammalian genomes identified by analysis of chromatin interactions. Nature 485, 376–380 (2012). · DOI · Paper page
- Chong, J. A. et al. REST: A mammalian silencer protein that restricts sodium channel gene expression to neurons. Cell 80, 949–957 (1995). · DOI · Paper page
- Lister, R. et al. Human DNA methylomes at base resolution show widespread epigenomic differences. Nature 462, 315–322 (2009). · DOI · Paper page
- Thornton, C. A. et al. Spatially mapped single-cell chromatin accessibility. Nat. Commun. 12, 1274 (2021). · DOI
- Bolger, A. M., Lohse, M. & Usadel, B. Trimmomatic: a flexible trimmer for Illumina sequence data. Bioinformatics 30, 2114 (2014). · DOI · Paper page
- Krueger, F. & Andrews, S. R. Bismark: A flexible aligner and methylation caller for Bisulfite-Seq applications. Bioinformatics 27, 1571–1572 (2011). · DOI
- Sinnamon, J. R. et al. The accessible chromatin landscape of the murine hippocampus at single-cell resolution. Genome Res 29, 857–869 (2019). · DOI
- Martin, M. Cutadapt removes adapter sequences from high-throughput sequencing reads. EMBnet. J. 17, 10–12 (2011). · DOI · Paper page
- Levine, J. H. et al. Data-driven phenotypic dissection of AML reveals progenitor-like cells that correlate with prognosis. Cell 162, 184–197 (2015). · DOI · Paper page
- Becht, E. et al. Dimensionality reduction for visualizing single-cell data using UMAP. Nat. Biotechnol. 37, 38–44 (2018). · DOI · Paper page
- Heinz, S. et al. Simple combinations of lineage-determining transcription factors prime cis-regulatory elements required for macrophage and B cell identities. Mol. Cell 38, 576–589 (2010). · DOI · Paper page
Cited by
Clonal tracing with somatic epimutations reveals dynamics of blood ageing
Scherer, M., Singh, I., Braun, M. M., Szu-Tu, C., Sanchez Sanchez, P., Lindenhofer, D., Jakobsen, N. A., Körber, V., Kardorff, M., Nitsch, L., et al. (2025) · Nature · doi:10.1038/s41586-025-09041-8 · Cited by 89
Metadata
- Authors
- Nichols, R. V., O’Connell, B. L., Mulqueen, R. M., Thomas, J., Woodfin, A. R., Acharya, S., Mandel, G., Pokholok, D., Steemers, F. J., & Adey, A. C.
- Venue
- Nature Communications
- Published
- 2022-12-09
- Volume
- 13
- Issue
- 1
- ISSN
- 2041-1723
- PMC
- PMC9734657
- Cited by
- 70
- References
- 5
- Language
- en
- Funders
- U.S. Department of Health & Human Services | NIH | National Institute of Mental Health (RF1MH128842)
- U.S. Department of Health & Human Services | NIH | National Institute of General Medical Sciences (R35GM124704)
About these checks
Registry, retraction, Cites and statistics results are computed, not judged, with one exception: a printed reference that no index lists is read once by a model before it counts as a citation error. Claims are extracted by a model and kept only when their quote appears verbatim in the text; each cited source is then checked, with a model’s help, for whether it says what the claim relies on. Those verdicts can be wrong — read the claim’s quote and the cited source before relying on one.
Statistics and arithmetic are recomputed, not judged.
Confidence bands are shown only for fields calibrated on our annotated test set. None is calibrated yet, so no band is shown.
What counts as a claim ›How we measure confidence ›How we check this ›
Are you an author, or do you see a problem with this page? Request a review
