

The DOI matches its Crossref record; 94 of the 94 references it cites were found in a registry or an index.
An open label, non-randomized study assessing a prebiotic fiber intervention in a small cohort of Parkinson’s disease participants
Open accessAbstract
A pro-inflammatory intestinal microbiome is characteristic of Parkinson’s disease (PD). Prebiotic fibers change the microbiome and this study sought to understand the utility of prebiotic fibers for use in PD patients. The first experiments demonstrate that fermentation of PD patient stool with prebiotic fibers increased the production of beneficial metabolites (short chain fatty acids, SCFA) and changed the microbiota demonstrating the capacity of PD microbiota to respond favorably to prebiotics. Subsequently, an open-label, non-randomized study was conducted in newly diagnosed, non-medicated ( n = 10) and treated PD participants ( n = 10) wherein the impact of 10 days of prebiotic intervention was evaluated. Outcomes demonstrate that the prebiotic intervention was well tolerated (primary outcome) and safe (secondary outcome) in PD participants and was associated with beneficial biological changes in the microbiota, SCFA, inflammation, and neurofilament light chain. Exploratory analyses indicate effects on clinically relevant outcomes. This proof-of-concept study offers the scientific rationale for placebo-controlled trials using prebiotic fibers in PD patients. ClinicalTrials.gov Identifier: NCT04512599.
Overview
The claims and statistics of this paper haven’t been checked yet.
Run the check — free, no account needed. It reads the open-access text and checks the sources it cites.
Integrity signals
Registry
Cites
Statistics
Figures
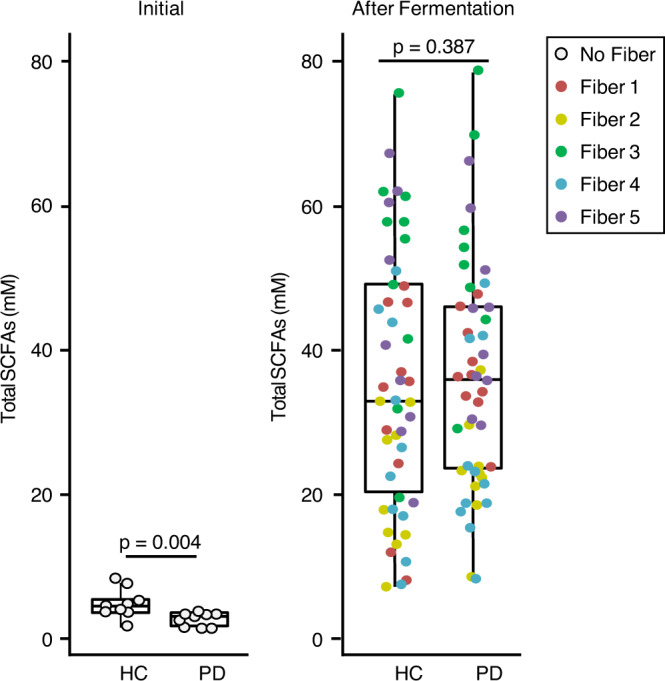
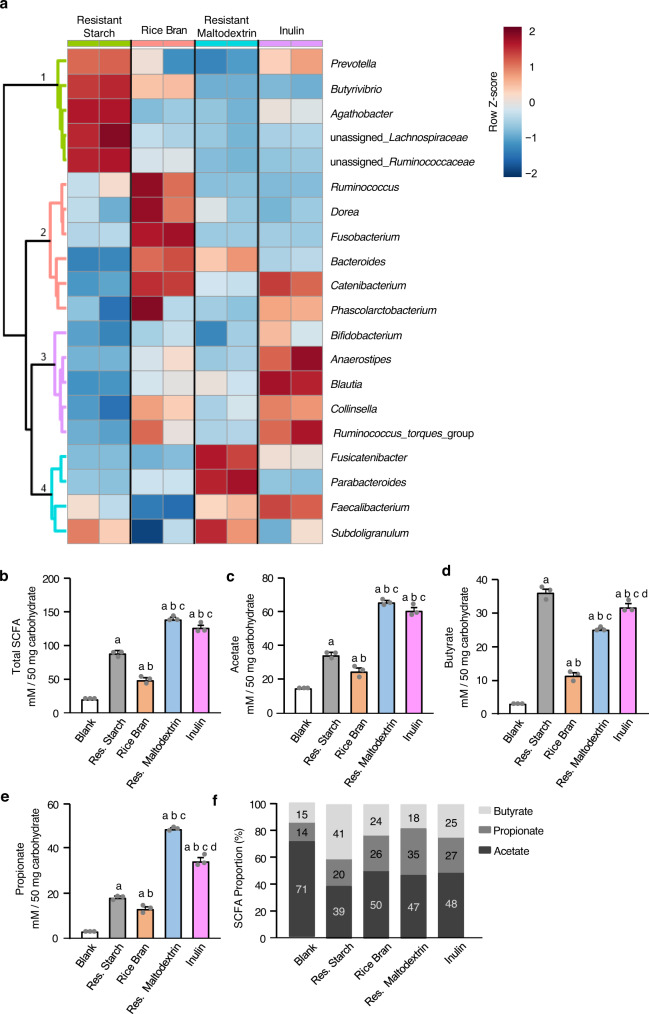
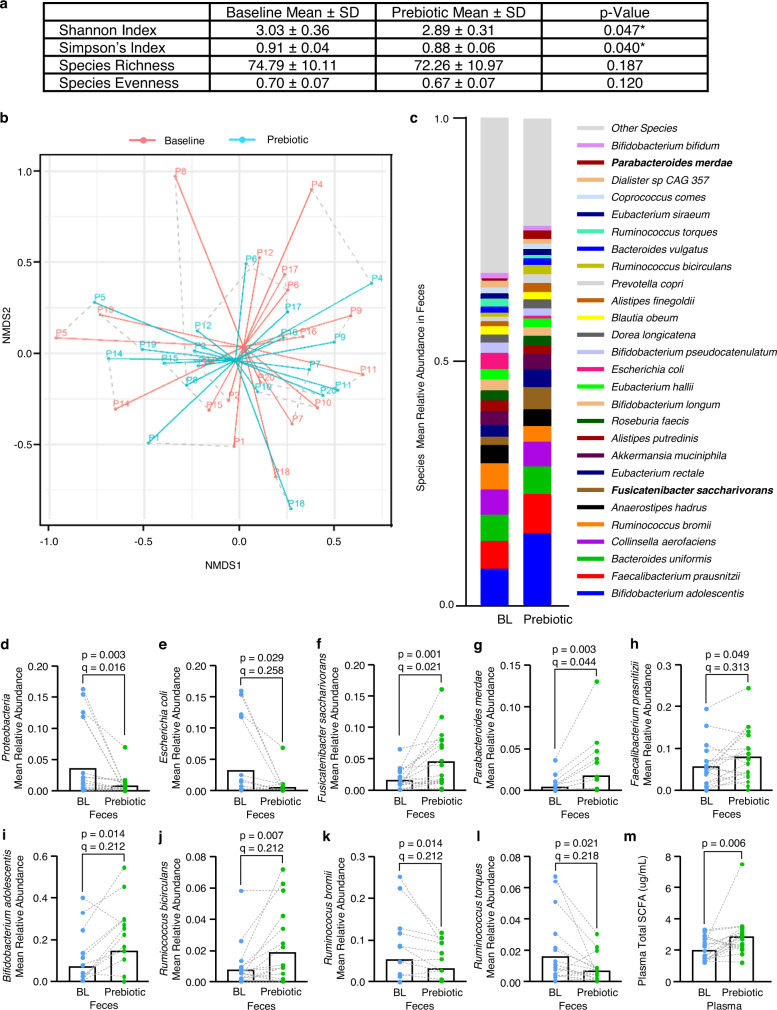
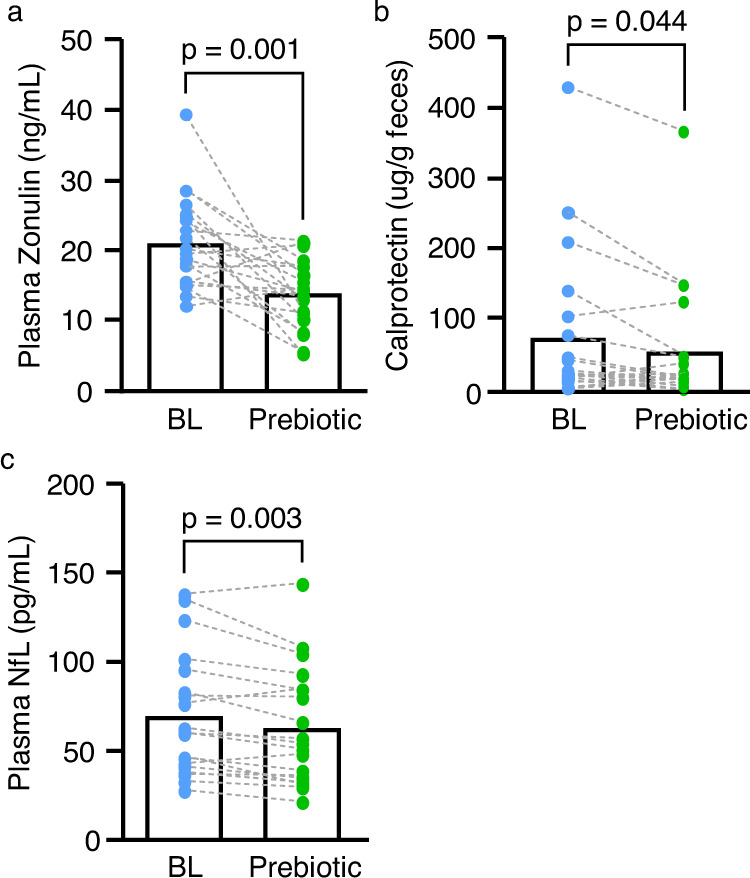
Verification
Claims the paper makes
The claims and statistics of this paper haven’t been checked yet.
Run the check — free, no account needed. It reads the open-access text and checks the sources it cites.
Claims other papers make about this one
Each is checked against this paper’s own text: does it say what the citing paper says it does?
The source backs part of the claim, not all of it — or backs it for a different population, condition or comparison.
In the citing paper
“A proof-of-concept trial conducted in PD patients has demonstrated that SCFAs-promoting prebiotic fiber intervention reduced plasma zonulin, indicating improved intestinal barrier integrity.”
From Microbiota–gut–brain axis and its therapeutic applications in neurodegenerative diseases (2024) · cites this paper as [332]
Experimental — accuracy not yet measuredThe source backs part of the claim, not all of it — or backs it for a different population, condition or comparison.
In the citing paper
“There is limited evidence of how pre- and pro-biotics influence gut microbiome composition and functionality, with only limited evidence from a few open-label studies to suggest that pre- and pro-biotics can increase the abundance of SCFA-producing bacteria, reduce the abundance of pro-inflammatory bacteria, and reduce levels of intestinal inflammatory markers like calprotectin [163, 177].”
From The gut–brain axis in early Parkinson’s disease: from prodrome to prevention (2025) · cites this paper as [177]
Experimental — accuracy not yet measuredIn the citing paper
“Importantly, the trial reported an increased abundance of SCFAs-producing species and increased plasma SCFA levels, along with improved intestinal barrier integrity and reduced intestinal inflammation.332”
From Microbiota–gut–brain axis and its therapeutic applications in neurodegenerative diseases (2024) · cites this paper as [332]
Self-check
Percentages, sums and reported differences re-computed from the paper’s own numbers.
The self-check needs the paper’s full text.
Citations
Cites
The SILVA ribosomal RNA gene database project: improved data processing and web-based tools
Quast, C., Pruesse, E., Yilmaz, P., Gerken, J., Schweer, T., Yarza, P., Peplies, J., & Glöckner, F. O. (2012) · Nucleic Acids Research · doi:10.1093/nar/gks1219 · Cited by 33,055
Parkinsonism: onset, progression, and mortality
Hoehn, M. M., & Yahr, M. D. (1967) · Neurology · doi:10.1212/wnl.17.5.427 · Cited by 12,107
Hughes, A. J., Daniel, S. E., Kilford, L., & Lees, A. J. (1992) · Journal of Neurology, Neurosurgery & Psychiatry · doi:10.1136/jnnp.55.3.181 · Cited by 10,378
Overdependence on degraded gist memory in Alzheimer's disease.
Gallo, D. A., Shahid, K. R., Olson, M. A., Solomon, T. M., Schacter, D. L., & Budson, A. E. (2006) · Neuropsychology · doi:10.1037/0894-4105.20.6.625 · Cited by 4,757
da Luz, A. C. D. D. S., Dias, G. P., Bevilaqua, M. C. D. N., Cocks, G. D., Gardino, P. F., Thuret, S., & Nardi, A. E. (2013) · Neuropsychobiology · doi:10.1159/000353269 · Cited by 4,015
Interaction between microbiota and immunity in health and disease
Zheng, D., Liwinski, T., & Elinav, E. (2020) · Cell Research · doi:10.1038/s41422-020-0332-7 · Cited by 3,947
Distance‐Based Tests for Homogeneity of Multivariate Dispersions
Anderson, M. J. (2006) · Biometrics · doi:10.1111/j.1541-0420.2005.00440.x · Cited by 3,304
Beghini, F., McIver, L. J., Blanco-Míguez, A., Dubois, L., Asnicar, F., Maharjan, S., Mailyan, A., Manghi, P., Scholz, M., Thomas, A. M., et al. (2021) · eLife · doi:10.7554/elife.65088 · Cited by 2,303
Systemic LPS causes chronic neuroinflammation and progressive neurodegeneration
Qin, L., Wu, X., Block, M. L., Liu, Y., Breese, G. R., Hong, J., Knapp, D. J., & Crews, F. T. (2007) · Glia · doi:10.1002/glia.20467 · Cited by 2,144
Gut microbiota are related to Parkinson's disease and clinical phenotype
Scheperjans, F., Aho, V., Pereira, P. A. B., Koskinen, K., Paulin, L., Pekkonen, E., Haapaniemi, E., Kaakkola, S., Eerola‐Rautio, J., Pohja, M., et al. (2015) · Movement Disorders · doi:10.1002/mds.26069 · Cited by 1,968
Cited by
Sorted by citations
Items 101–124 of 124
Role of microbiota gut–brain axis in Parkinson's disease
Mansuri, R., Dhanawat, M., Patel, S., Garima, G., & Diwan, A. (2025) · Elsevier eBooks · doi:10.1016/b978-0-443-21680-0.00003-1
Preferred fruit and vegetable consumption and colonic microbiota in young residents of Arkhangelsk
Kukalevskaya, N. N., Александровна, Б. Т., Sabanaev, M. A., & Grjibovski, A. M. (2024) · Экология человека · doi:10.17816/humeco633894
Dietary fibre responses in microbiota reveal opportunity for disease-specific prebiotic approaches
Chen, T., Cantu-Jungles, T. M., Zhang, B., Yao, T., Lamothe, L. M., Shaikh, M. W., Engen, P. A., Green, S. J., Keshavarzian, A., & Hamaker, B. R. (2025) · Beneficial Microbes · doi:10.1163/18762891-bja00067
Self-citationThe Role of Gut Microbiota in the Development of Colorectal Cancer (CRC)
Zhang, W. (2025) · Theoretical and Natural Science · doi:10.54254/2753-8818/2025.22053
Kothawade, S. N., Padwal, V., Bhosale, S., Mhaske, P., Jedhe, R., Makhare, S., & Baheti, D. (2025) · Nutritional Neuroscience · doi:10.1080/1028415x.2025.2497036
Olalekan, S. O., Okwute, P. G., Osonuga, I. O., Mofolorunso, A. M., Adegbesan, B. O., Ezima, E. N., & Oluwatunase, G. O. (2025) · IntechOpen eBooks · doi:10.5772/intechopen.1009908
Influence of gut microbiota on axonal cells of the brain
Suresh, G., Srivastava, S., & Singh, A. (2025) · Elsevier eBooks · doi:10.1016/b978-0-443-29932-2.00004-9 · Cited by 1
Yao, W., Wang, Y., Kong, Z., Guan, K., Kang, Y. J., Feng, Y., Wang, A., Jianguo, Z., Zhang, Y., & Zhang, G. (2025) · Food Science and Human Wellness · doi:10.26599/fshw.2025.9250795
Gut Microbiome in Chronic Disorder Management
Patnaik, S. K., Kandy, A. T., Mariappan, E., Negi, P., Nilewar, S. S., Bandaru, N., & Swaroop, A. K. (2026) · Springer eBooks · doi:10.1007/978-981-95-7494-0_15
Hoedt, E. C., Duncanson, K., Simm, N. M., Williams, G. M., & Talley, N. J. (2026) · Research Square · doi:10.21203/rs.3.rs-9962008/v1
Performance of the new generation of probiotics: a narrative review
Jafari, B., Kashi, K. K., & Behrouzi, A. (2026) · فصلنامه علوم پزشکی دانشگاه آزاد اسلامی واحد پزشکی تهران · doi:10.66224/iau.36.1.1
Hegelmaier, T., Duscha, A., Desel, C., Würtele, L.-M., Peplinski, J., Jauk, D., Troisi, R., Klietz, M., Faissner, S., Müller, T., et al. (2026) · Neurology and Therapy · doi:10.1007/s40120-026-00972-6
Pirovano, E., Silva, I. P., Camacho, M., Canak, A., Aktaş, B., Crompton, D., Gökçe, E., Tan, F.-M., Marino, F., Domingos, J., et al. (2026) · Neurochemistry International · doi:10.1016/j.neuint.2026.106211
Gao, S., Wang, Z., Xie, A.-H., Wu, J.-X., Li-yun, Q., Chen, T., & Chen, X. (2026) · Frontiers in Nutrition · doi:10.3389/fnut.2026.1907570
Self-citationTao, W., Yu, Y., Huang, X., Huang, J., Wang, N., Shangguan, X., Yu, R., & Xiao, F. (2026) · Frontiers in Cellular and Infection Microbiology · doi:10.3389/fcimb.2026.1806356
Gastrointestinal manifestations of Parkinson's disease
Pfeiffer, R. F., & Quigley, E. M. M. (2026) · Autonomic Neuroscience · doi:10.1016/j.autneu.2026.103475
Wang, W., Sun, W., Ma, L., Xu, M., & Dong, X. (2026) · Frontiers in Neurology · doi:10.3389/fneur.2026.1889517
Beyond bacteria: a multi-omics view of the gut–brain axis in Parkinson’s disease
Han, H., Luo, O., Li, K., Rahaman, S., Ok, E. U., Zhang, L., Liang, M., & Huang, L. (2026) · Frontiers in Cellular and Infection Microbiology · doi:10.3389/fcimb.2026.1900578
Microbiome and atherosclerosis: hype or future therapeutic target?
Hussain, Z., Gali, M., Patel, D., Kumar, A. S., Kumar, A. S., Ranganatha, A., & Swathi, N. L. (2026) · Journal of Basic and Clinical Physiology and Pharmacology · doi:10.1515/jbcpp-2025-0190
Beltrán, Ó. G., Angarita-Rodríguez, A., González, J., Hernández-Álvarez, E. D., & Pinzón, A. (2026) · Frontiers in Microbiology · doi:10.3389/fmicb.2026.1895237
Mehrotra, P., Vengadakrishnan, K., Mehrotra, P., & Dan, S. (2026) · Frontiers in Medicine · doi:10.3389/fmed.2026.1909087
Parkinson's disease pathogenesis: From molecular insights to novel therapies
Ramli, M. D. C., Abidin, Z. Z., Okunsai, B., Umbar, G. S. A., & Mauta, T. E. (2026) · Elsevier eBooks · doi:10.1016/b978-0-443-27702-3.00027-3
The role of gut microbiota in Parkinson's disease pharmacotherapy
Wadan, A. S., Hammadeh, B. M., Ahmed, M. A., Maged, A. A., & Ellakwa, D. E. (2026) · Elsevier eBooks · doi:10.1016/b978-0-443-54032-5.00002-4
Metadata
- Authors
- Hall, D. A., Voigt, R. M., Cantu-Jungles, T. M., Hamaker, B., Engen, P. A., Shaikh, M., Raeisi, S., Green, S. J., Naqib, A., Forsyth, C. B., Chen, T., Manfready, R., Ouyang, B., Rasmussen, H. E., Sedghi, S., Goetz, C. G., & Keshavarzian, A.
- Affiliations
- Rush University Medical Center (US)
- Nanchang University (CN)
- University of Nebraska–Lincoln (US)
- Mercer University (US)
- Corresponding author
- Keshavarzian, Ali
- ORCID
- Venue
- Nature Communications
- Published
- 2023-02-18
- Volume
- 14
- Issue
- 1
- Pages
- 926-926
- ISSN
- 2041-1723 (ISSN-L)
- PMC
- PMC9938693
- OpenAlex
- W4321328855
- Cited by
- 124
- References
- 94
- Citations by year
- 2026: 24 · 2025: 55 · 2024: 35 · 2023: 10
- FWCI
- 21.10
- Type
- journal article
- Language
- en
- Open access
- gold
- doi.org
- Locations
- Nature Communications (publishedVersion, cc-by)
- PubMed Central (publishedVersion, cc-by)
- PubMed (publishedVersion)
- RePEc: Research Papers in Economics (submittedVersion)
- DOAJ (DOAJ: Directory of Open Access Journals) (submittedVersion, cc-by-sa)
- Funders
- Parkinson's Foundation
- National Institutes of Health (NIH-R01, AA026801)
- National Institute on Alcohol Abuse and Alcoholism (R24AA026801)
- National Institute on Aging (R01AG056653)
- NIH Clinical Center
- Topics
- Health Sciences › Medicine › Clinical Neurology › Parkinson's Disease Mechanisms and Treatments
- Life Sciences › Biochemistry, Genetics and Molecular Biology › Molecular Biology › Gut microbiota and health
- Health Sciences › Nursing › Nutrition and Dietetics › Microbial Metabolites in Food Biotechnology
- Keywords
- Parkinson's disease, prebiotic fiber, gut microbiota, short-chain fatty acids, intestinal fermentation, neuroinflammation, neurofilament light chain, dietary intervention, gut-brain axis
- MeSH terms
- Gastrointestinal Microbiome, Fatty Acids, Volatile, Feces, Humans, Parkinson Disease, Prebiotics
About these checks
Registry, retraction, Cites and statistics results are computed, not judged, with one exception: a printed reference that no index lists is read once by a model before it counts as a citation error. Claims are extracted by a model and kept only when their quote appears verbatim in the text; each cited source is then checked, with a model’s help, for whether it says what the claim relies on. Those verdicts can be wrong — read the claim’s quote and the cited source before relying on one.
Statistics and arithmetic are recomputed, not judged.
Confidence bands are shown only for fields calibrated on our annotated test set. None is calibrated yet, so no band is shown.
What counts as a claim ›How we measure confidence ›How we check this ›
Are you an author, or do you see a problem with this page? Request a review
