

The DOI matches its Crossref record; 11 of the 11 references it cites were found in a registry or an index.
Plastic waste discharge to the global ocean constrained by seawater observations
Abstract
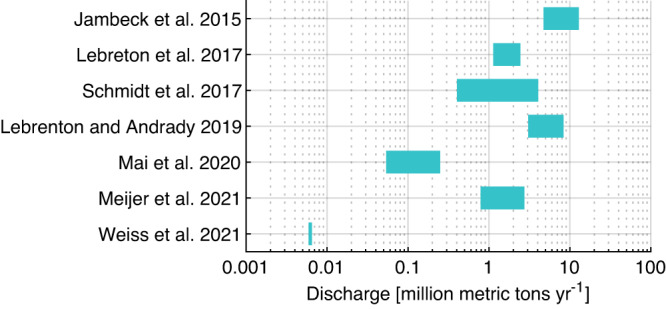
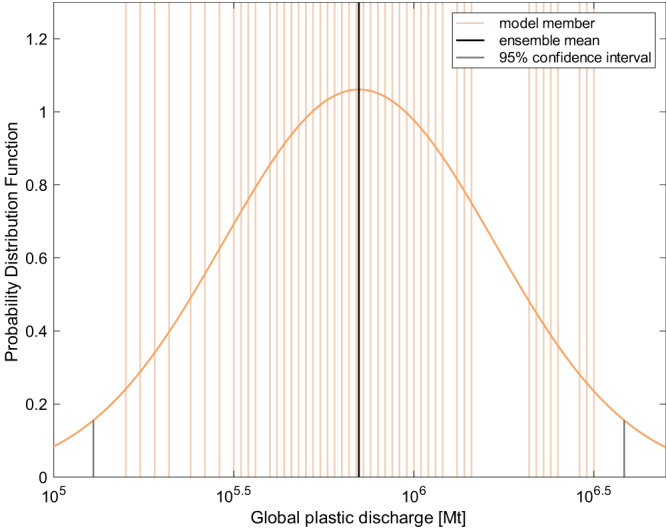
Marine plastic pollution poses a potential threat to the ecosystem, but the sources and their magnitudes remain largely unclear. Existing bottom-up emission inventories vary among studies for two to three orders of magnitudes (OMs). Here, we adopt a top-down approach that uses observed dataset of sea surface plastic concentrations and an ensemble of ocean transport models to reduce the uncertainty of global plastic discharge. The optimal estimation of plastic emissions in this study varies about 1.5 OMs: 0.70 (0.13–3.8 as a 95% confidence interval) million metric tons yr−1 at the present day. We find that the variability of surface plastic abundance caused by different emission inventories is higher than that caused by model parameters. We suggest that more accurate emission inventories, more data for the abundance in the seawater and other compartments, and more accurate model parameters are required to further reduce the uncertainty of our estimate.
Overview
The claims and statistics of this paper haven’t been checked yet.
Run the check — free, no account needed. It reads the open-access text and checks the sources it cites.
Integrity signals
Registry
Cites
Statistics
Figures
Verification
Claims the paper makes
The claims and statistics of this paper haven’t been checked yet.
Run the check — free, no account needed. It reads the open-access text and checks the sources it cites.
Claims other papers make about this one
Each is checked against this paper’s own text: does it say what the citing paper says it does?
The source backs part of the claim, not all of it — or backs it for a different population, condition or comparison.
In the citing paper
“This mismanagementexacerbatesthenegativeexternalities associated with MSW, impacting the environment 5 -7 , society 8 , and economy 9 . Consequently, it poses a signi fi cant threat to urban sustainability”
From Characterizing the polycentricity in waste governance: a comparative study on Shanghai, Tokyo, and Hong Kong (2024) · cites this paper as [5]
Experimental — accuracy not yet measured
Self-check
Percentages, sums and reported differences re-computed from the paper’s own numbers.
The self-check needs the paper’s full text.
Citations
Cites
River plastic emissions to the world’s oceans
Lebreton, L. C. M., van der Zwet, J., Damsteeg, J.-W., Slat, B., Andrady, A., & Reisser, J. (2017) · Nature Communications · doi:10.1038/ncomms15611 · Cited by 4,011
Plastic debris in the open ocean
Cózar, A., Echevarría, F., González-Gordillo, J. I., Irigoien, X., Úbeda, B., Hernández-León, S., Palma, Á. T., Navarro, S., García-de-Lomas, J., Ruiz, A., et al. (2014) · Proceedings of the National Academy of Sciences · doi:10.1073/pnas.1314705111 · Cited by 3,133
Future Scenarios of Global Plastic Waste Generation and Disposal
Lebreton, L., & Andrady, A. (2019) · Palgrave Communications · doi:10.1057/s41599-018-0212-7 · Cited by 2,327
The impact of debris on marine life
Gall, S. C., & Thompson, R. C. (2015) · Marine Pollution Bulletin · doi:10.1016/j.marpolbul.2014.12.041 · Cited by 2,187 · cited 1×
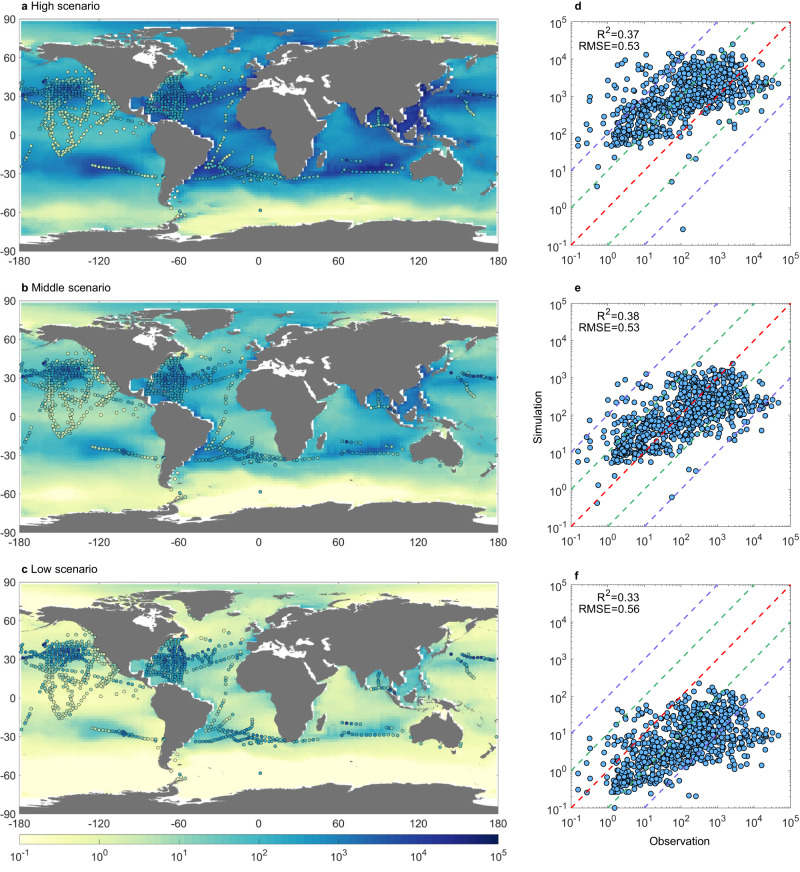
“These models track the spatial pattern relatively well but contain substantial uncertainties of 2 – 3 OMs in estimating the surface ocean plastic abundance 10 .”
The deep sea is a major sink for microplastic debris
Woodall, L. C., Sanchez-Vidal, A., Canals, M., Paterson, G. L. J., Coppock, R., Sleight, V., Calafat, A., Rogers, A. D., Narayanaswamy, B. E., & Thompson, R. C. (2014) · Royal Society Open Science · doi:10.1098/rsos.140317 · Cited by 1,946 · cited 1×
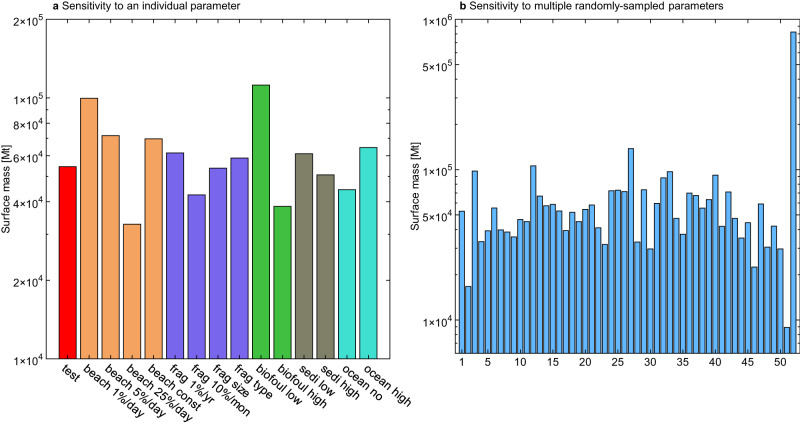
“The beaching/sedimentation rates are an important source of uncertainty, as beaches and sediments are major reservoirs for marine plastics 18,38 .”
Lusher, A. L., Tirelli, V., O’Connor, I., & Officer, R. (2015) · Scientific Reports · doi:10.1038/srep14947 · Cited by 1,170
Ups and Downs in the Ocean: Effects of Biofouling on Vertical Transport of Microplastics
Kooi, M., Nes, E. H. V., Scheffer, M., & Koelmans, A. A. (2017) · Environmental Science & Technology · doi:10.1021/acs.est.6b04702 · Cited by 977
Understanding the fragmentation pattern of marine plastic debris
ter Halle, A., Ladirat, L., Gendre, X., Goudouneche, D., Pusineri, C., Routaboul, C., Tenailleau, C., Duployer, B., & Perez, E. (2016) · Environmental Science & Technology · doi:10.1021/acs.est.6b00594 · Cited by 613
A global mass budget for positively buoyant macroplastic debris in the ocean
Lebreton, L., Egger, M., & Slat, B. (2019) · Scientific Reports · doi:10.1038/s41598-019-49413-5 · Cited by 563
Fragmentation of plastic objects in a laboratory seawater microcosm
Gerritse, J., Leslie, H. A., de Tender, C. A., Devriese, L. I., & Vethaak, A. D. (2020) · Scientific Reports · doi:10.1038/s41598-020-67927-1 · Cited by 220
Research works printed but not linked: 68
- Wilcoxa, C., Sebilleb, E. V. & Hardestya, B. D. Threat of plastic pollution to seabirds is global, pervasive, and increasing. Proc. Natl Acad. Sci. USA 112, 11899–11904 (2015). · DOI
- Li, W. C., Tse, H. F. & Fok, L. Plastic waste in the marine environment: a review of sources, occurrence and effects. Sci. Total Environ. 566–567, 333–349 (2016). · DOI
- Jambeck, J. R. et al. Plastic waste inputs from land into the ocean. Science 347, 768–771 (2015). · DOI · Paper page
- Geyer, R., Jambeck, J. R. & Law, K. L. Production, use, and fate of all plastics ever made. Sci. Adv. 3, e170078 (2017). · DOI · Paper page
- Mai, L. et al. Global riverine plastic outflows. Environ. Sci. Technol. 54, 10049–10056 (2020). · DOI
- Meijer, L., van Emmerik, T., van der Ent, R., Schmidt, C. & Lebreton, L. More than 1000 rivers account for 80% of global riverine plastic emissions into the ocean. Sci. Adv. 7, eaaz5803 (2021). · DOI
- Weiss, L. et al. The missing ocean plastic sink: gone with the rivers. Science 373, 107–111 (2021). · DOI
- van Emmerik, T., Mellink, Y., Hauk, R., Waldschläger, K. & Schreyers, L. Rivers as plastic reservoirs. Front. Water 3, 786936 (2022). · DOI
- van Sebille, E. et al. A global inventory of small floating plastic debris. Environ. Res. Lett. 10, 124006 (2015). · DOI · Paper page
- Eriksen, M. et al. Plastic pollution in the world’s oceans: More than 5 trillion plastic pieces weighing over 250,000 tons afloat at sea. PLoS ONE 9, e111913 (2014). · DOI · Paper page
- Cole, M., Lindeque, P., Halsband, C. & Galloway, T. S. Microplastics as contaminants in the marine environment: a review. Mar. Pollut. Bull. 62, 2588–2597 (2011). · DOI · Paper page
- Wichmann, D., Delandmeter, P. & Van Sebille, E. Influence of near-surface currents on the global dispersal of marine microplastic. J. Geophys. Res. 124, 6086–6096 (2019). · DOI
- Mountford, A. S. & Morales Maqueda, M. A. Eulerian modeling of the three‐dimensional distribution of seven popular microplastic types in the global ocean. J. Geophys. Res.: Oceans 124, 8558–8573 (2019). · DOI
- Onink, V., Jongedijk, C. E., Hoffman, M. J., van Sebille, E. & Laufkötter, C. Global simulations of marine plastic transport show plastic trapping in coastal zones. Environ. Res. Lett. 16, 064053 (2021). · DOI · Paper page
- Lobelle, D. et al. Global modeled sinking characteristics of biofouled microplastic. J. Geophys. Res. Oceans 126, e2020JC017098 (2021). · DOI
- Huck, T. et al. Three-dimensional dispersion of neutral “plastic” particles in a global ocean model. Front. Anal. Sci. 2, 868515 (2022). · DOI
- Richon, C., Gorgues, T., Paul-Pont, I. & Maes, C. Zooplankton exposure to microplastics at the global scale: influence of vertical distribution and seasonality. Front. Mar. Sci. 9, 947309 (2022). · DOI
- Brahney, J. et al. Constraining the atmospheric limb of the plastic cycle. Proc. Natl Acad. Sci. USA 118, e2020719118 (2021). · DOI
- Law, K. L. et al. Distribution of surface plastic debris in the eastern Pacific Ocean from an 11-Year data set. Environ. Sci. Technol. 48, 4732–4738 (2014). · DOI
- Law, K. L. et al. Plastic accumulation in the North Atlantic Subtropical Gyre. Science 329, 1185–1188 (2010). · DOI · Paper page
- Song, Y. K. et al. A comparison of microscopic and spectroscopic identification methods for analysis of microplastics in environmental samples. Mar. Pollut. Bull. 93, 202–209 (2015). · DOI
- Lebreton, L., Greer, S. & Borrero, J. C. Numerical modelling of floating debris in the world’s oceans. Mar. Pollut. Bull. 64, 653–661 (2012). · DOI
- Wilcox, C., Hardesty, B. D. & Law, K. L. Abundance of floating plastic particles is increasing in the Western North Atlantic Ocean. Environ. Sci. Technol. 54, 790–796 (2020). · DOI
- Brach, L. et al. Anticyclonic eddies increase accumulation of microplastic in the North Atlantic subtropical gyre. Mar. Pollut. Bull. 126, 191–196 (2018). · DOI
- Vic, C., Hascoët, S., Gula, J., Huck, T. & Maes, C. Oceanic mesoscale cyclones cluster surface Lagrangian material. Geophys. Res. Lett. 49, e2021GL097488 (2022). · DOI
- Andrady, A. L. Microplastics in the marine environment. Mar. Pollut. Bull. 62, 1596–1605 (2011). · DOI · Paper page
- Kaiser, D., Kowalski, N. & Waniek, J. J. Effects of biofouling on the sinking behavior of microplastics. Environ. Res. Lett. 12, 124003 (2017). · DOI
- Dutkiewicz, S., Follows, M. J. & Bragg, J. G. Modeling the coupling of ocean ecology and biogeochemistry. Glob. Biogeochem. Cycles 23, GB4017 (2009). · DOI
- Fazey, F. M. C. & Ryan, P. G. Debris size and buoyancy influence the dispersal distance of stranded litter. Mar. Pollut. Bull. 110, 371–377 (2016). · DOI
- Kvale, K., Prowe, A. E. F., Chien, C.-T., Landolfi, A. & Oschlies, A. The global biological microplastic particle sink. Sci. Rep. 10, 16670 (2020). · DOI
- Zhang, H. Transport of microplastics in coastal seas. Estuar., Coast. Shelf Sci. 199, 74–86 (2017). · DOI · Paper page
- Hinata, H., Mori, K., Ohno, K., Miyao, Y. & Kataoka, T. An estimation of the average residence times and onshore-offshore diffusivities of beached microplastics based on the population decay of tagged meso-and macrolitter. Mar. Pollut. Bull. 122, 17–26 (2017). · DOI
- Kaandorp, M. L. A., Dijkstra, H. A. & van Sebille, E. Modelling size distributions of marine plastics under the influence of continuous cascading fragmentation. Environ. Res. Lett. 16, 054075 (2021). · DOI
- Atwood, E. C. et al. Coastal accumulation of microplastic particles emitted from the Po River, Northern Italy: comparing remote sensing and hydrodynamic modelling with in situ sample collections. Mar. Pollut. Bull. 138, 561–574 (2019). · DOI
- Samaras, A. G., De Dominicis, M., Archetti, R., Lamberti, A. & Pinardi, N. Towards improving the representation of beaching in oil spill models: a case study. Mar. Pollut. Bull. 88, 91–101 (2014). · DOI
- Stanev, E. V. et al. Extreme westward surface drift in the North Sea: public reports of stranded drifters and Lagrangian tracking. Cont. Shelf Res. 177, 24–32 (2019). · DOI
- Kane, I. A. et al. Seafloor microplastic hotspots controlled by deep-sea circulation. Science 368, 1140–1145 (2020). · DOI
- Richardson, K., Hardesty, B. D. & Wilcox, C. Estimates of fishing gear loss rates at a global scale: a literature review and meta-analysis. Fish. Fish. 20, 1218–1231 (2019). · DOI
- Richardson, K., Hardesty, B. D., Vince, J. Z. & Wilcox, C. Global estimates of fishing gear lost to the ocean each year. Sci. Adv. 8, eabq0135 (2022). · DOI
- Ryan, P. G., Dilley, B. J., Ronconi, R. A. & Connan, M. Rapid increase in Asian bottles in the South Atlantic Ocean indicates major debris inputs from ships. Proc. Natl Acad. Sci. USA 116, 20892–20897 (2019). · DOI
- Ryan, P. G. The transport and fate of marine plastics in South Africa and adjacent oceans. S. Afr. J. Sci. 116, 1–9 (2020). · DOI
- Collins, C. & Hermes, J. C. Modelling the accumulation and transport of floating marine micro-plastics around South Africa. Mar. Pollut. Bull. 139, 46–58 (2019). · DOI
- Marshall, J., Adcroft, A., Hill, C., Perelman, L. & Heisey, C. A finite-volume, incompressible Navier–Stokes model for studies of the ocean on parallel computers. J. Geophys. Res.: Oceans 102, 5753–5766 (1997). · DOI
- Peng, Y., Wu, P., Schartup, A. T. & Zhang, Y. Plastic waste release caused by COVID-19 and its fate in the global ocean. Proc. Natl Acad. Sci. USA 118, e2111530118 (2021). · DOI
- Monier, E. et al. Toward a consistent modeling framework to assess multi-sectoral climate impacts. Nat. Commun. 9, 660 (2018). · DOI
- Large, W. G., McWilliams, J. C. & Doney, S. C. Oceanic vertical mixing: a review and a model with a nonlocal boundary layer parameterization. Rev. Geophys. 32, 363–403 (1994). · DOI · Paper page
- Gent, P. R. & Mcwilliams, J. C. Isopycnal mixing in ocean circulation models. J. Phys. Oceanogr. 20, 150–155 (1990). · DOI
- Hoornweg, D. & Bhada-Tata, P. What a Waste: A Global Review of Solid Waste Management (World Bank, 2012).
- Kaza, S., Yao, L., Bhada-Tata, P. & Van Woerden, F. What a Waste 2.0: A Global Snapshot of Solid Waste Management to 2050 (World Bank, 2018). · DOI · Paper page
- Chassignet, E., Xu, X. & Zavala-Romero, O. Tracking marine litter with a global ocean model: where does it go? Where does it come from? Front. Mar. Sci. 8, 667591 (2021). · DOI
- Kroodsma, D. A. et al. Tracking the global footprint of fisheries. Science 359, 904–908 (2018). · DOI
- Wang, X. et al. Ship emissions around China under gradually promoted control policies from 2016 to 2019. Atmos. Chem. Phys. 21, 13835–13853 (2021). · DOI
- China Plastic. China Plastics Industry Yearbook (China Petrocheical Press, 2014).
- Khalaf, H. K. The theoretical investigation of drag coefficient and settling velocity correlations. Master thesis, Nahrain University (2009).
- Flemmer, R. L. & Banks, C. L. On the drag coefficient of a sphere. Powder Technol. 48, 217–221 (1986). · DOI
- Hackett, B., Breivik, Ø. & Wettre, C. In Ocean weather forecasting 507–523 (Springer, 2006).
- Chubarenko, I., Bagaev, A., Zobkov, M. & Esiukova, E. On some physical and dynamical properties of microplastic particles in marine environment. Mar. Pollut. Bull. 108, 105–112 (2016). · DOI
- Kalnay, E. et al. The NCEP/NCAR 40-year reanalysis project. Bull. Am. Meteorol. Soc. 77, 437–472 (1996). · DOI
- Stokes, G. On the theory of oscillatory waves. Trans. Camb. Philos. Soc. 8, 441–455 (1847).
- Dobler, D. et al. Large impact of Stokes drift on the fate of surface floating debris in the South Indian Basin. Mar. Pollut. Bull. 148, 202–209 (2019). · DOI
- White, J. R. & Turnbull, A. Weathering of polymers: mechanisms of degradation and stabilization, testing strategies and modelling. J. Mater. Sci. 29, 584–613 (1994). · DOI
- Welden, N. A. & Cowie, P. R. Degradation of common polymer ropes in a sublittoral marine environment. Mar. Pollut. Bull. 118, 248–253 (2017). · DOI · Paper page
- Sun, J., Zheng, H., Xiang, H., Fan, J. & Jiang, H. The surface degradation and release of microplastics from plastic films studied by UV radiation and mechanical abrasion. Sci. Total Environ. 838, 156369 (2022). · DOI
- Brandon, J., Goldstein, M. & Ohman, M. D. Long-term aging and degradation of microplastic particles: comparing in situ oceanic and experimental weathering patterns. Mar. Pollut. Bull. 110, 299–308 (2016). · DOI · Paper page
- Luijendijk, A. et al. The state of the world’s beaches. Sci. Rep. 8, 6641 (2018). · DOI
- Lorenc, A. C. Analysis methods for numerical weather prediction. Q. J. R. Meteorol. Soc. 112, 1177–1194 (1986). · DOI
- Burgers, G., Van Leeuwen, P. J. & Evensen, G. Analysis scheme in the ensemble Kalman filter. Mon. Weather Rev. 126, 1719–1724 (1998). · DOI
- Schmidt, C., Krauth, T. & Wagner, S. Export of plastic debris by rivers into the sea. Environ. Sci. Technol. 51, 12246–12253 (2017). · DOI · Paper page
Cited by
Sorted by citations
Xia, L., Ke, Y., Wu, Z., Wang, J., Wang, R., Cai, Y., & Yang, Z. (2024) · Resources, Conservation and Recycling · doi:10.1016/j.resconrec.2024.107429 · Cited by 36
Self-citationDegradation of polyethylene by three bacteria isolated from coastal beach
Chen, J.-Q., Rong, Z., Zheng, D.-Q., Wu, Y.-H., & Xu, X.-W. (2025) · Environmental Research · doi:10.1016/j.envres.2025.121603 · Cited by 8
Self-citationHao, X., Dong, L., Qian, X., Benjamin, S., Wang, H., Chen, P., Wang, X., Ma, W., Li, J., Tong, X., et al. (2024) · npj Urban Sustainability · doi:10.1038/s42949-024-00179-4 · Cited by 8
Self-citation
Metadata
- Authors
- Zhang, Y., Wu, P., Xu, R., Wang, X., Lei, L., Schartup, A. T., Peng, Y., Pang, Q., Wang, X., Mai, L., Wang, R., Liu, H., Wang, X., Luijendijk, A., Chassignet, E., Xu, X., Shen, H., Zheng, S., & Zeng, E. Y.
- Venue
- Nature Communications
- Published
- 2023-03-13
- Volume
- 14
- Issue
- 1
- ISSN
- 2041-1723
- PMC
- PMC10011382
- Cited by
- 129
- References
- 11
- Language
- en
- Update notices
- correction (2023-12-18)
- Funders
- National Natural Science Foundation of China (42177349)
About these checks
Registry, retraction, Cites and statistics results are computed, not judged, with one exception: a printed reference that no index lists is read once by a model before it counts as a citation error. Claims are extracted by a model and kept only when their quote appears verbatim in the text; each cited source is then checked, with a model’s help, for whether it says what the claim relies on. Those verdicts can be wrong — read the claim’s quote and the cited source before relying on one.
Statistics and arithmetic are recomputed, not judged.
Confidence bands are shown only for fields calibrated on our annotated test set. None is calibrated yet, so no band is shown.
What counts as a claim ›How we measure confidence ›How we check this ›
Are you an author, or do you see a problem with this page? Request a review
