

The DOI matches its Crossref record; 59 of the 59 references it cites were found in a registry or an index.
Tailoring a local acid-like microenvironment for efficient neutral hydrogen evolution
Open accessAbstract
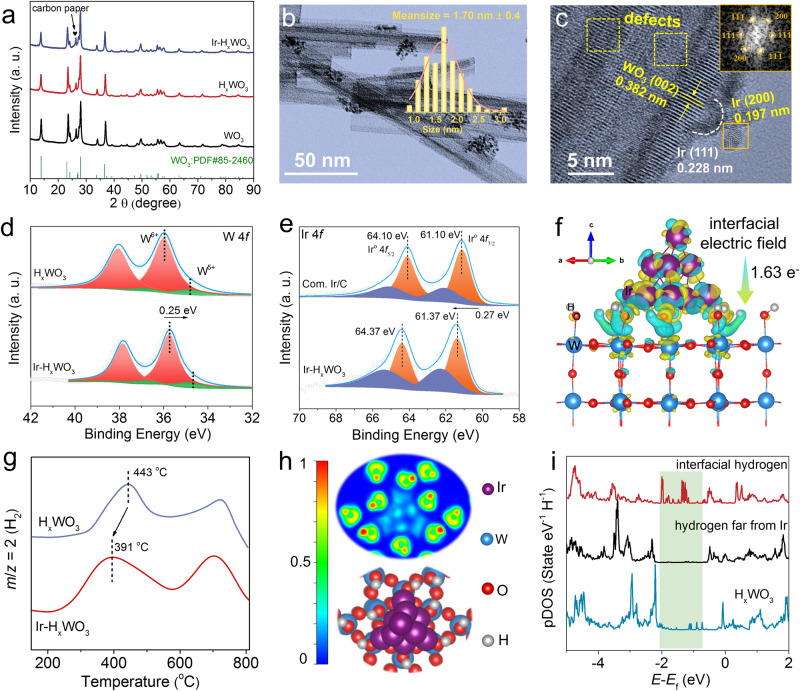
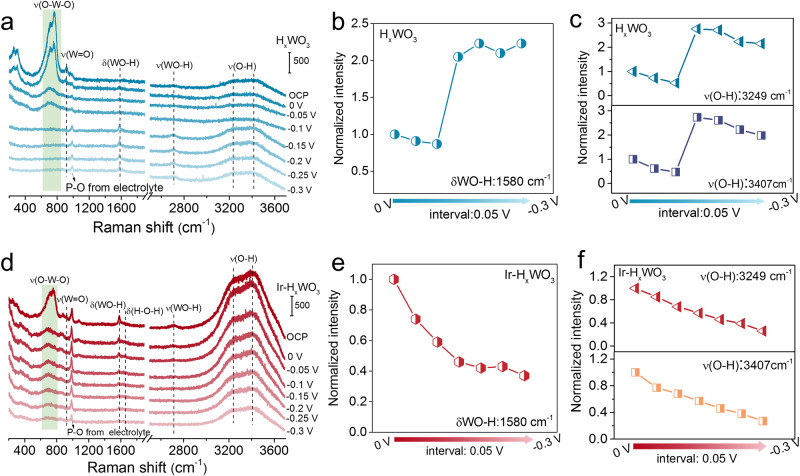
Electrochemical hydrogen evolution reaction in neutral media is listed as the most difficult challenges of energy catalysis due to the sluggish kinetics. Herein, the Ir-H x WO 3 catalyst is readily synthesized and exhibits enhanced performance for neutral hydrogen evolution reaction. H x WO 3 support is functioned as proton sponge to create a local acid-like microenvironment around Ir metal sites by spontaneous injection of protons to WO 3 , as evidenced by spectroscopy and electrochemical analysis. Rationalize revitalized lattice-hydrogen species located in the interface are coupled with H ad atoms on metallic Ir surfaces via thermodynamically favorable Volmer-Tafel steps, and thereby a fast kinetics. Elaborated Ir-H x WO 3 demonstrates acid-like activity with a low overpotential of 20 mV at 10 mA cm −2 and low Tafel slope of 28 mV dec −1 , which are even comparable to those in acidic environment. The concept exemplified in this work offer the possibilities for tailoring local reaction microenvironment to regulate catalytic activity and pathway.
Overview
The claims and statistics of this paper haven’t been checked yet.
Free: it reads the open-access text and checks the first 5 claims that cite a source we can check. Create a free account to check every claim.
Integrity signals
Registry
Cites
Statistics
Figures





Verification
Claims the paper makes
The claims and statistics of this paper haven’t been checked yet.
Free: it reads the open-access text and checks the first 5 claims that cite a source we can check. Create a free account to check every claim.
Claims other papers make about this one
Each is checked against this paper’s own text: does it say what the citing paper says it does?
The cited source says what the claim attributes to it.
In the citing paper
“Currently, the acid HER pathway typically involves the Volmer step, which generates adsorbed hydrogen intermediates (H*) by electrochemical reduction, generally followed by either the charge-transfer Heyrovsky process () or a Tafel recombination process () to produce H216,17.”
From Pd hydride metallene aerogels with lattice hydrogen participation for efficient hydrogen evolution reaction (2024) · cites this paper as [16]
Self-check
Percentages, sums and reported differences re-computed from the paper’s own numbers.
The self-check needs the paper’s full text.
Citations
Cites
A simple measure of electron localization in atomic and molecular systems
Becke, A. D., & Edgecombe, K. E. (1990) · The Journal of Chemical Physics · doi:10.1063/1.458517 · Cited by 7,145
Sustainable Hydrogen Production
Turner, J. A. (2004) · Science · doi:10.1126/science.1103197 · Cited by 6,602
Alternative energy technologies
Dresselhaus, M. S., & Thomas, I. L. (2001) · Nature · doi:10.1038/35104599 · Cited by 4,894
Enhancing Hydrogen Evolution Activity in Water Splitting by Tailoring Li + -Ni(OH) 2 -Pt Interfaces
Subbaraman, R., Tripkovic, D., Strmcnik, D., Chang, K.-C., Uchimura, M., Paulikas, A. P., Stamenkovic, V., & Markovic, N. M. (2011) · Science · doi:10.1126/science.1211934 · Cited by 3,135
Recent Advances in Electrocatalytic Hydrogen Evolution Using Nanoparticles
Zhu, J., Hu, L., Zhao, P., Lee, L. Y. S., & Wong, K.-Y. (2020) · Chemical Reviews · doi:10.1021/acs.chemrev.9b00248 · Cited by 3,133
Energy and fuels from electrochemical interfaces
Stamenkovic, V. R., Strmcnik, D., Lopes, P. P., & Markovic, N. M. (2017) · Nature Materials · doi:10.1038/nmat4738 · Cited by 2,030
Chatenet, M., Pollet, B. G., Dekel, D. R., Dionigi, F., Deseure, J., Millet, P., Braatz, R. D., Bazant, M. Z., Eikerling, M., Staffell, I., et al. (2022) · Chemical Society Reviews · doi:10.1039/d0cs01079k · Cited by 2,025
Hydrogen-treated WO3 nanoflakes show enhanced photostability
Wang, G., Ling, Y., Wang, H., Yang, X., Wang, C., Zhang, J. Z., & Li, Y. (2012) · Energy & Environmental Science · doi:10.1039/c2ee03158b · Cited by 766
Dinh, C.-T., Jain, A., de Arquer, F. P. G., De Luna, P., Li, J., Wang, N., Zheng, X., Cai, J., Gregory, B. Z., Voznyy, O., et al. (2018) · Nature Energy · doi:10.1038/s41560-018-0296-8 · Cited by 717
Self-citationImpedance Analysis of Electrochemical Systems
Vivier, V., & Orazem, M. E. (2022) · Chemical Reviews · doi:10.1021/acs.chemrev.1c00876 · Cited by 615
Cited by
Bao, D., Huang, L., Gao, Y., Davey, K., Zheng, Y., & Qiao, S.-Z. (2024) · Journal of the American Chemical Society · doi:10.1021/jacs.4c13036 · Cited by 140
Wang, L., Ma, M., Zhang, C., Chang, H., Zhang, Y., Li, L., Chen, H., & Peng, S. (2024) · Angewandte Chemie International Edition · doi:10.1002/anie.202317220 · Cited by 125
Wang, H., Qin, Y., Wu, Y., Qiu, Y., Ling, L., Fang, Q., Wang, C., Hu, L., Gu, W., & Zhu, C. (2024) · Nature Communications · doi:10.1038/s41467-024-54601-7 · Cited by 71
Fan, H., Wan, X., Sun, S., Zhou, X., Bu, X., Ye, J., Bai, R., Lou, H., Chen, Y., Gao, J., et al. (2025) · Advanced Energy Materials · doi:10.1002/aenm.202405681 · Cited by 70
Haryanto, A., Jung, K., Lee, C. W., & Kim, D.-W. (2024) · Journal of Energy Chemistry · doi:10.1016/j.jechem.2023.10.031 · Cited by 56
Metadata
- Authors
- Zheng, X., Shi, X., Ning, H., Yang, R., Lu, B., Luo, Q., Mao, S., Xi, L., & Wang, Y.
- Affiliations
- State Key Laboratory of Clean Energy Utilization (CN)
- Zhengzhou University (CN)
- Corresponding author
- Wang, Yong
- Venue
- Nature Communications
- Published
- 2023-07-14
- Volume
- 14
- Issue
- 1
- Pages
- 4209-4209
- ISSN
- 2041-1723 (ISSN-L)
- PMC
- PMC10349089
- OpenAlex
- W4384301247
- Cited by
- 247
- References
- 59
- Citations by year
- 2026: 61 · 2025: 102 · 2024: 74 · 2023: 10
- FWCI
- 11.78
- Type
- journal article
- Language
- en
- Open access
- gold
- doi.org
- Licence
- cc-by
- creativecommons.org/licenses/by/4.0 (tdm)
- creativecommons.org/licenses/by/4.0 (vor)
- Locations
- Nature Communications (publishedVersion, cc-by)
- PubMed Central (publishedVersion, cc-by)
- PubMed (publishedVersion)
- RePEc: Research Papers in Economics (submittedVersion)
- DOAJ (DOAJ: Directory of Open Access Journals) (submittedVersion, cc-by-sa)
- Funders
- National Natural Science Foundation of China (2021YFB3801600, 2023C01108, 21872121, 21908189, 2022C01151, 2022C01218)
- Topics
- Physical Sciences › Energy › Renewable Energy, Sustainability and the Environment › Electrocatalysts for Energy Conversion
- Physical Sciences › Energy › Renewable Energy, Sustainability and the Environment › Advanced Photocatalysis Techniques
- Physical Sciences › Energy › Renewable Energy, Sustainability and the Environment › CO2 Reduction Techniques and Catalysts
- Keywords
- iridium catalysts, tungsten oxide support, proton sponge, electrocatalysis, overpotential, Tafel slope, supported metal catalysts
- MeSH terms
- Bandages, Catalysis, Hydrogen, Protons, Genetic Drift
About these checks
Registry, retraction, Cites and statistics results are computed, not judged, with one exception: a printed reference that no index lists is read once by a model before it counts as a citation error. Claims are extracted by a model and kept only when their quote appears verbatim in the text; each cited source is then checked, with a model’s help, for whether it says what the claim relies on. Those verdicts can be wrong — read the claim’s quote and the cited source before relying on one.
Statistics and arithmetic are recomputed, not judged.
Confidence bands are shown only for fields calibrated on our annotated test set. None is calibrated yet, so no band is shown.
What counts as a claim ›How we measure confidence ›How we check this ›
Are you an author, or do you see a problem with this page? Request a review
How to cite
Cite CoChat for the checks on this page, and the paper for its own findings.
- This page
- CoChat. (2026). Citation check: Tailoring a local acid-like microenvironment for efficient neutral hydrogen evolution. https://app.cochat.ai/papers/10.1038/s41467-023-39963-8
- The paper
- Zheng, X., Shi, X., Ning, H., Yang, R., Lu, B., Luo, Q., Mao, S., Xi, L., & Wang, Y. (2023). Tailoring a local acid-like microenvironment for efficient neutral hydrogen evolution. Nature Communications. https://doi.org/10.1038/s41467-023-39963-8
Data sources
Bibliographic data: Semantic Scholar, OpenAlex, Crossref.
Contains information from the Semantic Scholar Academic Graph Datasets, made available under the ODC Attribution License (ODC-BY 1.0).
Semantic Scholar’s data is described in: Kinney, R., et al. (2023). The Semantic Scholar Open Data Platform. arXiv:2301.10140.
