

The DOI matches its Crossref record; 33 of the 33 references it cites were found in a registry or an index.
Knowledge-enhanced visual-language pre-training on chest radiology images
Open accessAbstract
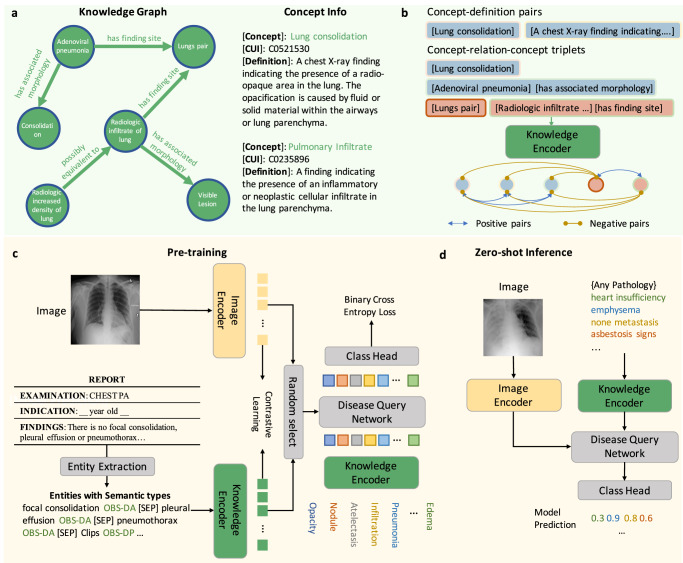
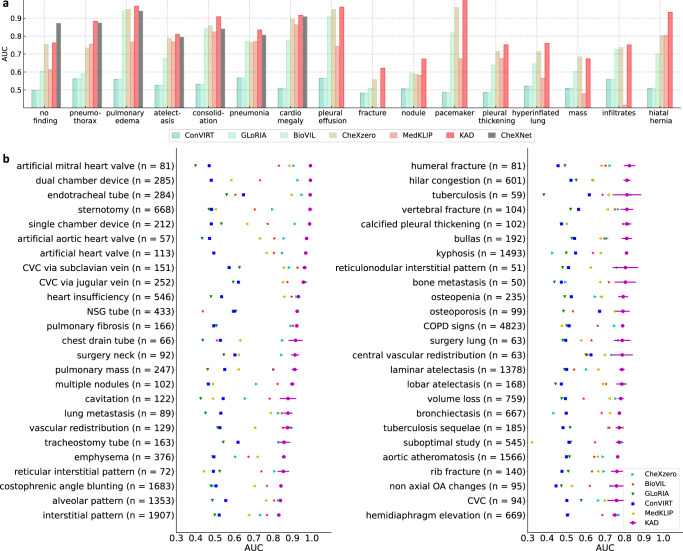
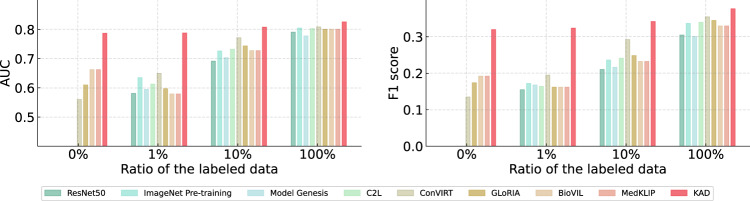
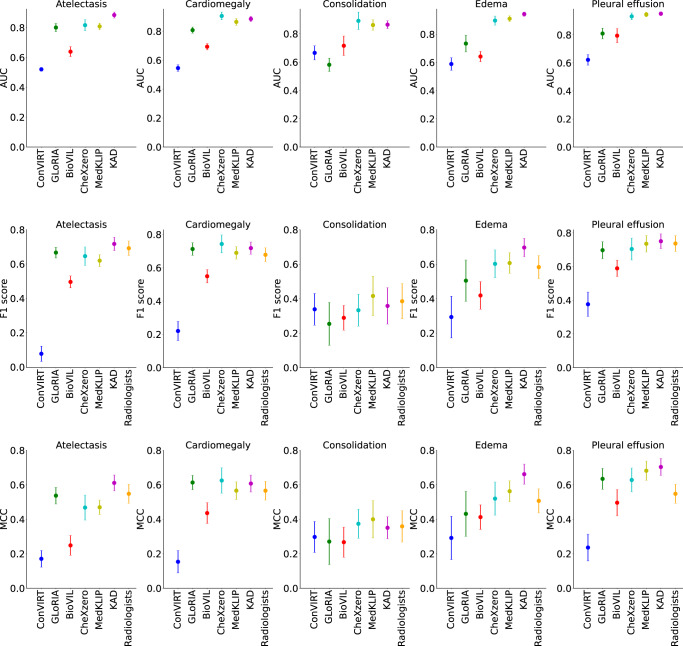
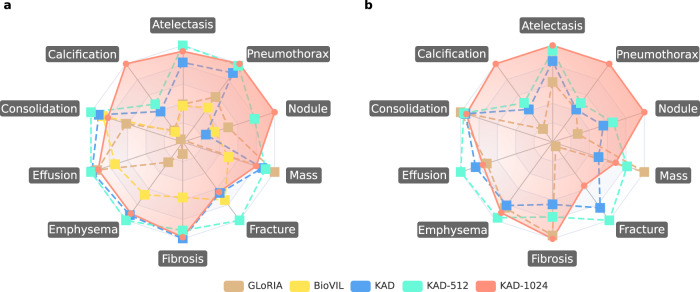
While multi-modal foundation models pre-trained on large-scale data have been successful in natural language understanding and vision recognition, their use in medical domains is still limited due to the fine-grained nature of medical tasks and the high demand for domain knowledge. To address this challenge, we propose an approach called Knowledge-enhanced Auto Diagnosis (KAD) which leverages existing medical domain knowledge to guide vision-language pre-training using paired chest X-rays and radiology reports. We evaluate KAD on four external X-ray datasets and demonstrate that its zero-shot performance is not only comparable to that of fully supervised models but also superior to the average of three expert radiologists for three (out of five) pathologies with statistical significance. Moreover, when few-shot annotation is available, KAD outperforms all existing approaches in fine-tuning settings, demonstrating its potential for application in different clinical scenarios.
Overview
The claims and statistics of this paper haven’t been checked yet.
Run the check — free, no account needed. It reads the open-access text and checks the sources it cites.
Integrity signals
Registry
Cites
Statistics
Figures
Verification
Claims the paper makes
The claims and statistics of this paper haven’t been checked yet.
Run the check — free, no account needed. It reads the open-access text and checks the sources it cites.
Claims other papers make about this one
Each is checked against this paper’s own text: does it say what the citing paper says it does?
The source backs part of the claim, not all of it — or backs it for a different population, condition or comparison.
In the citing paper
“By leveraging encoders pre-trained on large unimodal datasets and occasionally fine-tuning them on the available multimodal data, researchers can achieve robust performance despite the relative scarcity of multimodal data (Wang et al., 2023a; Zhang et al., 2023).”
From Navigating the landscape of multimodal AI in medicine: A scoping review on technical challenges and clinical applications (2025) · cites this paper as Zhang et al., 2023
Experimental — accuracy not yet measured
Self-check
Percentages, sums and reported differences re-computed from the paper’s own numbers.
The self-check needs the paper’s full text.
Citations
Cites
Deep Residual Learning for Image Recognition
He, K., Zhang, X., Ren, S., & Sun, J. (2016) · 2016 IEEE Conference on Computer Vision and Pattern Recognition (CVPR) · doi:10.1109/cvpr.2016.90 · Cited by 235,474
Self-citationVaswani, A., Shazeer, N., Parmar, N., Uszkoreit, J., Jones, L., Gomez, A. N., Kaiser, L., & Polosukhin, I. (2017) · arXiv · doi:10.48550/arxiv.1706.03762 · Cited by 120,404
ImageNet: A large-scale hierarchical image database
Deng, J., Dong, W., Socher, R., Li, L.-J., Li, K., & Fei-Fei, L. (2009) · 2009 IEEE Conference on Computer Vision and Pattern Recognition · doi:10.1109/cvpr.2009.5206848 · Cited by 65,333
An Image is Worth 16x16 Words: Transformers for Image Recognition at Scale
Dosovitskiy, A., Beyer, L., Kolesnikov, A., Weissenborn, D., Zhai, X., Unterthiner, T., Dehghani, M., Minderer, M., Heigold, G., Gelly, S., et al. (2020) · arXiv · doi:10.48550/arxiv.2010.11929 · Cited by 47,472
Language Models are Few-Shot Learners
Brown, T. B., Mann, B., Ryder, N., Subbiah, M., Kaplan, J., Dhariwal, P., Neelakantan, A., Shyam, P., Sastry, G., Askell, A., et al. (2020) · arXiv · doi:10.48550/arxiv.2005.14165 · Cited by 23,372
Learning Transferable Visual Models From Natural Language Supervision
Radford, A., Kim, J. W., Hallacy, C., Ramesh, A., Goh, G., Agarwal, S., Sastry, G., Askell, A., Mishkin, P., Clark, J., et al. (2021) · arXiv · doi:10.48550/arxiv.2103.00020 · Cited by 15,293
Wang, X., Peng, Y., Lu, L., Lu, Z., Bagheri, M., & Summers, R. M. (2017) · 2017 IEEE Conference on Computer Vision and Pattern Recognition (CVPR) · doi:10.1109/cvpr.2017.369 · Cited by 4,616
The unified medical language system (UMLS): integrating biomedical terminology
Bodenreider, O. (2004) · Nucleic Acids Research · doi:10.1093/nar/gkh061 · Cited by 4,356
CheXNet: Radiologist-Level Pneumonia Detection on Chest X-Rays with Deep LearningPreprint
Rajpurkar, P., Irvin, J., Zhu, K., Yang, B., Mehta, H., Duan, T., Ding, D. Y., Bagul, A., Langlotz, C. P., Shpanskaya, K. S., et al. (2017) · arXiv (Cornell University) · doi:10.48550/arxiv.1711.05225 · Cited by 4,226
On the Opportunities and Risks of Foundation Models
Bommasani, R., Hudson, D. A., Adeli, E., Altman, R., Arora, S., von Arx, S., Bernstein, M. S., Bohg, J., Bosselut, A., Brunskill, E., et al. (2021) · arXiv · doi:10.48550/arxiv.2108.07258 · Cited by 2,676
Self-citationDomain-specific language model pretraining for biomedical natural language processing
Gu, Y., Tinn, R., Cheng, H., Lucas, M., Usuyama, N., Liu, X., Naumann, T., Gao, J., & Poon, H. (2022) · ACM Transactions on Computing for Healthcare · doi:10.1145/3458754 · Cited by 2,170
MIMIC-CXR, a de-identified publicly available database of chest radiographs with free-text reports
Johnson, A. E. W., Pollard, T. J., Berkowitz, S. J., Greenbaum, N. R., Lungren, M. P., Deng, C.-Y., Mark, R. G., & Horng, S. (2019) · Scientific Data · doi:10.1038/s41597-019-0322-0 · Cited by 1,816
Flamingo: a Visual Language Model for Few-Shot Learning
Alayrac, J.-B., Donahue, J., Luc, P., Miech, A., Barr, I., Hasson, Y., Lenc, K., Mensch, A., Millican, K., Reynolds, M., et al. (2022) · arXiv · doi:10.48550/arxiv.2204.14198 · Cited by 1,555
ScispaCy: Fast and Robust Models for Biomedical Natural Language Processing
Neumann, M., King, D., Beltagy, I., & Ammar, W. (2019) · BioNLP Workshop and Shared Task (BioNLP) · doi:10.18653/v1/w19-5034 · Cited by 929
Top-Down Neural Attention by Excitation Backprop
Zhang, J., Bargal, S. A., Lin, Z., Brandt, J., Shen, X., & Sclaroff, S. (2017) · International Journal of Computer Vision · doi:10.1007/s11263-017-1059-x · Cited by 815
PadChest: A large chest x-ray image dataset with multi-label annotated reports
Bustos, A., Pertusa, A., Salinas, J.-M., & de la Iglesia-Vayá, M. (2020) · Medical Image Analysis · doi:10.1016/j.media.2020.101797 · Cited by 691
SNOMED-CT: The advanced terminology and coding system for eHealth.
Donnelly, K. (2006) · PubMed · Cited by 541
Dale, R. (2020) · Natural Language Engineering · doi:10.1017/s1351324920000601 · Cited by 509
Huang, S.-C., Shen, L., Lungren, M. P., & Yeung, S. (2021) · 2021 IEEE/CVF International Conference on Computer Vision (ICCV) · doi:10.1109/iccv48922.2021.00391 · Cited by 489
Tiu, E., Talius, E., Patel, P., Langlotz, C. P., Ng, A. Y., & Rajpurkar, P. (2022) · Nature Biomedical Engineering · doi:10.1038/s41551-022-00936-9 · Cited by 442
CheXpert: A Large Chest Radiograph Dataset with Uncertainty Labels and Expert Comparison
Irvin, J., Rajpurkar, P., Ko, M., Yu, Y., Ciurea-Ilcus, S., Chute, C., Marklund, H., Haghgoo, B., Ball, R., Shpanskaya, K., et al. (2019) · Proceedings of the AAAI Conference on Artificial Intelligence · doi:10.1609/aaai.v33i01.3301590 · Cited by 392
How Much Can CLIP Benefit Vision-and-Language Tasks?Preprint
Shen, S., Li, L. H., Tan, H. X., Bansal, M., Rohrbach, A., Chang, K.-W., Yao, Z., & Keutzer, K. (2021) · arXiv (Cornell University) · doi:10.48550/arxiv.2107.06383 · Cited by 382
Zhou, Z., Sodha, V., Pang, J., Gotway, M. B., & Liang, J. (2020) · Medical Image Analysis · doi:10.1016/j.media.2020.101840 · Cited by 375
Making the Most of Text Semantics to Improve Biomedical Vision-Language Processing
Boecking, B., Usuyama, N., Bannur, S., Castro, D. C., Schwaighofer, A., Hyland, S., Wetscherek, M., Naumann, T., Nori, A., Alvarez-Valle, J., et al. (2022) · Lecture Notes in Computer Science · doi:10.1007/978-3-031-20059-5_1 · Cited by 317 · cited 11×
“Specifically, ConVIRT [64] simply uses chest X-rays and the associated raw report for self-supervised training; GLoRIA [25] learns global and localized representations by contrasting attention-weighted image sub-regions and words in the reports; BioVIL [6] introduces a pre-trained radiology-specific text encoder CXR-B…”
BackgroundMethodInfluentialZhou, H.-Y., Chen, X., Zhang, Y., Luo, R., Wang, L., & Yu, Y. (2022) · Nature Machine Intelligence · doi:10.1038/s42256-021-00425-9 · Cited by 126
Self-citationZhou, H.-Y., Yu, S., Bian, C., Hu, Y., Ma, K., & Zheng, Y. (2020) · Lecture notes in computer science · doi:10.1007/978-3-030-59710-8_39 · Cited by 106
Align, Reason and Learn: Enhancing Medical Vision-and-Language Pre-training with Knowledge
Chen, Z., Li, G., & Wan, X. (2022) · ACM International Conference on Multimedia (ACM MM) · doi:10.1145/3503161.3547948 · Cited by 92
MedKLIP: Medical Knowledge Enhanced Language-Image Pre-TrainingPreprint
Wu, C., Zhang, X., Zhang, Y., Wang, Y., & Xie, W. (2023) · medRxiv · doi:10.1101/2023.01.10.23284412 · Cited by 80
Self-citationRadGraph: Extracting Clinical Entities and Relations from Radiology ReportsPreprint
Jain, S., Agrawal, A., Saporta, A., Truong, S. Q., Nguyen Duong, D., Bui, T., Chambon, P., Lungren, M. P., Ng, A. Y., Langlotz, C. P., et al. (2021) · arXiv (Cornell University) · doi:10.13026/2f5n-pb92 · Cited by 42
RadGraph: Extracting Clinical Entities and Relations from Radiology Reports
Jain, S., Agrawal, A., Saporta, A., Truong, S. Q., Nguyen Duong, D., Bui, T., Chambon, P., Lungren, M., Ng, A., Langlotz, C., et al. (2021) · PhysioNet · doi:10.13026/hm87-5p47 · Cited by 34
Joint Learning of Localized Representations from Medical Images and Reports
Müller, P., Kaissis, G. A., Zou, C., & Rückert, D. (2022) · Lecture notes in computer science · doi:10.1007/978-3-031-19809-0_39 · Cited by 30
Rajpurkar, P., Joshi, A., Pareek, A., Ng, A. Y., & Lungren, M. P. (2021) · ACM Conference on Health, Inference, and Learning (CHIL) · doi:10.1145/3450439.3451876 · Cited by 19
ChestX-Det10: Chest X-ray Dataset on Detection of Thoracic AbnormalitiesPreprint
Liu, J., Lian, J., & Yu, Y. (2020) · arXiv (Cornell University) · doi:10.48550/arxiv.2006.10550 · Cited by 14
Research works printed but not linked: 4
- Devlin, J., Chang, M.-W., Lee, K. & Toutanova, K. Bert: Pre-training of deep bidirectional transformers for language understanding. In Proc. 2019 Conference of the North American Chapter of the Association for Computational Linguistics: Human Language Technologies, 4171–4186 (ACL, 2019).
- Ma, C., Yang, Y., Wang, Y., Zhang, Y. & Xie, W. Open-vocabulary semantic segmentation with frozen vision-language models. British Machine Vision Conference (2022).
- Zhang, Y., Jiang, H., Miura, Y., Manning, C. D. & Langlotz, C. P. Contrastive learning of medical visual representations from paired images and text. PMLR 182, 2–25. Highest Starred Implementation: https://github.com/edreisMD/ConVIRT-pytorch (2022).
- Loshchilov, I. & Hutter, F. Decoupled weight decay regularization. In Proc. International Conference on Learning Representations (2019).
Cited by
Sorted by citations
A generalist medical language model for disease diagnosis assistance
Liu, X., Liu, H., Yang, G., Jiang, Z., Cui, S., Zhang, Z., Wang, H., Tao, L., Sun, Y., Song, Z., et al. (2025) · Nature Medicine · doi:10.1038/s41591-024-03416-6 · Cited by 183
Towards generalist foundation model for radiology by leveraging web-scale 2D&3D medical data
Wu, C., Zhang, X., Zhang, Y., Hui, H., Wang, Y., & Xie, W. (2025) · Nature Communications · doi:10.1038/s41467-025-62385-7 · Cited by 429
Self-citationHe, K., Mao, R., Lin, Q., Ruan, Y., Lan, X., Feng, M., & Cambria, E. (2025) · Information Fusion · doi:10.1016/j.inffus.2025.102963 · Cited by 147
Large language models for disease diagnosis: a scoping review
Zhou, S., Xu, Z., Zhang, M., Xu, C., Guo, Y., Zhan, Z., Fang, Y., Ding, S., Wang, J., Xu, K., et al. (2025) · npj Artificial Intelligence · doi:10.1038/s44387-025-00011-z · Cited by 188
CLIP in medical imaging: A survey
Zhao, Z., Liu, Y., Wu, H., Wang, M., Li, Y., Wang, S., Teng, L., Liu, D., Cui, Z., Wang, Q., et al. (2025) · Medical Image Analysis · doi:10.1016/j.media.2025.103551 · Cited by 248
Metadata
- Authors
- Zhang, X., Wu, C., Zhang, Y., Xie, W., & Wang, Y.
- Affiliations
- Shanghai Jiao Tong University (CN)
- Corresponding author
- Xie, Weidi
- Wang, Yanfeng
- Venue
- Nature Communications
- Published
- 2023-07-28
- Volume
- 14
- Issue
- 1
- Pages
- 4542-4542
- ISSN
- 2041-1723 (ISSN-L)
- PMC
- PMC10382552
- OpenAlex
- W4385347692
- Cited by
- 207
- References
- 30
- Citations by year
- 2026: 54 · 2025: 104 · 2024: 47 · 2023: 2
- FWCI
- 18.75
- Type
- journal article
- Language
- en
- Open access
- gold
- doi.org
- Locations
- Nature Communications (publishedVersion, cc-by)
- PubMed Central (publishedVersion, cc-by)
- PubMed (publishedVersion)
- arXiv (Cornell University) (submittedVersion)
- RePEc: Research Papers in Economics (submittedVersion)
- DOAJ (DOAJ: Directory of Open Access Journals) (submittedVersion, cc-by-sa)
- arXiv (Cornell University)
- Funders
- Science and Technology Commission of Shanghai Municipality (21DZ1100100, 22511106101, BP0719010, 18DZ2270700)
- Topics
- Physical Sciences › Computer Science › Computer Vision and Pattern Recognition › Multimodal Machine Learning Applications
- Health Sciences › Medicine › Health Informatics › Artificial Intelligence in Healthcare and Education
- Health Sciences › Medicine › Radiology, Nuclear Medicine and Imaging › COVID-19 diagnosis using AI
- Keywords
- vision-language pre-training, chest radiography, radiology reports, medical foundation models, few-shot fine-tuning
- MeSH terms
- Radiologists, Humans, Language, Radiography, Radiology, Knowledge
About these checks
Registry, retraction, Cites and statistics results are computed, not judged, with one exception: a printed reference that no index lists is read once by a model before it counts as a citation error. Claims are extracted by a model and kept only when their quote appears verbatim in the text; each cited source is then checked, with a model’s help, for whether it says what the claim relies on. Those verdicts can be wrong — read the claim’s quote and the cited source before relying on one.
Statistics and arithmetic are recomputed, not judged.
Confidence bands are shown only for fields calibrated on our annotated test set. None is calibrated yet, so no band is shown.
What counts as a claim ›How we measure confidence ›How we check this ›
Are you an author, or do you see a problem with this page? Request a review
