Student or educator? Sign up with your school email and get 6 months of Pro free.
Cited by 23Plant Molecular Biology ResearchCellular transport and secretionProtein Kinase Regulation and GTPase Signaling

The DOI matches its Crossref record; 66 of the 66 references it cites were found in a registry or an index.

Two subtypes of GTPase-activating proteins coordinate tip growth and cell size regulation in Physcomitrium patens

Open access
Ruan, Jingtong, Lai, Linyu, Ou, Hongxin, Yi, Peishan·2023·Nature Communications

Published version of a preprint

Abstract

The establishment of cell polarity is a prerequisite for many developmental processes. However, how it is achieved during tip growth in plants remains elusive. Here, we show that the RHO OF PLANTs (ROPs), ROP GUANINE NUCLEOTIDE EXCHANGE FACTORs (RopGEFs), and ROP GTPASE-ACTIVATING PROTEINs (RopGAPs) assemble into membrane domains in tip-growing cells of the moss Physcomitrium patens. The confinement of membrane domains requires redundant global inactivation of ROPs by PpRopGAPs and the PLECKSTRIN HOMOLOGY (PH) domain-containing RenGAP PpREN. Unexpectedly, PpRopGAPs and PpREN exert opposing effects on domain size and cell width upon overexpression. Biochemical and functional analyses indicate that PpRopGAPs are recruited to the membrane by active ROPs to restrict domain size through clustering, whereas PpREN rapidly inactivates ROPs and inhibits PpRopGAP-induced clustering. We propose that the activity- and clustering-based domain organization by RopGAPs and RenGAPs is a general mechanism for coordinating polarized cell growth and cell size regulation in plants.

Overview

The claims and statistics of this paper haven’t been checked yet.

Run the check — free, no account needed. It reads the open-access text and checks the sources it cites.

A few free checks a day · papers already verified open instantly · results are public

Integrity signals

Registry

Crossref · 10.1038/s41467-023-42879-y

Cites

66 of 66 references verified0 citation errors · 0 not checkable

Statistics

Figures

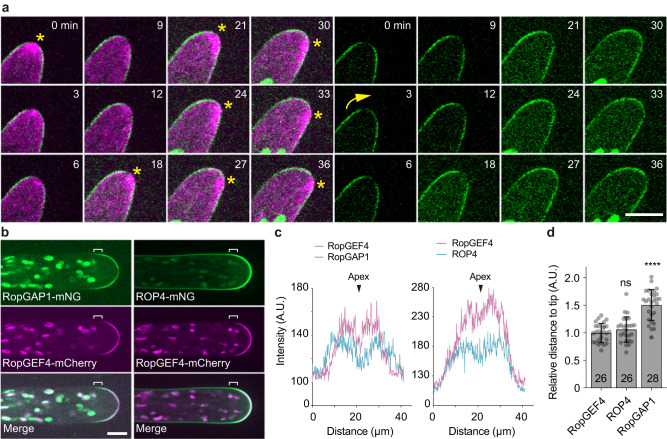
Fig. 1 The endogenous PpRopGAP1 is enriched at the tip of caulonema cells and delimitates the dome region marked by PpROP4 and PpRopGEF4. a Time-lapse images of PpRopGAP1 fused with the bright green fluorescent protein mNeonGreen (mNG, green) and actin labeled with Lifeact-mCherry (magenta). Note that PpRopGAP1 (green) exhibits a low-intensity area at the apex near the cytoplasmic actin foci (star) and reorients its position (arrow) when the growth direction changes. b Colocalization of PpRopGAP1, PpRopGEF4, and PpROP4 in tip cells. The endogenous PpRopGEF4 and PpROP4 are fused with a C-terminal mCherry and an internal mNG, respectively. PpRopGEF4 is exclusively localized at the apical dome. PpROP4 is enriched around the same place but also weakly labels other membrane regions. PpRopGAP1 occupies a broader area than PpRopGEF4 toward the base. The flanking regions of the PpRopGEF4 signal are indicated with white brackets. c Intensity plots of PpRopGAP1, PpRopGEF4, and PpROP4 along the apical membrane. Note that PpRopGEF4 and PpROP4 also exhibit a low-intensity area at the apex. Scale bars:10 µm in all panels. d Quantification of the relative distance of enriched PpROP4 and PpRopGAP1 signals to the cell tip compared with PpRopGEF4. The number of cells for quantification is shown on the bars. Data are presented as mean values ± SD with individual points shown. Statistical analyses were performed using adjusted one-way ANOVA tests. ns, not significant. ****p < 0.0001. The exact p-values are available in Source Data. Source data are provided as a Source Data file.
Fig. 1 The endogenous PpRopGAP1 is enriched at the tip of caulonema cells and delimitates the dome region marked by PpROP4 and PpRopGEF4. a Time-lapse images of PpRopGAP1 fused with the bright green fluorescent protein mNeonGreen (mNG, green) and actin labeled with Lifeact-mCherry (magenta). Note that PpRopGAP1 (green) exhibits a low-intensity area at the apex near the cytoplasmic actin foci (star) and reorients its position (arrow) when the growth direction changes. b Colocalization of PpRopGAP1, PpRopGEF4, and PpROP4 in tip cells. The endogenous PpRopGEF4 and PpROP4 are fused with a C-terminal mCherry and an internal mNG, respectively. PpRopGEF4 is exclusively localized at the apical dome. PpROP4 is enriched around the same place but also weakly labels other membrane regions. PpRopGAP1 occupies a broader area than PpRopGEF4 toward the base. The flanking regions of the PpRopGEF4 signal are indicated with white brackets. c Intensity plots of PpRopGAP1, PpRopGEF4, and PpROP4 along the apical membrane. Note that PpRopGEF4 and PpROP4 also exhibit a low-intensity area at the apex. Scale bars:10 µm in all panels. d Quantification of the relative distance of enriched PpROP4 and PpRopGAP1 signals to the cell tip compared with PpRopGEF4. The number of cells for quantification is shown on the bars. Data are presented as mean values ± SD with individual points shown. Statistical analyses were performed using adjusted one-way ANOVA tests. ns, not significant. ****p < 0.0001. The exact p-values are available in Source Data. Source data are provided as a Source Data file.CC BY · PubMed Central
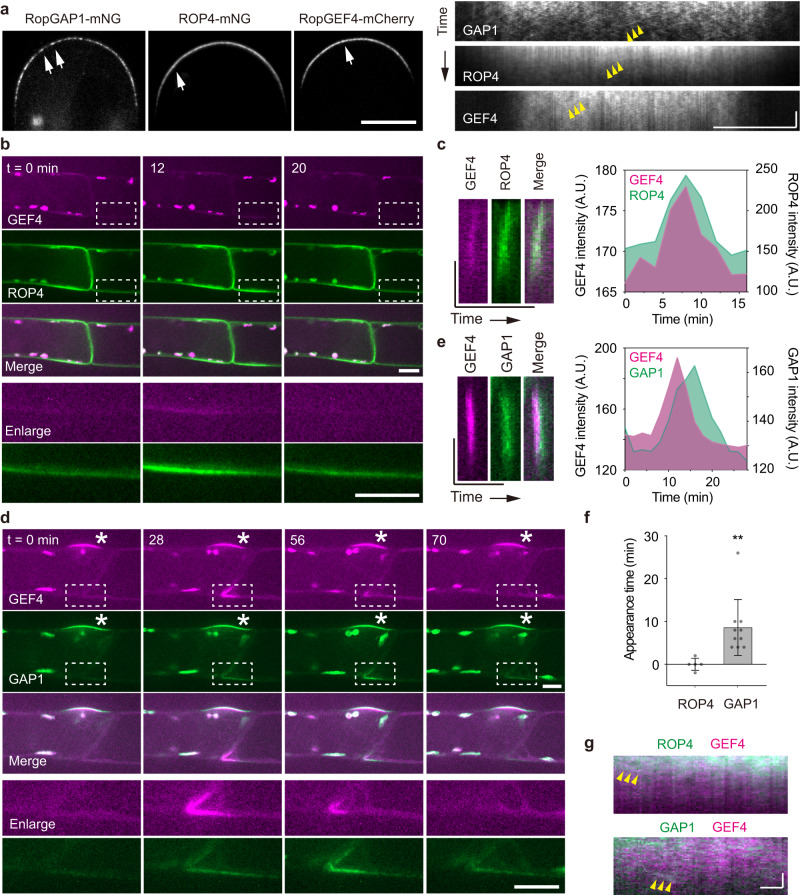
Fig. 2 PpROP4, PpRopGEF4, and PpRopGAP1 are sequentially recruited into membrane domains. a PpRopGAP1, PpROP4, and PpRopGEF4 are present in mobile particles (white arrows) on the apical membrane. Yellow arrowheads indicate the movement of representative particles. Note that PpRopGAP1 particles are more visible. Scale bars: horizontal, 10 µm; vertical, 10 s. b Transient clustering of PpROP4 and PpRopGEF4. PpROP4 is enriched at the lateral surfaces of subapical cells (left) before branching. A transient accumulation (dashed rectangles, enlarged at the bottom panel) occurs at the basal membrane of the tip cell. Scale bar: 10 µm. c Kymographs showing PpROP4 and PpRopGEF4 recruitment at the transient membrane domain. Averaged intensities of PpROP4 and PpRopGEF4 in kymographs over time are plotted. Scale bars: vertical, 10 µm; horizontal, 1 h. d Transient clustering of PpRopGAP1 and PpRopGEF4. PpRopGAP1 and PpRopGEF4 are localized at the branch initiation site of subapical cells (stars). A transient accumulation (dashed rectangles, enlarged at the bottom panel) occurs at the basal membrane of the tip cell. Scale bar: 10 µm. e Kymographs showing PpRopGAP1 and PpRopGEF4 recruitment at the transient membrane domain. Note that PpRopGEF4 appears earlier than PpRopGAP1. Scale bars: vertical, 10 µm; horizontal, 1 h. f Quantification of PpROP4 (n = 5) and PpRopGAP1 (n = 10) appearance time relative to PpRopGEF4. Data are presented as mean values ± SD with individual points shown. Statistical analysis was performed using a two-tailed student’s t-test. **p < 0.01. The exact p-values are available in Source Data. g Colocalization of PpROP4 and PpRopGAP1 with PpRopGEF4 in mobile particles. Two representative particles are indicated by arrowheads in the kymographs. Scale bars: horizontal, 1 µm; vertical 10 s. Similar results in (a, b, d) were obtained in at least three independent experiments. Source data are provided as a Source Data file.
Fig. 2 PpROP4, PpRopGEF4, and PpRopGAP1 are sequentially recruited into membrane domains. a PpRopGAP1, PpROP4, and PpRopGEF4 are present in mobile particles (white arrows) on the apical membrane. Yellow arrowheads indicate the movement of representative particles. Note that PpRopGAP1 particles are more visible. Scale bars: horizontal, 10 µm; vertical, 10 s. b Transient clustering of PpROP4 and PpRopGEF4. PpROP4 is enriched at the lateral surfaces of subapical cells (left) before branching. A transient accumulation (dashed rectangles, enlarged at the bottom panel) occurs at the basal membrane of the tip cell. Scale bar: 10 µm. c Kymographs showing PpROP4 and PpRopGEF4 recruitment at the transient membrane domain. Averaged intensities of PpROP4 and PpRopGEF4 in kymographs over time are plotted. Scale bars: vertical, 10 µm; horizontal, 1 h. d Transient clustering of PpRopGAP1 and PpRopGEF4. PpRopGAP1 and PpRopGEF4 are localized at the branch initiation site of subapical cells (stars). A transient accumulation (dashed rectangles, enlarged at the bottom panel) occurs at the basal membrane of the tip cell. Scale bar: 10 µm. e Kymographs showing PpRopGAP1 and PpRopGEF4 recruitment at the transient membrane domain. Note that PpRopGEF4 appears earlier than PpRopGAP1. Scale bars: vertical, 10 µm; horizontal, 1 h. f Quantification of PpROP4 (n = 5) and PpRopGAP1 (n = 10) appearance time relative to PpRopGEF4. Data are presented as mean values ± SD with individual points shown. Statistical analysis was performed using a two-tailed student’s t-test. **p < 0.01. The exact p-values are available in Source Data. g Colocalization of PpROP4 and PpRopGAP1 with PpRopGEF4 in mobile particles. Two representative particles are indicated by arrowheads in the kymographs. Scale bars: horizontal, 1 µm; vertical 10 s. Similar results in (a, b, d) were obtained in at least three independent experiments. Source data are provided as a Source Data file.CC BY · PubMed Central
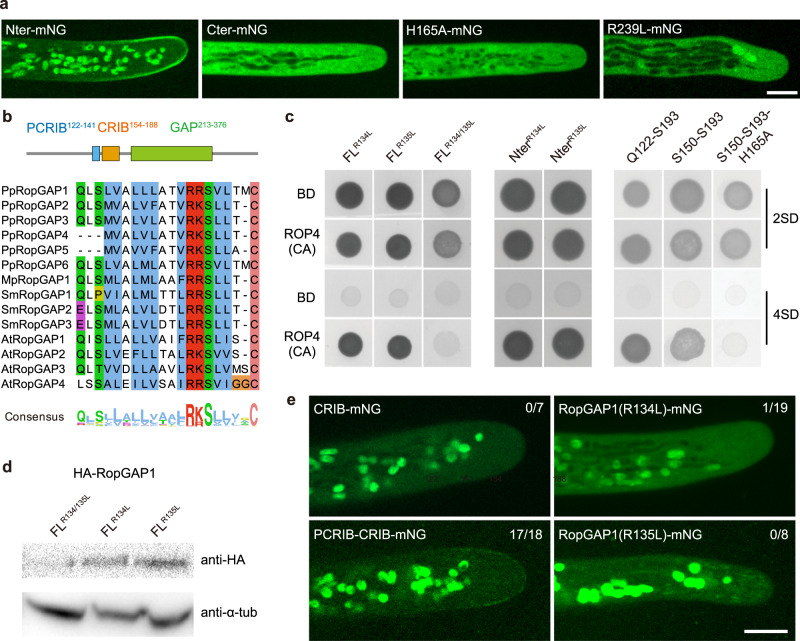
Fig. 3 The membrane recruitment of PpRopGAP1 requires its CRIB motif, GAP activity, and a pre-CRIB motif. a Localization of the CRIB domain-containing N-terminal portion (Nter, 1-193), the GAP domain-containing C-terminal portion (Cter, 194-469), and full-length PpRopGAP1 carrying a histidine-to-alanine (H165A) or an arginine-to-leucine (R239L). Scale bar: 10 µm. b The conserved pre-CRIB (PCRIB) motif identified in RopGAPs. The consensus sequence is generated from 1 063 RopGAPs. Pp, Physcomitrium patens; Mp, Marchantia polymorpha; Sm, Selaginella moellendorffii; At, Arabidopsis thaliana. The PCRIB motif is not present in AtRopGAP5. c The PCRIB motif facilitates the interaction between the full-length (FL) PpRopGAP1 and constitutively active PpROP4 (ROP4CA) in yeast-two-hybrid assays. Mutating two conserved residues (R134L and R135L) blocks PpRopGAP1-PpROP4CA interaction. Note that the absence of the PCRIB motif weakens but does not abolish the binding between PpROP4CA and the Nter portion of PpRopGAP1. d PpRopGAP1(R134/135L) exhibits reduced protein stability. The PpRopGAP1 tagged with hemagglutinin (HA) was detected by western blotting. Tubulin was blotted as a loading control. e Localization of the CRIB motif (S150-S193), the PCRIB plus CRIB motif (Q122-S193), and PpRopGAP1 carrying the R134L or R135L mutation. Note that only the PCRIB plus CRIB motif exhibits a polar membrane localization, albeit its expression level is relatively low. The number of cells with a membrane localization pattern is shown. Scale bar: 10 µm. Similar results in (a, d, e) were obtained in at least three independent experiments. Source data are provided as a Source Data file.
Fig. 3 The membrane recruitment of PpRopGAP1 requires its CRIB motif, GAP activity, and a pre-CRIB motif. a Localization of the CRIB domain-containing N-terminal portion (Nter, 1-193), the GAP domain-containing C-terminal portion (Cter, 194-469), and full-length PpRopGAP1 carrying a histidine-to-alanine (H165A) or an arginine-to-leucine (R239L). Scale bar: 10 µm. b The conserved pre-CRIB (PCRIB) motif identified in RopGAPs. The consensus sequence is generated from 1 063 RopGAPs. Pp, Physcomitrium patens; Mp, Marchantia polymorpha; Sm, Selaginella moellendorffii; At, Arabidopsis thaliana. The PCRIB motif is not present in AtRopGAP5. c The PCRIB motif facilitates the interaction between the full-length (FL) PpRopGAP1 and constitutively active PpROP4 (ROP4CA) in yeast-two-hybrid assays. Mutating two conserved residues (R134L and R135L) blocks PpRopGAP1-PpROP4CA interaction. Note that the absence of the PCRIB motif weakens but does not abolish the binding between PpROP4CA and the Nter portion of PpRopGAP1. d PpRopGAP1(R134/135L) exhibits reduced protein stability. The PpRopGAP1 tagged with hemagglutinin (HA) was detected by western blotting. Tubulin was blotted as a loading control. e Localization of the CRIB motif (S150-S193), the PCRIB plus CRIB motif (Q122-S193), and PpRopGAP1 carrying the R134L or R135L mutation. Note that only the PCRIB plus CRIB motif exhibits a polar membrane localization, albeit its expression level is relatively low. The number of cells with a membrane localization pattern is shown. Scale bar: 10 µm. Similar results in (a, d, e) were obtained in at least three independent experiments. Source data are provided as a Source Data file.CC BY · PubMed Central
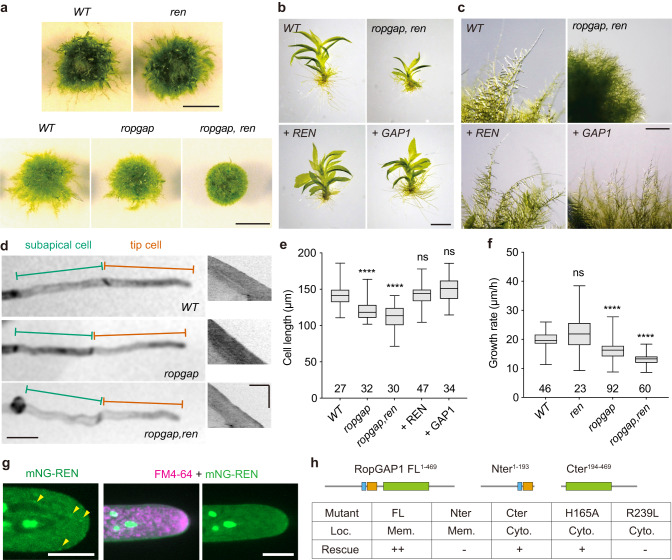
Fig. 4 PpRopGAPs and PpREN redundantly regulate tip growth and development. a Colony growth of wild-type (WT) and mutant mosses. Scale bars: 0.5 cm. b Gametophores of WT, mutant, and rescued mosses. Cerulean-fusion PpREN or PpRopGAP1 (simplified as + REN and + GAP1) were expressed for rescue in the ropgap, ren septuple mutant background. Scar bar: 1 mm. c Cell morphology and growth of WT, mutant, and rescued mosses. Scale bar: 1 mm. d Tip cell growth in WT and mutant mosses. Representative kymographs of growing tip cells are shown (right). Note that cells in the ropgap, ren mutant are wavy. Scale bars: horizontal, 50 µm; vertical, 5 h. e Quantification of cell length in WT, mutant, and rescued mosses. f Quantification of growth rate in WT and mutant tip cells. g Localization of PpREN in the cytoplasm. Note that PpREN occasionally forms puncta-like structures but does not exhibit obvious enrichment or colocalization with FM4-64-labeled vesicles at the tip. Scale bars: 10 µm. h Summary of localization and rescue capability of full-length (FL) and mutant forms of PpRopGAP1. Note that PpRopGAP1 can partially rescue cell growth phenotypes in the absence of the Nter portion or a fully functional CRIB domain. The rescue capability was categorized as either complete (++), partial (+), or absent (−) when mosses exhibited fully, partially, or no elongated caulonema cells on BCDAT plates, respectively. Protein localization was determined by assessing the relative intensity on the membrane (Mem.) and in the cytosol (Cyto.). If the membrane signals were visually stronger than the cytosolic fluorescence, they were classified as membrane localization. Data are presented as box-and-whisker plots, showing the interquartile range (box), the median (horizontal line), and minimum and maximum values (whiskers) in (e, f). The number of cells used for quantification in (e, f) is shown at the bottom. Statistical analyses were performed using one-way ANOVA tests. ns, not significant. ****p < 0.0001. The exact p-values are available in Source Data. Similar results in (g) were obtained in three independent experiments. Source data are provided as a Source Data file.
Fig. 4 PpRopGAPs and PpREN redundantly regulate tip growth and development. a Colony growth of wild-type (WT) and mutant mosses. Scale bars: 0.5 cm. b Gametophores of WT, mutant, and rescued mosses. Cerulean-fusion PpREN or PpRopGAP1 (simplified as + REN and + GAP1) were expressed for rescue in the ropgap, ren septuple mutant background. Scar bar: 1 mm. c Cell morphology and growth of WT, mutant, and rescued mosses. Scale bar: 1 mm. d Tip cell growth in WT and mutant mosses. Representative kymographs of growing tip cells are shown (right). Note that cells in the ropgap, ren mutant are wavy. Scale bars: horizontal, 50 µm; vertical, 5 h. e Quantification of cell length in WT, mutant, and rescued mosses. f Quantification of growth rate in WT and mutant tip cells. g Localization of PpREN in the cytoplasm. Note that PpREN occasionally forms puncta-like structures but does not exhibit obvious enrichment or colocalization with FM4-64-labeled vesicles at the tip. Scale bars: 10 µm. h Summary of localization and rescue capability of full-length (FL) and mutant forms of PpRopGAP1. Note that PpRopGAP1 can partially rescue cell growth phenotypes in the absence of the Nter portion or a fully functional CRIB domain. The rescue capability was categorized as either complete (++), partial (+), or absent (−) when mosses exhibited fully, partially, or no elongated caulonema cells on BCDAT plates, respectively. Protein localization was determined by assessing the relative intensity on the membrane (Mem.) and in the cytosol (Cyto.). If the membrane signals were visually stronger than the cytosolic fluorescence, they were classified as membrane localization. Data are presented as box-and-whisker plots, showing the interquartile range (box), the median (horizontal line), and minimum and maximum values (whiskers) in (e, f). The number of cells used for quantification in (e, f) is shown at the bottom. Statistical analyses were performed using one-way ANOVA tests. ns, not significant. ****p < 0.0001. The exact p-values are available in Source Data. Similar results in (g) were obtained in three independent experiments. Source data are provided as a Source Data file.CC BY · PubMed Central
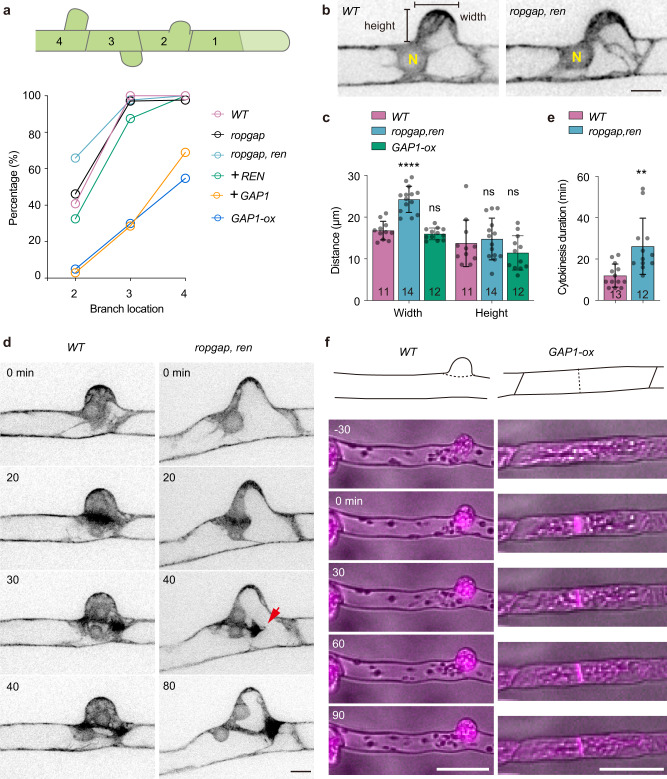
Fig. 5 PpRopGAPs and PpREN inhibit branch initiation. a Percentages of subapical cells that have developed side-branches in WT, mutant, and rescued mosses. Subapical cells are numbered according to their relative position to the tip cell. The number of cells used for quantification ranges between 12 and 80. Note that early formation of branches on the second subapical cells occurs in ropgap, ren mutants which could be rescued by PpREN. PpRopGAP1 overexpression not only inhibits premature branching but also strongly blocks branch formation in ropgap, ren mutants and WT cells. b Morphology of the bulges in WT and mutant subapical cells. N, nucleus. Scale bar: 10 µm. c Quantification of bulge width and height. d Mitotic division of WT and mutant subapical cells. Cells are visualized with Lifeact-mCherry. The phragmoplast leading edge is indicated (red arrow). Scale bar: 10 µm. e Quantification of phragmoplast expansion time. f Representative subapical cell divisions in the WT and PpRopGAP1 overexpression lines. Cells are labeled by Lifeact-mCherry and imaged with epifluorescence and bright light. Scale bars: 50 µm. Data are presented as mean values ± SD with individual points shown in (c, e). The number of cells used for quantification is shown at the bottom. Mutant or overexpression lines were statistically compared with WT using two-tailed student’s t-tests. ns, not significant. ****p < 0.0001. **p < 0.01. The exact p-values are available in Source Data. Similar results in (f) were obtained in three independent experiments. Source data are provided as a Source Data file.
Fig. 5 PpRopGAPs and PpREN inhibit branch initiation. a Percentages of subapical cells that have developed side-branches in WT, mutant, and rescued mosses. Subapical cells are numbered according to their relative position to the tip cell. The number of cells used for quantification ranges between 12 and 80. Note that early formation of branches on the second subapical cells occurs in ropgap, ren mutants which could be rescued by PpREN. PpRopGAP1 overexpression not only inhibits premature branching but also strongly blocks branch formation in ropgap, ren mutants and WT cells. b Morphology of the bulges in WT and mutant subapical cells. N, nucleus. Scale bar: 10 µm. c Quantification of bulge width and height. d Mitotic division of WT and mutant subapical cells. Cells are visualized with Lifeact-mCherry. The phragmoplast leading edge is indicated (red arrow). Scale bar: 10 µm. e Quantification of phragmoplast expansion time. f Representative subapical cell divisions in the WT and PpRopGAP1 overexpression lines. Cells are labeled by Lifeact-mCherry and imaged with epifluorescence and bright light. Scale bars: 50 µm. Data are presented as mean values ± SD with individual points shown in (c, e). The number of cells used for quantification is shown at the bottom. Mutant or overexpression lines were statistically compared with WT using two-tailed student’s t-tests. ns, not significant. ****p < 0.0001. **p < 0.01. The exact p-values are available in Source Data. Similar results in (f) were obtained in three independent experiments. Source data are provided as a Source Data file.CC BY · PubMed Central
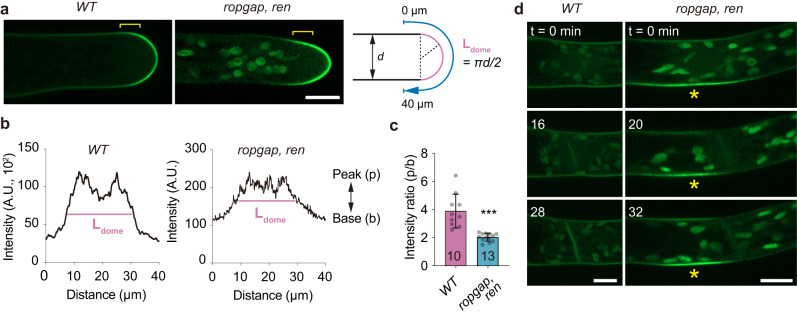
Fig. 6 PpROP4 localization is altered in ropgap, ren mutants. a Localization of PpROP4-mNG in WT and ropgap, ren mutant tip cells. Note that the boundary (brackets) between the apical dome and subapical membrane is less obvious in mutant cells. Scale bar: 10 µm. b Representative intensity plots of PpROP4 along the apical membrane. Intensities were measured along the blue lines shown in (a). The dome region is marked by pink lines. c Quantification of the intensity ratio of peak and base in the plots. The number of cells used for quantification is shown at the bottom. Data are presented as mean values ± SD with individual points shown. The comparison was performed using a two-tailed student’s t-test. ***p < 0.001. The exact p-values are available in Source Data. d Early accumulation of PpROP4 at branching sites in subapical cells (indicated by stars) of ropgap, ren mutants. Images were taken starting from the nuclear envelope breakdown. Scale bar: 10 µm. Similar results in (d) were obtained in three independent experiments. Source data are provided as a Source Data file.
Fig. 6 PpROP4 localization is altered in ropgap, ren mutants. a Localization of PpROP4-mNG in WT and ropgap, ren mutant tip cells. Note that the boundary (brackets) between the apical dome and subapical membrane is less obvious in mutant cells. Scale bar: 10 µm. b Representative intensity plots of PpROP4 along the apical membrane. Intensities were measured along the blue lines shown in (a). The dome region is marked by pink lines. c Quantification of the intensity ratio of peak and base in the plots. The number of cells used for quantification is shown at the bottom. Data are presented as mean values ± SD with individual points shown. The comparison was performed using a two-tailed student’s t-test. ***p < 0.001. The exact p-values are available in Source Data. d Early accumulation of PpROP4 at branching sites in subapical cells (indicated by stars) of ropgap, ren mutants. Images were taken starting from the nuclear envelope breakdown. Scale bar: 10 µm. Similar results in (d) were obtained in three independent experiments. Source data are provided as a Source Data file.CC BY · PubMed Central
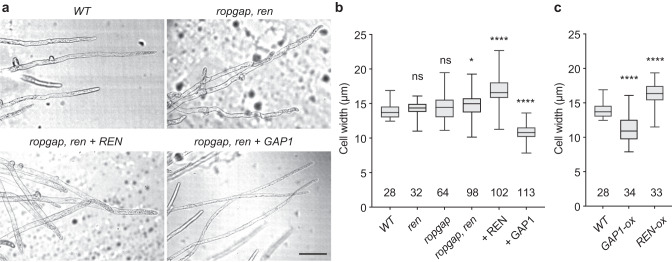
Fig. 7 PpRopGAPs and PpREN oppositely regulate cell width. a Cell morphology and branch pattern in WT, mutant, and rescued mosses. Note that the overexpression of PpREN or PpRopGAP1 rescued cell growth but resulted in increased and reduced cell width, respectively. Scale bar: 100 µm. b Quantification of cell width in WT, mutant, and rescued mosses. c Quantification of cell width in WT and overexpression lines. Data are presented as box-and-whisker plots, showing the interquartile range (box), the median (horizontal line), and minimum and maximum values (whiskers) in (b, c). The number of cells used for quantification is shown at the bottom. Each group is compared with WT cells using one-way ANOVA tests. ns, not significant. *p < 0.05. ****p < 0.0001. The exact p-values are available in Source Data. Source data are provided as a Source Data file.
Fig. 7 PpRopGAPs and PpREN oppositely regulate cell width. a Cell morphology and branch pattern in WT, mutant, and rescued mosses. Note that the overexpression of PpREN or PpRopGAP1 rescued cell growth but resulted in increased and reduced cell width, respectively. Scale bar: 100 µm. b Quantification of cell width in WT, mutant, and rescued mosses. c Quantification of cell width in WT and overexpression lines. Data are presented as box-and-whisker plots, showing the interquartile range (box), the median (horizontal line), and minimum and maximum values (whiskers) in (b, c). The number of cells used for quantification is shown at the bottom. Each group is compared with WT cells using one-way ANOVA tests. ns, not significant. *p < 0.05. ****p < 0.0001. The exact p-values are available in Source Data. Source data are provided as a Source Data file.CC BY · PubMed Central
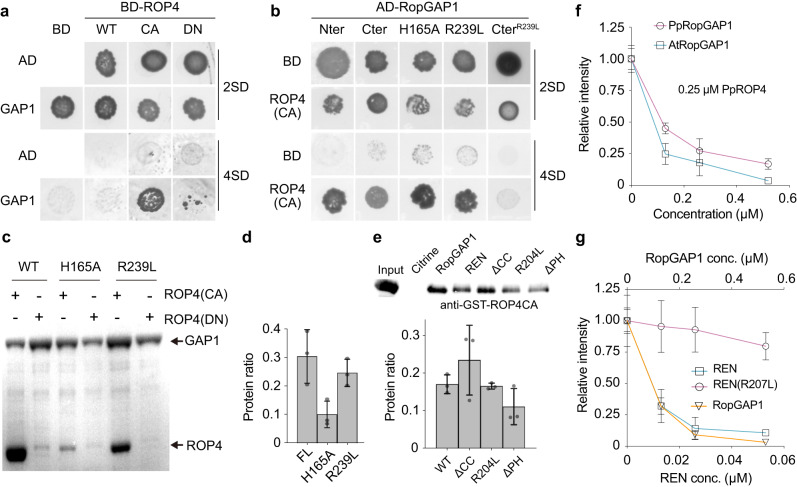
Fig. 8 PpRopGAP1 exhibits a higher binding capacity with PpROP4 but a much lower GAP activity than PpREN in vitro. a PpRopGAP1 interacts with constitutively active (CA) PpROP4 but not the WT or dominant-negative (DN) forms in yeast-two-hybrid assays. 2 SD, nonselective Trp-/Leu- synthetic dropout medium. 4 SD, selective Trp-/Leu-/His-/Ade- medium. b The CRIB domain-containing N-terminal portion (Nter, 1-193) and the GAP domain-containing C-terminal portion (Cter, 194-469) of PpRopGAP1 can bind active PpROP4 separately. The binding of Cter with active PpROP4 is abolished by the activity-deficient R239L mutation. c Pull-down analyses of PpRopGAP1-PpROP4 interactions in vitro. Recombinant Glutathione S-transferase (GST)-fused PpROP4(CA) or PpROP4(DN) was purified and pulled down by maltose binding protein (MBP)-tagged WT or mutant PpRopGAP1. Coomassie blue-stained SDS-PAGE gel after pull-down is shown. d Quantification of the relative amounts of GST-PpROP4(CA) pulled down by WT and mutant MBP-PpRopGAP1. e Pull-down analyses and quantification of PpREN-PpROP4CA interactions in vitro. GST-fused PpROP4(CA) was purified and pulled down by WT or mutant forms of MBP-PpREN. Citrine and RopGAP1 were used as negative control and positive control, respectively. ROP4CA was detected with an anti-GST antibody via western blotting. f The GTPase activity of PpROP4 stimulated by PpRopGAP1 and AtRopGAP1. Relative fluorescence intensity generated by excess GTP after GTPase reactions were measured. Each reaction contained 0.25 µM PpROP4. g GTPase activity of PpROP4 stimulated by PpREN, PpREN(R204L), and PpRopGAP1. Note that PpREN is highly active and can stimulate GTP hydrolysis at a concentration around ten-fold lower than PpRopGAP1. Each experiment in (c–g) was performed with three replicates. Data in (d–g) are presented as mean values ± SD with individual points shown in (d, e). Source data are provided as a Source Data file.
Fig. 8 PpRopGAP1 exhibits a higher binding capacity with PpROP4 but a much lower GAP activity than PpREN in vitro. a PpRopGAP1 interacts with constitutively active (CA) PpROP4 but not the WT or dominant-negative (DN) forms in yeast-two-hybrid assays. 2 SD, nonselective Trp-/Leu- synthetic dropout medium. 4 SD, selective Trp-/Leu-/His-/Ade- medium. b The CRIB domain-containing N-terminal portion (Nter, 1-193) and the GAP domain-containing C-terminal portion (Cter, 194-469) of PpRopGAP1 can bind active PpROP4 separately. The binding of Cter with active PpROP4 is abolished by the activity-deficient R239L mutation. c Pull-down analyses of PpRopGAP1-PpROP4 interactions in vitro. Recombinant Glutathione S-transferase (GST)-fused PpROP4(CA) or PpROP4(DN) was purified and pulled down by maltose binding protein (MBP)-tagged WT or mutant PpRopGAP1. Coomassie blue-stained SDS-PAGE gel after pull-down is shown. d Quantification of the relative amounts of GST-PpROP4(CA) pulled down by WT and mutant MBP-PpRopGAP1. e Pull-down analyses and quantification of PpREN-PpROP4CA interactions in vitro. GST-fused PpROP4(CA) was purified and pulled down by WT or mutant forms of MBP-PpREN. Citrine and RopGAP1 were used as negative control and positive control, respectively. ROP4CA was detected with an anti-GST antibody via western blotting. f The GTPase activity of PpROP4 stimulated by PpRopGAP1 and AtRopGAP1. Relative fluorescence intensity generated by excess GTP after GTPase reactions were measured. Each reaction contained 0.25 µM PpROP4. g GTPase activity of PpROP4 stimulated by PpREN, PpREN(R204L), and PpRopGAP1. Note that PpREN is highly active and can stimulate GTP hydrolysis at a concentration around ten-fold lower than PpRopGAP1. Each experiment in (c–g) was performed with three replicates. Data in (d–g) are presented as mean values ± SD with individual points shown in (d, e). Source data are provided as a Source Data file.CC BY · PubMed Central
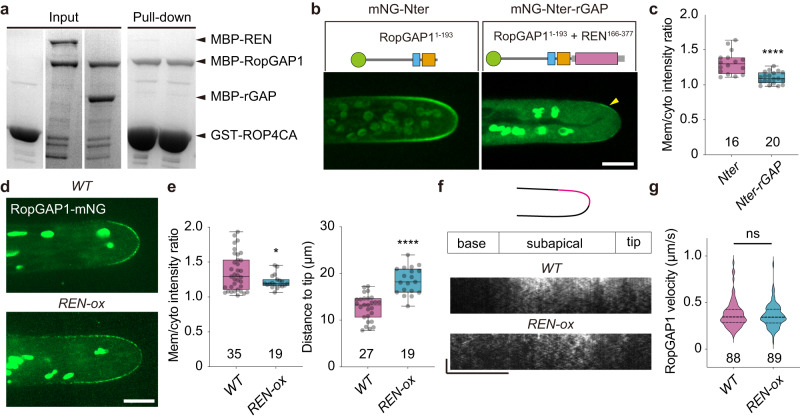
Fig. 9 PpREN disrupts the membrane clustering of PpRopGAP1. a Competitive pull-down analyses of PpRopGAP1 and PpROP4CA in the presence of PpREN or the GAP domain of PpREN (rGAP). Equal amounts of MBP-PpRopGAP1 and MBP-PpREN (or MBP-rGAP) were pulled down by GST-PpROP4CA. b Localization of the free Nter portion of PpRopGAP1 and its fusion with the GAP domain of PpREN. The arrow indicates weak enrichment at the apical membrane. Scale bar: 10 µm. c Quantification of intensity ratio between membrane-associated and cytoplasmic proteins. The number of cells used for quantification is shown below the bars. d Localization of the endogenous PpRopGAP1 in WT and REN overexpression (REN-ox) lines. Scale bar: 10 µm. e Quantification of intensity ratio between membrane-associated and cytoplasmic PpRopGAP1 (left) and distances of PpRopGAP1 signal to the cell tip (right). The number of cells used for quantification is shown below the bars. f Kymographs showing PpRopGAP1 movement. Kymographs were generated at one lateral surface along the tip to the basal region. Note that PpRopGAP1 is enriched at the subapical membrane in WT cells and its signal extends to the basal membrane in REN-ox cells. Scale bars: horizontal, 10 µm; vertical, 10 s. g Quantification of velocities of PpRopGAP1-labeled particles. The numbers of mobile particles from WT (5 cells) and REN-ox (4 cells) cells are shown below the bars. Data in (c, e) are presented as box-and-whisker plots, showing the interquartile range (box), the median (horizontal line), minimum and maximum values (whiskers), and individual data points. Data in (g) are presented as violin plots, showing the quartiles (thin lines) and the median (central line). Statistical analyses were performed using two-tailed student’s t-tests. ns, not significant. *p < 0.05. ****p < 0.0001. The exact p-values are available in Source Data. Similar results in (a) were obtained in three independent experiments. Source data are provided as a Source Data file.
Fig. 9 PpREN disrupts the membrane clustering of PpRopGAP1. a Competitive pull-down analyses of PpRopGAP1 and PpROP4CA in the presence of PpREN or the GAP domain of PpREN (rGAP). Equal amounts of MBP-PpRopGAP1 and MBP-PpREN (or MBP-rGAP) were pulled down by GST-PpROP4CA. b Localization of the free Nter portion of PpRopGAP1 and its fusion with the GAP domain of PpREN. The arrow indicates weak enrichment at the apical membrane. Scale bar: 10 µm. c Quantification of intensity ratio between membrane-associated and cytoplasmic proteins. The number of cells used for quantification is shown below the bars. d Localization of the endogenous PpRopGAP1 in WT and REN overexpression (REN-ox) lines. Scale bar: 10 µm. e Quantification of intensity ratio between membrane-associated and cytoplasmic PpRopGAP1 (left) and distances of PpRopGAP1 signal to the cell tip (right). The number of cells used for quantification is shown below the bars. f Kymographs showing PpRopGAP1 movement. Kymographs were generated at one lateral surface along the tip to the basal region. Note that PpRopGAP1 is enriched at the subapical membrane in WT cells and its signal extends to the basal membrane in REN-ox cells. Scale bars: horizontal, 10 µm; vertical, 10 s. g Quantification of velocities of PpRopGAP1-labeled particles. The numbers of mobile particles from WT (5 cells) and REN-ox (4 cells) cells are shown below the bars. Data in (c, e) are presented as box-and-whisker plots, showing the interquartile range (box), the median (horizontal line), minimum and maximum values (whiskers), and individual data points. Data in (g) are presented as violin plots, showing the quartiles (thin lines) and the median (central line). Statistical analyses were performed using two-tailed student’s t-tests. ns, not significant. *p < 0.05. ****p < 0.0001. The exact p-values are available in Source Data. Similar results in (a) were obtained in three independent experiments. Source data are provided as a Source Data file.CC BY · PubMed Central
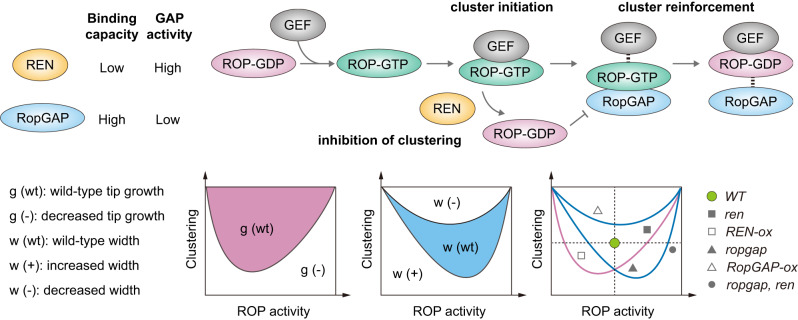
Fig. 10 A working model on the functions of REN and RopGAP in coordinating tip growth and cell width regulation. REN has a higher GAP activity but a weaker binding capacity to active ROPs than RopGAPs. During polarity establishment, RopGEFs convert ROP-GDP (inactive) to ROP-GTP (active) and drive polarity initiation by forming initial clusters with ROPs. RopGAPs are subsequently recruited by active ROPs and promote the formation of large clusters owing to their relatively stable interactions with ROPs, leading to a stabilized and restricted polar membrane domain. REN stimulates the rapid conversion of ROP-GTP to ROP-GDP, thus decreasing the amount of active ROPs and weakening the clustering ability of RopGAPs. Tip growth and cell width are both regulated by the level of active ROPs and their clustering capacity but display distinct sensitivities to these two parameters. Alterations in ROP activity and clustering by perturbing the functions of RopGAPs and REN could lead to different effects on tip growth and cell width.
Fig. 10 A working model on the functions of REN and RopGAP in coordinating tip growth and cell width regulation. REN has a higher GAP activity but a weaker binding capacity to active ROPs than RopGAPs. During polarity establishment, RopGEFs convert ROP-GDP (inactive) to ROP-GTP (active) and drive polarity initiation by forming initial clusters with ROPs. RopGAPs are subsequently recruited by active ROPs and promote the formation of large clusters owing to their relatively stable interactions with ROPs, leading to a stabilized and restricted polar membrane domain. REN stimulates the rapid conversion of ROP-GTP to ROP-GDP, thus decreasing the amount of active ROPs and weakening the clustering ability of RopGAPs. Tip growth and cell width are both regulated by the level of active ROPs and their clustering capacity but display distinct sensitivities to these two parameters. Alterations in ROP activity and clustering by perturbing the functions of RopGAPs and REN could lead to different effects on tip growth and cell width.CC BY · PubMed Central

Verification

Claims the paper makes

The claims and statistics of this paper haven’t been checked yet.

Run the check — free, no account needed. It reads the open-access text and checks the sources it cites.

A few free checks a day · papers already verified open instantly · results are public

Self-check

Percentages, sums and reported differences re-computed from the paper’s own numbers.

The self-check needs the paper’s full text.

Citations

Cites

Show all 66 references

Metadata

Authors
Ruan, J., Lai, L., Ou, H., & Yi, P.
Affiliations
Sichuan University (CN)
Corresponding author
Yi, Peishan
Venue
Nature Communications
Published
2023-11-04
Volume
14
Issue
1
Pages
7084-7084
ISSN
2041-1723 (ISSN-L)
OpenAlex
W4388348414
Cited by
23
References
66
Citations by year
2026: 3 · 2025: 10 · 2024: 9 · 2023: 1
FWCI
3.62
Type
journal article
Language
en
Open access
Licence
Locations
  • Nature Communications (publishedVersion, cc-by)
  • bioRxiv (Cold Spring Harbor Laboratory) (acceptedVersion)
  • PubMed Central (publishedVersion, cc-by)
  • PubMed (publishedVersion)
  • RePEc: Research Papers in Economics (submittedVersion)
  • DOAJ (DOAJ: Directory of Open Access Journals) (submittedVersion, cc-by-sa)
Funders
  • National Natural Science Foundation of China (32270776)
  • Sichuan University (1082204112609, 2022SCUH0010, 0082604151432)
Topics
  • Life Sciences › Agricultural and Biological Sciences › Plant Science › Plant Molecular Biology Research
  • Life Sciences › Biochemistry, Genetics and Molecular Biology › Cell Biology › Cellular transport and secretion
  • Life Sciences › Biochemistry, Genetics and Molecular Biology › Molecular Biology › Protein Kinase Regulation and GTPase Signaling
Keywords
ROP GTPases, cell polarity, tip growth, cell size control, pleckstrin homology domain, Physcomitrella patens, bryophytes, polarized growth
MeSH terms
Plants, Guanine Nucleotide Exchange Factors, GTPase-Activating Proteins, rho GTP-Binding Proteins

About these checks

Registry, retraction, Cites and statistics results are computed, not judged, with one exception: a printed reference that no index lists is read once by a model before it counts as a citation error. Claims are extracted by a model and kept only when their quote appears verbatim in the text; each cited source is then checked, with a model’s help, for whether it says what the claim relies on. Those verdicts can be wrong — read the claim’s quote and the cited source before relying on one.

Statistics and arithmetic are recomputed, not judged.

Confidence bands are shown only for fields calibrated on our annotated test set. None is calibrated yet, so no band is shown.

What counts as a claim ›How we measure confidence ›How we check this ›

Are you an author, or do you see a problem with this page? Request a review

How to cite

Cite CoChat for the checks on this page, and the paper for its own findings.

This page
CoChat. (2026). Citation check: Two subtypes of GTPase-activating proteins coordinate tip growth and cell size regulation in Physcomitrium patens. https://app.cochat.ai/papers/10.1038/s41467-023-42879-y
The paper
Ruan, J., Lai, L., Ou, H., & Yi, P. (2023). Two subtypes of GTPase-activating proteins coordinate tip growth and cell size regulation in Physcomitrium patens. Nature Communications. https://doi.org/10.1038/s41467-023-42879-y

Data sources

Bibliographic data: Semantic Scholar, OpenAlex, Crossref.

Contains information from the Semantic Scholar Academic Graph Datasets, made available under the ODC Attribution License (ODC-BY 1.0).

Semantic Scholar’s data is described in: Kinney, R., et al. (2023). The Semantic Scholar Open Data Platform. arXiv:2301.10140.