

The DOI matches its Crossref record; 80 of the 80 references it cites were found in a registry or an index.
A physiological approach for assessing human survivability and liveability to heat in a changing climate
Open accessAbstract
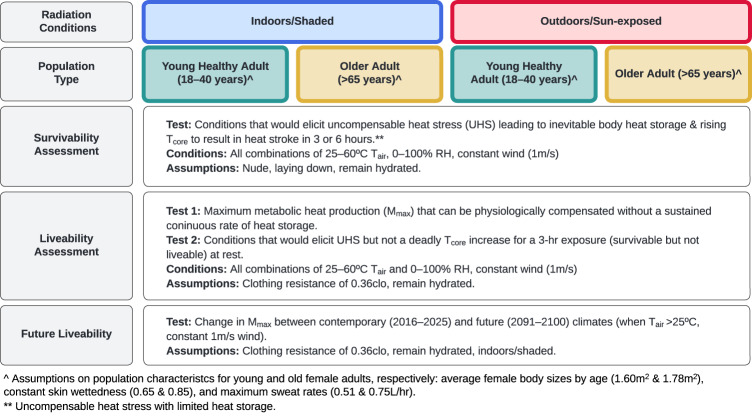
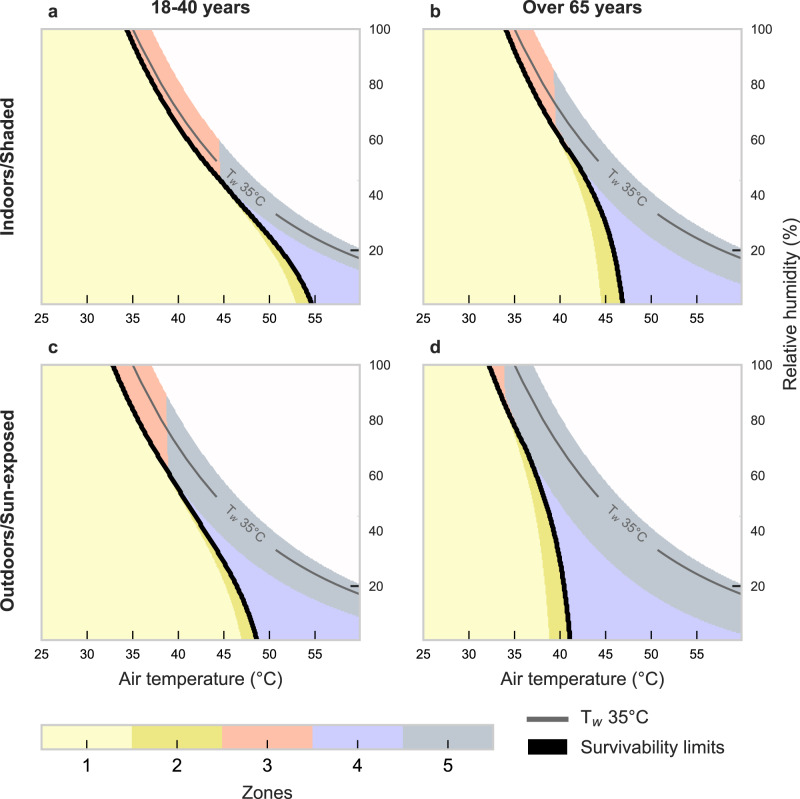
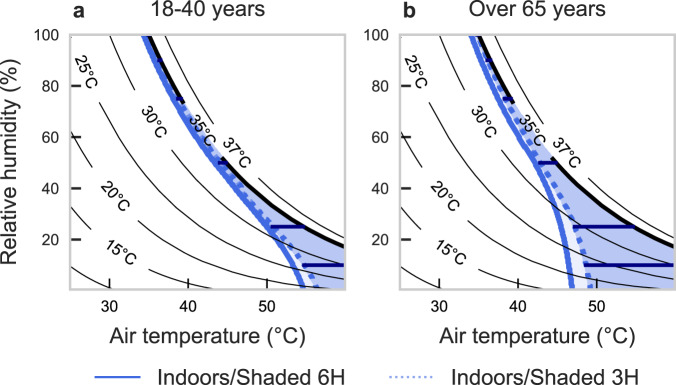
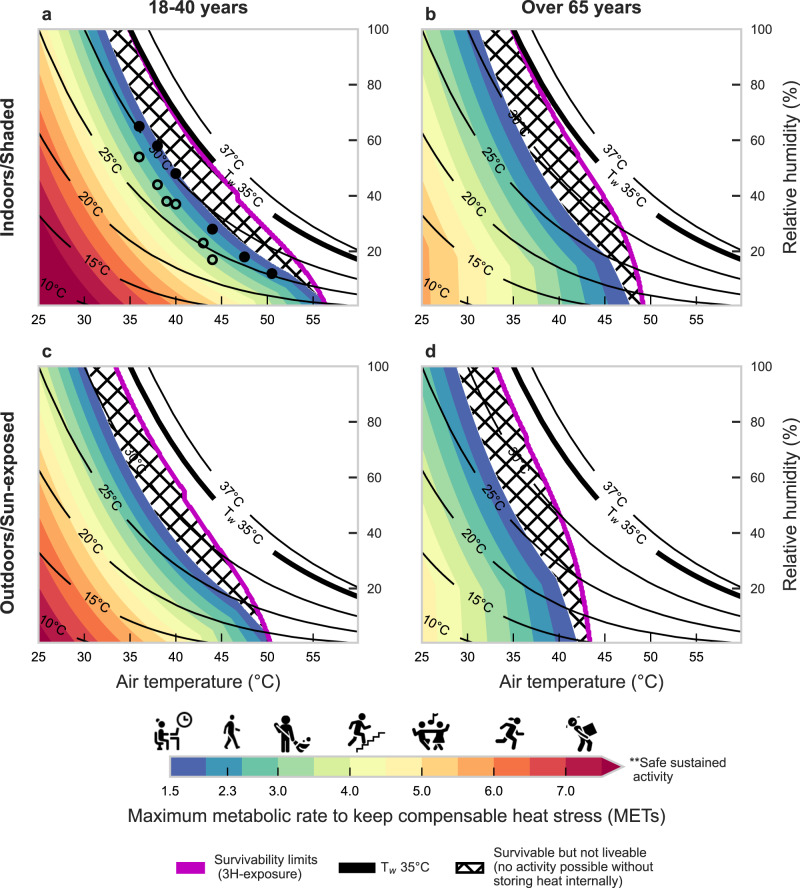
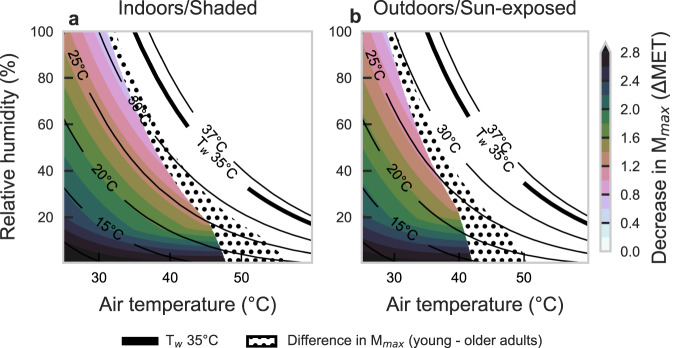
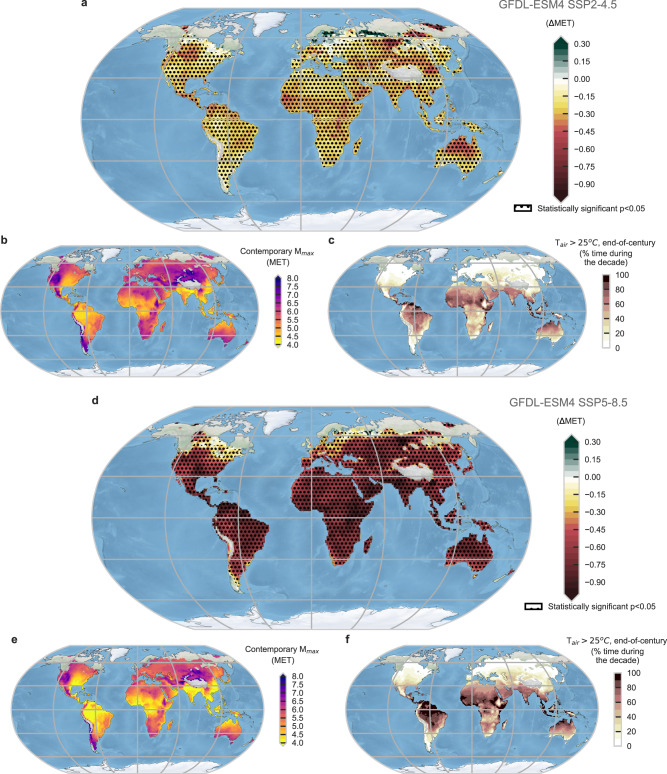
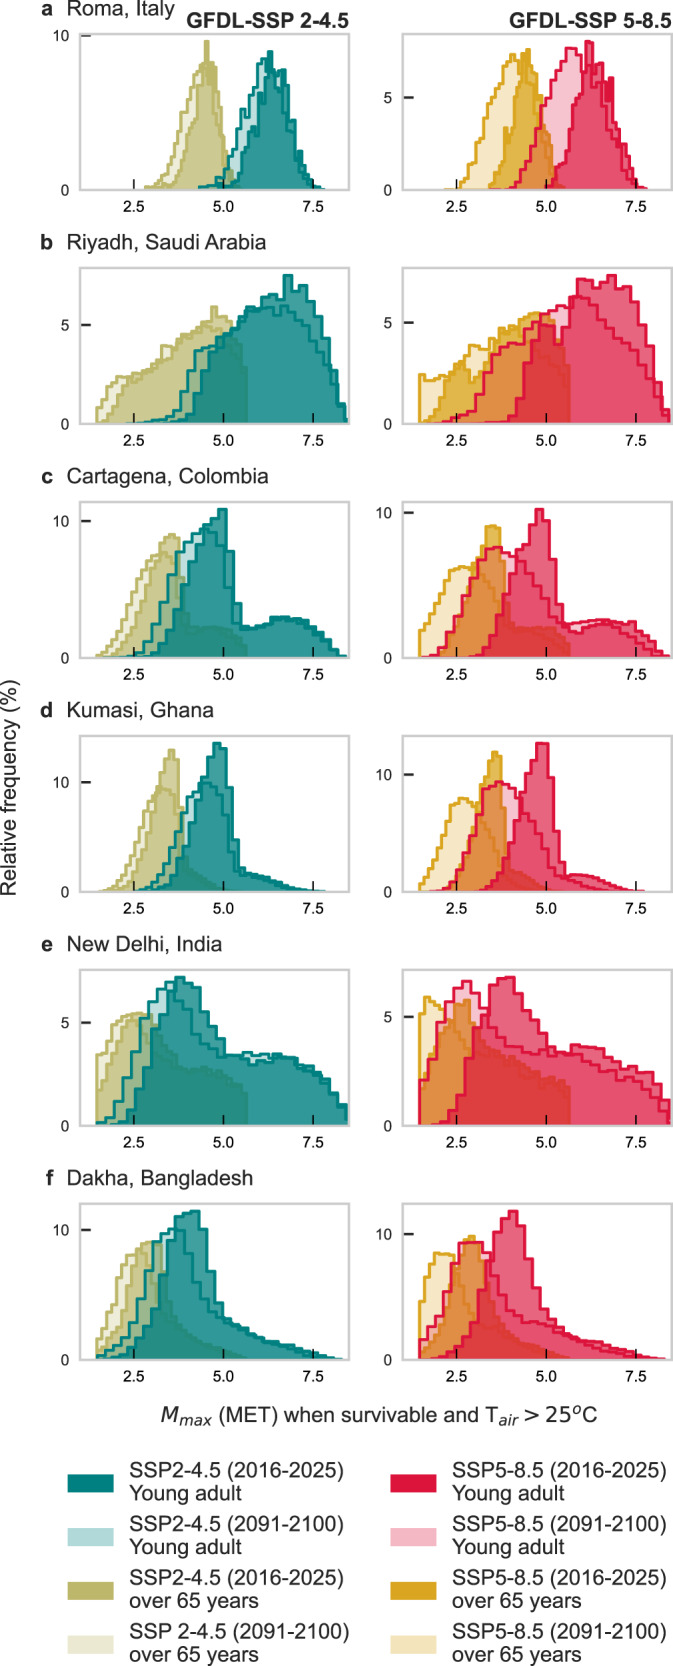
Most studies projecting human survivability limits to extreme heat with climate change use a 35 °C wet-bulb temperature (T w ) threshold without integrating variations in human physiology. This study applies physiological and biophysical principles for young and older adults, in sun or shade, to improve current estimates of survivability and introduce liveability (maximum safe, sustained activity) under current and future climates. Our physiology-based survival limits show a vast underestimation of risks by the 35 °C T w model in hot-dry conditions. Updated survivability limits correspond to T w ~25.8–34.1 °C (young) and ~21.9–33.7 °C (old)—0.9–13.1 °C lower than T w = 35 °C. For older female adults, estimates are ~7.2–13.1 °C lower than 35 °C in dry conditions. Liveability declines with sun exposure and humidity, yet most dramatically with age (2.5–3.0 METs lower for older adults). Reductions in safe activity for younger and older adults between the present and future indicate a stronger impact from aging than warming.
Overview
The claims and statistics of this paper haven’t been checked yet.
Run the check — free, no account needed. It reads the open-access text and checks the sources it cites.
Integrity signals
Registry
Cites
Statistics
Figures
Verification
Claims the paper makes
The claims and statistics of this paper haven’t been checked yet.
Run the check — free, no account needed. It reads the open-access text and checks the sources it cites.
Claims other papers make about this one
Each is checked against this paper’s own text: does it say what the citing paper says it does?
The source backs part of the claim, not all of it — or backs it for a different population, condition or comparison.
In the citing paper
“Air conditioning is an effective technology for reducing heat exposure.185”
From The 2024 report of the Lancet Countdown on health and climate change: facing record-breaking threats from delayed action (2024) · cites this paper as [185]
Experimental — accuracy not yet measured
Self-check
Percentages, sums and reported differences re-computed from the paper’s own numbers.
The self-check needs the paper’s full text.
Citations
Cites
Eyring, V., Bony, S., Meehl, G. A., Senior, C. A., Stevens, B., Stouffer, R. J., & Taylor, K. E. (2016) · Geoscientific Model Development · doi:10.5194/gmd-9-1937-2016 · Cited by 11,981
2011 Compendium of Physical Activities: A Second Update of Codes and MET Values
AINSWORTH, B. E., HASKELL, W. L., HERRMANN, S. D., MECKES, N., BASSETT, D. R., TUDOR-LOCKE, C., GREER, J. L., VEZINA, J., WHITT-GLOVER, M. C., & LEON, A. S. (2011) · Medicine & Science in Sports & Exercise · doi:10.1249/mss.0b013e31821ece12 · Cited by 6,317
Hot weather and heat extremes: health risks
Ebi, K. L., Capon, A., Berry, P., Broderick, C., de Dear, R., Havenith, G., Honda, Y., Kovats, R. S., Ma, W., Malik, A., et al. (2021) · The Lancet · doi:10.1016/s0140-6736(21)01208-3 · Cited by 2,172
Self-citationAn adaptability limit to climate change due to heat stress
Sherwood, S. C., & Huber, M. (2010) · Proceedings of the National Academy of Sciences · doi:10.1073/pnas.0913352107 · Cited by 1,236
Steadman, R. G. (1979) · Journal of applied meteorology · doi:10.1175/1520-0450(1979)018 · Cited by 1,170
Dunne, J. P. P., Horowitz, L. W., Adcroft, A., Ginoux, P. A., Held, I. M., John, J. G., Krasting, J. P., Malyshev, S. L., Naïk, V., Paulot, F., et al. (2020) · Journal of Advances in Modeling Earth Systems · doi:10.1029/2019ms002015 · Cited by 1,091
The emergence of heat and humidity too severe for human tolerance
Raymond, C., Matthews, T. K. R., & Horton, R. (2020) · Science Advances · doi:10.1126/sciadv.aaw1838 · Cited by 875
Heat exposure and cardiovascular health outcomes: a systematic review and meta-analysis
Liu, J., Varghese, B. M., Hansen, A. L., Zhang, Y., Driscoll, T., Morgan, G. G., Dear, K. B. G., Gourley, M., Capon, A. G., & Bi, P. (2022) · The Lancet Planetary Health · doi:10.1016/s2542-5196(22)00117-6 · Cited by 778
Jay, O., Capon, A. G., Berry, P., Broderick, C. R., de Dear, R., Havenith, G., Honda, Y., Kovats, S. R., Ma, W., Malik, A., et al. (2021) · The Lancet · doi:10.1016/s0140-6736(21)01209-5 · Cited by 769
Self-citationFuture temperature in southwest Asia projected to exceed a threshold for human adaptability
Pal, J. S., & Eltahir, E. A. B. (2016) · Nature Climate Change · doi:10.1038/nclimate2833 · Cited by 749
Extreme weather impacts of climate change: an attribution perspective
Clarke, B. J., Otto, F. E. L., Stuart-Smith, R. F., & Harrington, L. J. (2022) · Environmental Research Climate · doi:10.1088/2752-5295/ac6e7d · Cited by 727
Deadly heat waves projected in the densely populated agricultural regions of South Asia
Im, E.-S., Pal, J. S., & Eltahir, E. A. B. (2017) · Science Advances · doi:10.1126/sciadv.1603322 · Cited by 673
Reductions in labour capacity from heat stress under climate warming
Dunne, J. P., Stouffer, R. J., & John, J. G. (2013) · Nature Climate Change · doi:10.1038/nclimate1827 · Cited by 660
Excess hospital admissions during the July 1995 heat wave in Chicago
Semenza, J. (1999) · American Journal of Preventive Medicine · doi:10.1016/s0749-3797(99)00025-2 · Cited by 619
Invited Review: Aging and human temperature regulation
Kenney, W. L., & Munce, T. A. (2003) · Journal of Applied Physiology · doi:10.1152/japplphysiol.00202.2003 · Cited by 601
International Standard Organization
(2009) · Springer eBooks · doi:10.1007/978-3-540-72816-0_11549 · Cited by 589
The effect of heat waves on mental health in a temperate Australian city
Hansen, A., Bi, P., Nitschke, M., Ryan, P., Pisaniello, D., & Tucker, G. (2008) · Environmental Health Perspectives · doi:10.1289/ehp.11339 · Cited by 569
Prognostic Factors in Heat Wave–Related Deaths<subtitle>A Meta-analysis</subtitle>
Bouchama, A. (2007) · Archives of Internal Medicine · doi:10.1001/archinte.167.20.ira70009 · Cited by 565
Coffel, E., Horton, R., & de Sherbinin, A. (2017) · Environmental Research Letters · doi:10.1088/1748-9326/aaa00e · Cited by 548
Heat stroke: Role of the systemic inflammatory response
Leon, L. R., & Helwig, B. G. (2010) · Journal of Applied Physiology · doi:10.1152/japplphysiol.00301.2010 · Cited by 515
North China Plain threatened by deadly heatwaves due to climate change and irrigation
Kang, S., & Eltahir, E. A. B. (2018) · Nature Communications · doi:10.1038/s41467-018-05252-y · Cited by 510
Extreme High Temperatures and Hospital Admissions for Respiratory and Cardiovascular Diseases
Lin, S., Luo, M., Walker, R. J., Liu, X., Hwang, S., & Chinery, R. (2009) · Epidemiology · doi:10.1097/ede.0b013e3181ad5522 · Cited by 498
Classic and exertional heatstroke
Bouchama, A., Abuyassin, B., Lehé, C. L., Laitano, O., Jay, O., O’Connor, F. G., & Leon, L. R. (2022) · Nature Reviews Disease Primers · doi:10.1038/s41572-021-00334-6 · Cited by 488
Self-citationGuo, Y., Gasparrini, A., Li, S., Sera, F., Vicedo-Cabrera, A. M., Coêlho, M. D. S. Z. S., Saldiva, P. H. N., Lavigne, É., Tawatsupa, B., Punnasiri, K., et al. (2018) · PLoS Medicine · doi:10.1371/journal.pmed.1002629 · Cited by 438
Self-citationLeon, L. R., & Bouchama, A. (2015) · Comprehensive physiology · doi:10.1002/cphy.c140017 · Cited by 406
Heat Waves, Aging, and Human Cardiovascular Health
Kenney, W. L., Craighead, D. H., & Alexander, L. M. (2014) · Medicine & Science in Sports & Exercise · doi:10.1249/mss.0000000000000325 · Cited by 332
Biophysical aspects of human thermoregulation during heat stress
Cramer, M. N., & Jay, O. (2016) · Autonomic Neuroscience · doi:10.1016/j.autneu.2016.03.001 · Cited by 331
Self-citationHealth, Wellbeing and the Changing Structure of Communities
(IPCC), I. P. O. C. C. (2023) · Cambridge University Press eBooks · doi:10.1017/9781009325844.009 · Cited by 331
Thermometry, Calorimetry, and Mean Body Temperature during Heat Stress
Kenny, G. P., & Jay, O. (2013) · Comprehensive physiology · doi:10.1002/cphy.c130011 · Cited by 319
Self-citationRapid increase in the risk of heat-related mortality
Lüthi, S., Fairless, C., Fischer, E. M., Scovronick, N., Armstrong, B., Coêlho, M. D. S. Z. S., Guo, Y. L., Guo, Y., Honda, Y., Huber, V., et al. (2023) · Nature Communications · doi:10.1038/s41467-023-40599-x · Cited by 310
Moist Heat Stress on a Hotter Earth
Buzan, J., & Huber, M. S. (2020) · Annual Review of Earth and Planetary Sciences · doi:10.1146/annurev-earth-053018-060100 · Cited by 282
Humidity’s Role in Heat-Related Health Outcomes: A Heated Debate
Baldwin, J. W., Benmarhnia, T., Ebi, K. L., Jay, O., Lutsko, N. J., & Vanos, J. (2023) · Environmental Health Perspectives · doi:10.1289/ehp11807 · Cited by 275
Self-citationHuman behavioral thermoregulation during exercise in the heat
Flouris, A. D., & Schlader, Z. J. (2015) · Scandinavian Journal of Medicine & Science in Sports · doi:10.1111/sms.12349 · Cited by 249
Vecellio, D. J., Wolf, S. T., Cottle, R. M., & Kenney, W. L. (2021) · Journal of Applied Physiology · doi:10.1152/japplphysiol.00738.2021 · Cited by 248
Heat Acclimation Decay and Re-Induction: A Systematic Review and Meta-Analysis
Daanen, H. A. M., Racinais, S., & Périard, J. D. (2017) · Sports Medicine · doi:10.1007/s40279-017-0808-x · Cited by 219
Temperature and Cardiovascular Deaths in the US Elderly
Barnett, A. G. (2007) · Epidemiology · doi:10.1097/01.ede.0000257515.34445.a0 · Cited by 189
Physiological responses of physically fit men and women to acclimation to humid heat
Avellini, B. A., Kamon, E., & KRAJEWSKI, J. T. (1980) · Journal of Applied Physiology · doi:10.1152/jappl.1980.49.2.254 · Cited by 181
Simplicity lacks robustness when projecting heat-health outcomes in a changing climate
Vanos, J., Baldwin, J. W., Jay, O., & Ebi, K. L. (2020) · Nature Communications · doi:10.1038/s41467-020-19994-1 · Cited by 167
Self-citationDrug-Induced Hyperhidrosis and Hypohidrosis
Cheshire, W. P., & Fealey, R. D. (2008) · Drug Safety · doi:10.2165/00002018-200831020-00002 · Cited by 159
Vecellio, D. J., Kong, Q., Kenney, W. L., & Huber, M. S. (2023) · Proceedings of the National Academy of Sciences · doi:10.1073/pnas.2305427120 · Cited by 154
Cramer, M. N., & Jay, O. (2018) · Journal of Applied Physiology · doi:10.1152/japplphysiol.00191.2018 · Cited by 149
Self-citationAssessing human habitability and migration
Horton, R., de Sherbinin, A., Wrathall, D. J., & Oppenheimer, M. (2021) · Science · doi:10.1126/science.abi8603 · Cited by 149
Regional differences in the sweating responses of older and younger men
Inoue, Y., Nakao, M., Araki, T., & Murakami, H. (1991) · Journal of Applied Physiology · doi:10.1152/jappl.1991.71.6.2453 · Cited by 147
Foster, J., Smallcombe, J. W., Hodder, S., Jay, O., Flouris, A. D., Nybo, L., & Havenith, G. (2021) · International Journal of Biometeorology · doi:10.1007/s00484-021-02105-0 · Cited by 143
Self-citationLambert, G. P. (2008) · Medicine and Sport Science · doi:10.1159/000151550 · Cited by 134
Raymond, C., Singh, D., & Horton, R. (2017) · Journal of Geophysical Research Atmospheres · doi:10.1002/2017jd027140 · Cited by 126
Morris, N. B., Jay, O., Flouris, A. D., Casanueva, A., Gao, C., Foster, J., Havenith, G., & Nybo, L. (2020) · Environmental Health · doi:10.1186/s12940-020-00641-7 · Cited by 121
Self-citationAging impairs heat loss, but when does it matter?
Stapleton, J. M., Poirier, M. P., Flouris, A. D., Boulay, P., Sigal, R. J., Malcolm, J., & Kenny, G. P. (2014) · Journal of Applied Physiology · doi:10.1152/japplphysiol.00722.2014 · Cited by 116
Ravanelli, N., Hodder, S., Havenith, G., & Jay, O. (2015) · JAMA · doi:10.1001/jama.2015.153 · Cited by 111
Self-citationThermal stress induces epithelial permeability
Moseley, P. L., Gapen, C., Wallen, E. S., Walter, M. E., & Peterson, M. W. (1994) · American Journal of Physiology-Cell Physiology · doi:10.1152/ajpcell.1994.267.2.c425 · Cited by 109
Weather and place-based human behavior: recreational preferences and sensitivity
de Freitas, C. R. (2014) · International Journal of Biometeorology · doi:10.1007/s00484-014-0824-6 · Cited by 94
Dervis, S., Coombs, G. B., Chaseling, G. K., Filingeri, D., Smoljanić, J., & Jay, O. (2015) · Journal of Applied Physiology · doi:10.1152/japplphysiol.00906.2015 · Cited by 88
Self-citationMaximum Skin Wettedness after Aerobic Training with and without Heat Acclimation
Ravanelli, N., Coombs, G. B., Imbeault, P., & Jay, O. (2017) · Medicine & Science in Sports & Exercise · doi:10.1249/mss.0000000000001439 · Cited by 88
Self-citationNonuniform, age-related decrements in regional sweating and skin blood flow
Smith, C. J. W., Alexander, L. M., & Kenney, W. L. (2013) · American Journal of Physiology-Regulatory, Integrative and Comparative Physiology · doi:10.1152/ajpregu.00290.2013 · Cited by 84
Gagnon, D., Romero, S. A., Cramer, M. N., Jay, O., & Crandall, C. G. (2016) · JAMA · doi:10.1001/jama.2016.10550 · Cited by 79
Self-citationMa, R., Zhong, S., Morabito, M., Hajat, S., Xu, Z., He, Y., Bao, J., Sheng, R., Li, C., Fu, C., et al. (2019) · The Science of The Total Environment · doi:10.1016/j.scitotenv.2019.02.201 · Cited by 77
Morris, N. B., Gruss, F., Lempert, S., English, T., Hospers, L., Capon, A. G., & Jay, O. (2019) · JAMA · doi:10.1001/jama.2019.13051 · Cited by 77
Self-citationCritical environmental limits for young, healthy adults (PSU HEAT Project)
Wolf, S. T., Cottle, R. M., Vecellio, D. J., & Kenney, W. L. (2021) · Journal of Applied Physiology · doi:10.1152/japplphysiol.00737.2021 · Cited by 63
Lu, Y.-C., & Romps, D. M. (2022) · Journal of Applied Meteorology and Climatology · doi:10.1175/jamc-d-22-0021.1 · Cited by 60
Schmeltz, M. T., & Gamble, J. L. (2017) · PLoS ONE · doi:10.1371/journal.pone.0186509 · Cited by 54
Heat-Related Mortality in a Warming Climate: Projections for 12 U.S. Cities
Petkova, E. P., Bader, D., Anderson, G. B., Horton, R., Knowlton, K., & Kinney, P. L. (2014) · International Journal of Environmental Research and Public Health · doi:10.3390/ijerph111111371 · Cited by 51
Heat Waves and Emergency Department Visits Among the Homeless, San Diego, 2012–2019
Schwarz, L., Castillo, E. M., Chan, T. C., Brennan, J. J., Sbiroli, E., Carrasco‐Escobar, G., Nguyen, A., Clemesha, R. E. S., Gershunov, A., & Benmarhnia, T. (2021) · American Journal of Public Health · doi:10.2105/ajph.2021.306557 · Cited by 51
Putnam, H., Hondula, D. M., Urban, A., Berisha, V., Iñiguez, P., & Roach, M. (2018) · Environmental Research Letters · doi:10.1088/1748-9326/aadb44 · Cited by 50
Net-zero commitments could limit warming to below 2 °C
Hausfather, Z., & Moore, F. C. (2022) · Nature · doi:10.1038/d41586-022-00874-1 · Cited by 49
(2022) · Nature Reviews Disease Primers · doi:10.1038/s41572-022-00335-z · Cited by 47
The HEAT-SHIELD project — Perspectives from an inter-sectoral approach to occupational heat stress
Morris, N. B., Piil, J. F., Morabito, M., Messeri, A., Levi, M., Ioannou, L. G., Ciuha, U., Pogačar, T., Kajfež Bogataj, L., Kingma, B., et al. (2021) · Journal of Science and Medicine in Sport · doi:10.1016/j.jsams.2021.03.001 · Cited by 47
Present and future land surface and wet bulb temperatures in the Arabian Peninsula
Safieddine, S. A., Clerbaux, C., Clarisse, L., Whitburn, S., & Eltahir, E. A. B. (2022) · Environmental Research Letters · doi:10.1088/1748-9326/ac507c · Cited by 45
Christidis, N., Mitchell, D., & Stott, P. A. (2023) · npj Climate and Atmospheric Science · doi:10.1038/s41612-023-00377-4 · Cited by 42
Vanos, J., Warland, J., Gillespie, T. J., & Kenny, N. (2012) · International Journal of Biometeorology · doi:10.1007/s00484-012-0522-1 · Cited by 39
Self-citationGuzmán-Echavarría, G., Middel, A., & Vanos, J. (2022) · Temperature · doi:10.1080/23328940.2022.2149024 · Cited by 37
Self-citationIncreased skin wetness independently augments cool‐seeking behaviour during passive heat stress
Vargas, N. T., Chapman, C. L., Ji, W., Johnson, B. D., Gathercole, R. J., & Schlader, Z. J. (2020) · The Journal of Physiology · doi:10.1113/jp279537 · Cited by 34
Åström, C., Åström, D. O., Andersson, C., Ebi, K. L., & Forsberg, B. (2017) · International Journal of Environmental Research and Public Health · doi:10.3390/ijerph14070741 · Cited by 28
Self-citationMaximal sweating rate in humans.
Torii, M. (1995) · PubMed · Cited by 27
Xu, X., Rioux, T. P., & Castellani, M. P. (2022) · Temperature · doi:10.1080/23328940.2022.2088034 · Cited by 27
Prioritize research on human behaviour during extreme heat
Vargas, N. T., Schlader, Z. J., Jay, O., & Hunter, A. (2023) · Nature Human Behaviour · doi:10.1038/s41562-023-01569-x · Cited by 27
Self-citationThermal physiology, more relevant than ever before
Kenney, W. L., Havenith, G., & Jay, O. (2022) · Journal of Applied Physiology · doi:10.1152/japplphysiol.00464.2022 · Cited by 17
Self-citationWet-bulb, dew point, and air temperature trends in Spain
Moratiel, R., Soriano, B., Centeno, A., Spano, D., & Snyder, R. L. (2016) · Theoretical and Applied Climatology · doi:10.1007/s00704-016-1891-x · Cited by 16
High Dose Extrapolation in Climate Change Projections of Heat-Related Mortality
Rocklöv, J., & Ebi, K. L. (2012) · Journal of Agricultural Biological and Environmental Statistics · doi:10.1007/s13253-012-0104-z · Cited by 15
Self-citationScott, R., Marchand, M., Stover, B. D., Causey, K., Harruff, R. C., & Hagopian, A. (2022) · Journal of Social Distress and the Homeless · doi:10.1080/10530789.2021.2021360 · Cited by 11
Extreme Heat Exposure and Occupational Health in a Changing Climate
Vanos, J., Moyce, S. C., Lemke, B., & Kjellstrom, T. E. (2021) · Wiley eBooks · doi:10.1002/9781119413738.ch10 · Cited by 9
Self-citation
Cited by
Sorted by citations
Romanello, M., Walawender, M., Hsu, S.-C., Moskeland, A., Palmeiro-Silva, Y., Scamman, D., Ali, Z., Ameli, N., Angelova, D., Ayeb-Karlsson, S., et al. (2024) · The Lancet · doi:10.1016/s0140-6736(24)01822-1 · Cited by 897
Self-citationHeat-related mortality in Europe during 2023 and the role of adaptation in protecting health
Gallo, E. S., Quijal-Zamorano, M., Turrubiates, R. F. M., Tonne, C. C., Basagaña, X., Achebak, H., & Ballester, J. (2024) · Nature Medicine · doi:10.1038/s41591-024-03186-1 · Cited by 144
Mortality impacts of the most extreme heat events
Matthews, T. K. R., Raymond, C., Foster, J., Baldwin, J. W., Ivanovich, C. C., Kong, Q., Kinney, P. L., & Horton, R. (2025) · Nature Reviews Earth & Environment · doi:10.1038/s43017-024-00635-w · Cited by 118
Self-citationTen new insights in climate science 2024
Schaeffer, R., Schipper, E. L. F., Ospina, D., Mirazo, P., Alencar, A. A. C., Anvari, M., Artaxo, P. E., Biresselioğlu, M. E., Blome, T., Boeckmann, M., et al. (2025) · One Earth · doi:10.1016/j.oneear.2025.101285 · Cited by 82
Climate change and heat stress resilient outdoor workers: findings from systematic literature review
Habibi, P., Razmjouei, J., Moradi, A., Mahdavi, F., Aliabadi, S. F., & Heydari, A. (2024) · BMC Public Health · doi:10.1186/s12889-024-19212-3 · Cited by 73
Metadata
- Authors
- Vanos, J., Guzman-Echavarria, G., Baldwin, J. W., Bongers, C., Ebi, K. L., & Jay, O.
- Affiliations
- Arizona State University (US)
- Lamont-Doherty Earth Observatory (US)
- The University of Sydney (AU)
- University of Washington (US)
- Corresponding author
- Vanos, Jennifer
- Venue
- Nature Communications
- Published
- 2023-11-29
- Volume
- 14
- Issue
- 1
- Pages
- 7653-7653
- ISSN
- 2041-1723 (ISSN-L)
- PMC
- PMC10687011
- OpenAlex
- W4389141827
- Cited by
- 206
- References
- 80
- Citations by year
- 2026: 72 · 2025: 83 · 2024: 50 · 2023: 1
- FWCI
- 36.76
- Type
- journal article
- Language
- en
- Open access
- gold
- doi.org
- Locations
- Nature Communications (publishedVersion, cc-by)
- PubMed Central (publishedVersion, cc-by)
- PubMed (publishedVersion)
- eScholarship (California Digital Library) (submittedVersion, cc-by)
- RePEc: Research Papers in Economics (submittedVersion)
- DOAJ (DOAJ: Directory of Open Access Journals) (submittedVersion, cc-by-sa)
- Funders
- National Science Foundation (CMMI-2045663)
- Department of Health | National Health and Medical Research Council (2021/GNT2009507)
- Topics
- Health Sciences › Medicine › Physiology (medical) › Thermoregulation and physiological responses
- Physical Sciences › Environmental Science › Health, Toxicology and Mutagenesis › Climate Change and Health Impacts
- Physical Sciences › Environmental Science › Environmental Engineering › Urban Heat Island Mitigation
- Keywords
- wet-bulb temperature, human thermoregulation, climate change, extreme heat, older adults, aging, sun exposure, humidity, physiological limits, heat risk assessment
- MeSH terms
- Aged, Female, Hot Temperature, Humans, Humidity, Temperature, Extreme Heat, Climate Change
About these checks
Registry, retraction, Cites and statistics results are computed, not judged, with one exception: a printed reference that no index lists is read once by a model before it counts as a citation error. Claims are extracted by a model and kept only when their quote appears verbatim in the text; each cited source is then checked, with a model’s help, for whether it says what the claim relies on. Those verdicts can be wrong — read the claim’s quote and the cited source before relying on one.
Statistics and arithmetic are recomputed, not judged.
Confidence bands are shown only for fields calibrated on our annotated test set. None is calibrated yet, so no band is shown.
What counts as a claim ›How we measure confidence ›How we check this ›
Are you an author, or do you see a problem with this page? Request a review
