Cited by 108Advanced Memory and Neural ComputingNeural Networks and ApplicationsNeural Networks and Reservoir Computing

The DOI matches its Crossref record; 54 of the 56 references it cites were found in a registry or an index.

Purely self-rectifying memristor-based passive crossbar array for artificial neural network accelerators

Open access

Abstract

Memristor-integrated passive crossbar arrays (CAs) could potentially accelerate neural network (NN) computations, but studies on these devices are limited to software-based simulations owing to their poor reliability. Herein, we propose a self-rectifying memristor-based 1 kb CA as a hardware accelerator for NN computations. We conducted fully hardware-based single-layer NN classification tasks involving the Modified National Institute of Standards and Technology database using the developed passive CA, and achieved 100% classification accuracy for 1500 test sets. We also investigated the influences of the defect-tolerance capability of the CA, impact of the conductance range of the integrated memristors, and presence or absence of selection functionality in the integrated memristors on the image classification tasks. We offer valuable insights into the behavior and performance of CA devices under various conditions and provide evidence of the practicality of memristor-integrated passive CAs as hardware accelerators for NN applications.

Overview

The claims and statistics of this paper haven’t been checked yet.

Run the check — free, no account needed. It reads the open-access text and checks the sources it cites.

A few free checks a day · papers already verified open instantly · results are public

Integrity signals

Registry

Crossref · 10.1038/s41467-023-44620-1

Cites

54 of 54 references verified0 citation errors · 0 not checkable

Statistics

Figures

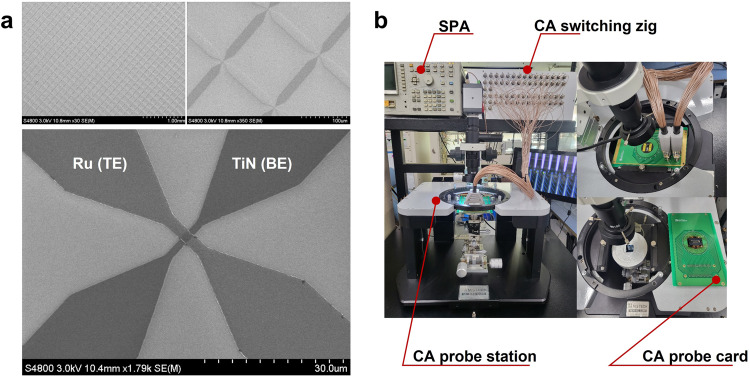
Fig. 1 CA device images and equipment for electrical performance. a SEM images of the 1 kb CA device. b Photographs of the electrical equipment used to characterize the CA devices. The equipment included a semiconductor parameter analyzer (SPA), CA probe station, CA switching zig, and CA probe card.
Fig. 1 CA device images and equipment for electrical performance. a SEM images of the 1 kb CA device. b Photographs of the electrical equipment used to characterize the CA devices. The equipment included a semiconductor parameter analyzer (SPA), CA probe station, CA switching zig, and CA probe card.CC BY · PubMed Central
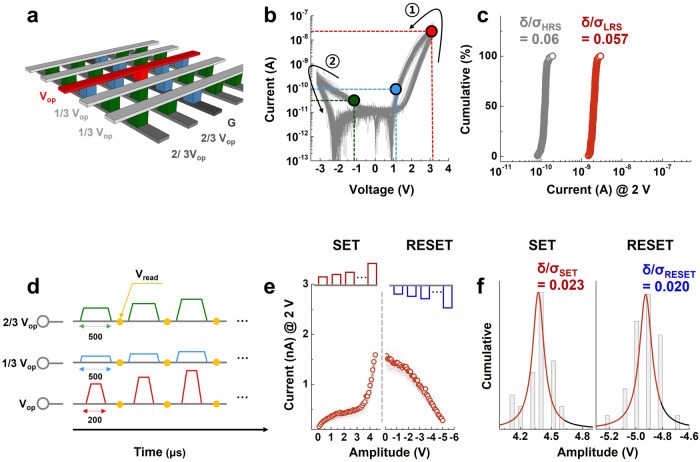
Fig. 2 Electrical characteristics of our 1 kb CA device. a Schematic of the CA utilizing a one-third biasing scheme during the DC I–V characterization. b DC I–V characteristics of 1024 cells in the CA. The black curve marked ① denotes the SET process, while the black curve marked ② denotes the RESET process. c Reading current distributions of each state. The coefficient of variations of the LRS and HRS were 0.057 and 0.06, respectively. d Schematic of the AC-based operations utilizing the biasing scheme. Inhibiting voltages were induced in the unselected cells and had a larger pulse width than the operational voltage. e Electrical pulse-induced behavior of 30 cells in the CA. f Amplitude distributions for the SET and RESET processes. Very low deviation values were observed in each process. The highly uniform electrical characteristics of the CA can be attributed to the nonfilamentary characteristics of our previously developed SRM device.
Fig. 2 Electrical characteristics of our 1 kb CA device. a Schematic of the CA utilizing a one-third biasing scheme during the DC I–V characterization. b DC I–V characteristics of 1024 cells in the CA. The black curve marked ① denotes the SET process, while the black curve marked ② denotes the RESET process. c Reading current distributions of each state. The coefficient of variations of the LRS and HRS were 0.057 and 0.06, respectively. d Schematic of the AC-based operations utilizing the biasing scheme. Inhibiting voltages were induced in the unselected cells and had a larger pulse width than the operational voltage. e Electrical pulse-induced behavior of 30 cells in the CA. f Amplitude distributions for the SET and RESET processes. Very low deviation values were observed in each process. The highly uniform electrical characteristics of the CA can be attributed to the nonfilamentary characteristics of our previously developed SRM device.CC BY · PubMed Central
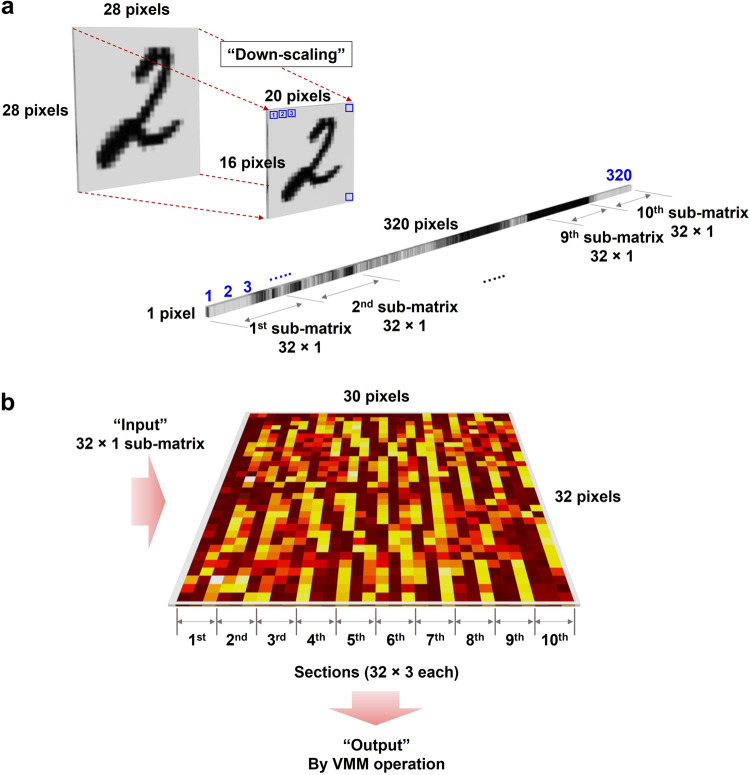
Fig. 3 Overall hardware-based classification process. For hardware-based classification, a 32 × 30 array, representing a partial array of the 1 kb CA, was utilized. To classify the three digits (0, 1, and 2), the 32 × 30 array is partitioned into 10 sets of 32 × 3 matrices. Each column in a submatrix (32 × 1) indicated the three digits 0, 1, and 2. a The training and test (inference) datasets were processed by software simulation. By downscaling the MNIST data, originally consisting of 28 × 28 pixels, to 20 × 16 pixels to fit into the 32 × 30 array. To input the images into array for training and inference tasks, the down-sampled images were converted to 320 × 1 matrix and partitioned into 10 sets of 32 × 1 matrices. The training process was performed using the resized data in the software, and the trained data were converted into target conductance (resistance) values to obtain the distribution of trained weights. Based on these weight values, each cell in the 32 × 30 CA was programmed. b For the inferencing operations, the resized data were converted into 320 × 1 input vectors with binary values of 0 and 1. These input vectors were then converted into voltages and applied to the memristor matrix in 10 sets. The VMM operation was performed, and the maximum values from the 10 sets were classified as the outputs of the inferencing operations. The digit with the maximum output signal was classified according to the max-current sensing rule36.
Fig. 3 Overall hardware-based classification process. For hardware-based classification, a 32 × 30 array, representing a partial array of the 1 kb CA, was utilized. To classify the three digits (0, 1, and 2), the 32 × 30 array is partitioned into 10 sets of 32 × 3 matrices. Each column in a submatrix (32 × 1) indicated the three digits 0, 1, and 2. a The training and test (inference) datasets were processed by software simulation. By downscaling the MNIST data, originally consisting of 28 × 28 pixels, to 20 × 16 pixels to fit into the 32 × 30 array. To input the images into array for training and inference tasks, the down-sampled images were converted to 320 × 1 matrix and partitioned into 10 sets of 32 × 1 matrices. The training process was performed using the resized data in the software, and the trained data were converted into target conductance (resistance) values to obtain the distribution of trained weights. Based on these weight values, each cell in the 32 × 30 CA was programmed. b For the inferencing operations, the resized data were converted into 320 × 1 input vectors with binary values of 0 and 1. These input vectors were then converted into voltages and applied to the memristor matrix in 10 sets. The VMM operation was performed, and the maximum values from the 10 sets were classified as the outputs of the inferencing operations. The digit with the maximum output signal was classified according to the max-current sensing rule36.CC BY · PubMed Central
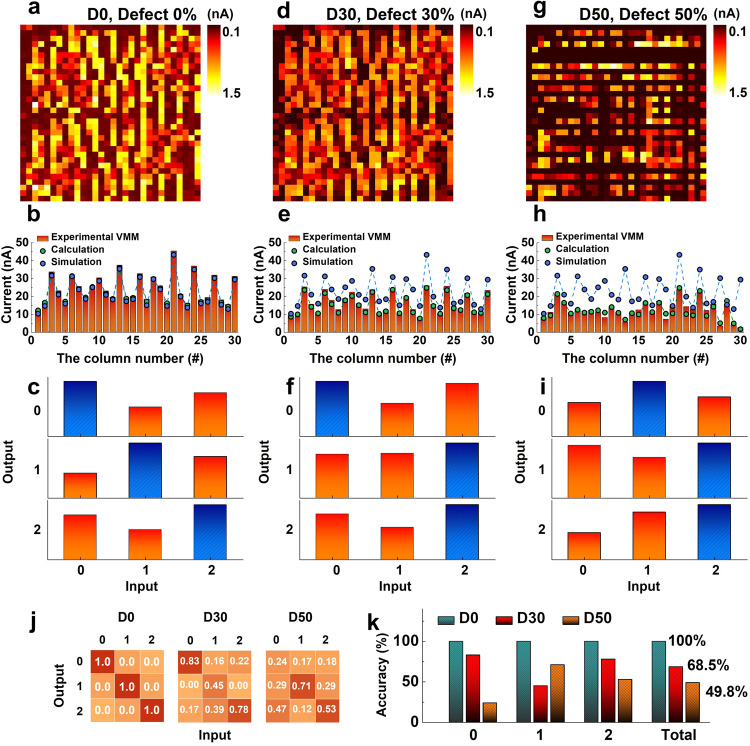
Fig. 4 Fully hardware-based demonstration of a single-layer neural network for MNIST data classification and investigation of the impact of the defectiveness of the CA on the classification accuracy. a Trained weight-mapping results of the D0 CA. After the training process, all cells in the CA were read out at a 2 V reading voltage. b VMM operation results of the D0 CA focusing on three parameters: VMM operation results (red bars), trained weight summations (green circles), and simulated weight summations (blue circles). The discrepancy between the VMM operation results and calculated values indicates the feasibility of the VMM operation, while the difference between the VMM operation results and the simulated values indicates the training accuracy. c Experimental demonstration of the fully hardware-based classification of the MNIST data using the D0 CA. One of the classification results was showcased by following the max-current sensing rule. The classification result is indicated by the blue bars, which represent the maximum values of the sensed signals. d Trained weight-mapping results, (e) VMM results focusing on the three parameters described in (b), and (f) representative classification results of the D30 CA. While the digits 0 and 2 were classified correctly, the digit 1 was misclassified as 2. g Trained weight-mapping results, h VMM results focusing on the three parameters described in (b), and (i) representative classification results of the D50 CA. j Classification accuracy for each digit based on 1500 classifications. The classification accuracy of the D0, D30, and D50 CAs for each digit is shown from left to right. k Classification accuracies for each digit in different defective CAs and the total classification accuracy. The total accuracies for each defective CA indicated that 100% accuracy was achieved in the D0 CA. However, the accuracies decreased to 68.5% in the D30 CA and 49.8% in the D50 CA. These results demonstrate the practical impact of defects in the CA, particularly open-circuit defects, which significantly degrade the classification accuracy.
Fig. 4 Fully hardware-based demonstration of a single-layer neural network for MNIST data classification and investigation of the impact of the defectiveness of the CA on the classification accuracy. a Trained weight-mapping results of the D0 CA. After the training process, all cells in the CA were read out at a 2 V reading voltage. b VMM operation results of the D0 CA focusing on three parameters: VMM operation results (red bars), trained weight summations (green circles), and simulated weight summations (blue circles). The discrepancy between the VMM operation results and calculated values indicates the feasibility of the VMM operation, while the difference between the VMM operation results and the simulated values indicates the training accuracy. c Experimental demonstration of the fully hardware-based classification of the MNIST data using the D0 CA. One of the classification results was showcased by following the max-current sensing rule. The classification result is indicated by the blue bars, which represent the maximum values of the sensed signals. d Trained weight-mapping results, (e) VMM results focusing on the three parameters described in (b), and (f) representative classification results of the D30 CA. While the digits 0 and 2 were classified correctly, the digit 1 was misclassified as 2. g Trained weight-mapping results, h VMM results focusing on the three parameters described in (b), and (i) representative classification results of the D50 CA. j Classification accuracy for each digit based on 1500 classifications. The classification accuracy of the D0, D30, and D50 CAs for each digit is shown from left to right. k Classification accuracies for each digit in different defective CAs and the total classification accuracy. The total accuracies for each defective CA indicated that 100% accuracy was achieved in the D0 CA. However, the accuracies decreased to 68.5% in the D30 CA and 49.8% in the D50 CA. These results demonstrate the practical impact of defects in the CA, particularly open-circuit defects, which significantly degrade the classification accuracy.CC BY · PubMed Central
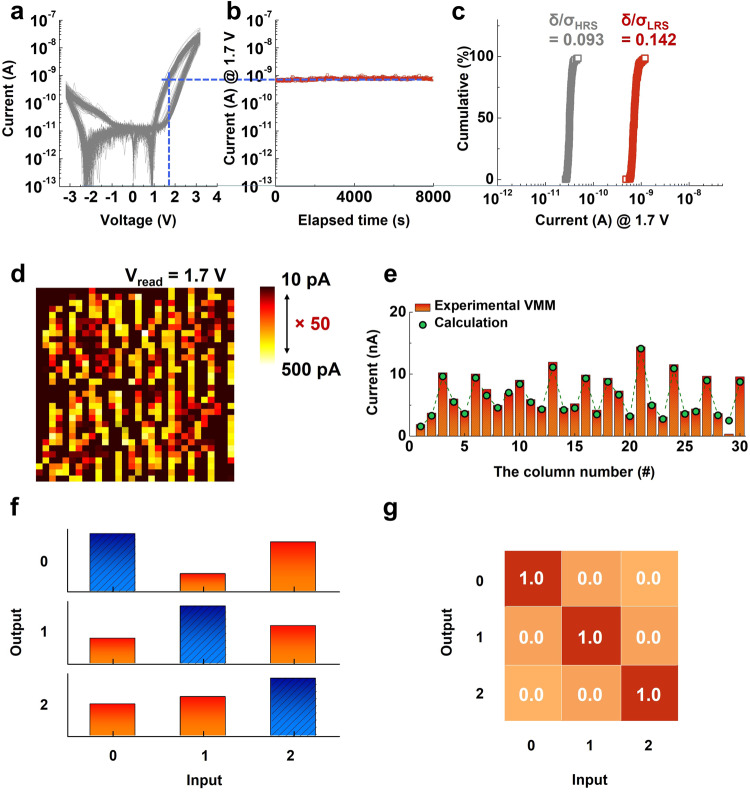
Fig. 5 Investigation of the impact of the read margin on classification accuracy. a DC I–V characteristics of the SRM-integrated CA, and (b) retention characteristics measured at a reading voltage of 1.7 V. Robust nonvolatility was observed at1.7 V. c Read current distributions of the LRS and HRS at 1.7 V. The coefficient of variations of the HRS and LRS (0.093 and 0.142, respectively) were relatively low. d Trained weight-mapping results obtained at a reading voltage of 1.7 V. e Comparison of the VMM operation results and calculated weight summations in each column. The feasibility of VMM operations using a 1.7 V reading voltage was confirmed. f Representative classification results of the CA under a 1.7 V reading voltage, and (g) total classification accuracy for each digit. All digits were classified accurately (1500 classification operations). Comparison of the two different reading margins (×50 @ 1.7 V and ×15 @ 2.0 V) revealed that the reading margin of the nonfilamentary-type memristor had an insignificant effect on the classification accuracy because of its highly uniform operating characteristics.
Fig. 5 Investigation of the impact of the read margin on classification accuracy. a DC I–V characteristics of the SRM-integrated CA, and (b) retention characteristics measured at a reading voltage of 1.7 V. Robust nonvolatility was observed at1.7 V. c Read current distributions of the LRS and HRS at 1.7 V. The coefficient of variations of the HRS and LRS (0.093 and 0.142, respectively) were relatively low. d Trained weight-mapping results obtained at a reading voltage of 1.7 V. e Comparison of the VMM operation results and calculated weight summations in each column. The feasibility of VMM operations using a 1.7 V reading voltage was confirmed. f Representative classification results of the CA under a 1.7 V reading voltage, and (g) total classification accuracy for each digit. All digits were classified accurately (1500 classification operations). Comparison of the two different reading margins (×50 @ 1.7 V and ×15 @ 2.0 V) revealed that the reading margin of the nonfilamentary-type memristor had an insignificant effect on the classification accuracy because of its highly uniform operating characteristics.CC BY · PubMed Central
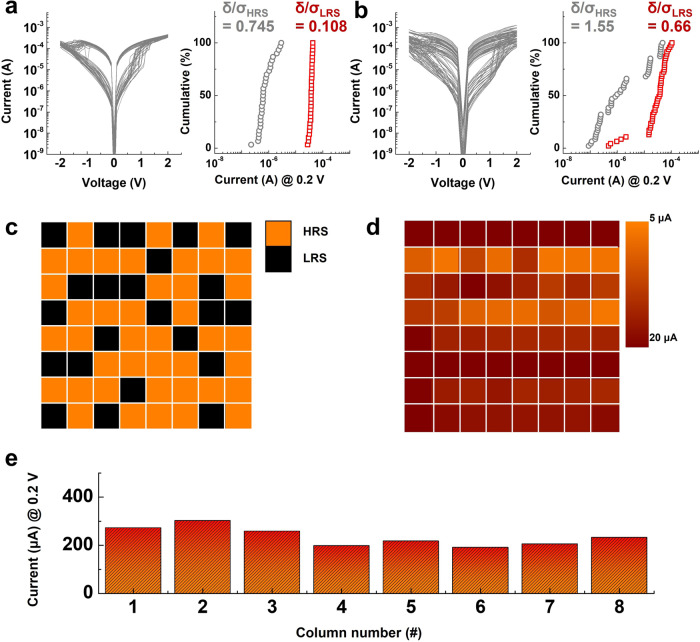
Fig. 6 Investigation of the impacts of a non-selective memristor integrated into the passive CA on VMM operation accuracy. a DC I–V characteristics of a unit memristor device without selection functionality (left). Ten randomly chosen cells were measured over three cycles (total number of DC I–V curves: 30). The read current distributions of each state were extracted from the DC I–V curves (right). b DC I–V characteristics of an 8 × 8 CA integrated with the memristor. All cells in the CA were measured in one cycle in DC I–V sweep mode (graph). The read current distributions of each state were extracted from the DC I–V curve (right). c Programming scheme of the 8 × 8 CA. A total of 32 randomly chosen cells were programmed to the LRS (black), and the rest of the cells were maintained in the HRS (orange). d Resistance distribution of the 8 × 8 CA after the programming step. The programmed weight values of the CA were not coincident with the proposed programming scheme, indicating that programming and reading were not processed accurately owing to sneak current effects. e Results of VMM operations using the 8 × 8 CA. Nearly identical output currents were observed in each column, which implies that the VMM operation was not processed accurately because of significant interferences between integrated cells in the CA.
Fig. 6 Investigation of the impacts of a non-selective memristor integrated into the passive CA on VMM operation accuracy. a DC I–V characteristics of a unit memristor device without selection functionality (left). Ten randomly chosen cells were measured over three cycles (total number of DC I–V curves: 30). The read current distributions of each state were extracted from the DC I–V curves (right). b DC I–V characteristics of an 8 × 8 CA integrated with the memristor. All cells in the CA were measured in one cycle in DC I–V sweep mode (graph). The read current distributions of each state were extracted from the DC I–V curve (right). c Programming scheme of the 8 × 8 CA. A total of 32 randomly chosen cells were programmed to the LRS (black), and the rest of the cells were maintained in the HRS (orange). d Resistance distribution of the 8 × 8 CA after the programming step. The programmed weight values of the CA were not coincident with the proposed programming scheme, indicating that programming and reading were not processed accurately owing to sneak current effects. e Results of VMM operations using the 8 × 8 CA. Nearly identical output currents were observed in each column, which implies that the VMM operation was not processed accurately because of significant interferences between integrated cells in the CA.CC BY · PubMed Central

Verification

Claims the paper makes

The claims and statistics of this paper haven’t been checked yet.

Run the check — free, no account needed. It reads the open-access text and checks the sources it cites.

A few free checks a day · papers already verified open instantly · results are public

Claims other papers make about this one

Each is checked against this paper’s own text: does it say what the citing paper says it does?

Self-check

Percentages, sums and reported differences re-computed from the paper’s own numbers.

The self-check needs the paper’s full text.

Citations

Cites

Show all 56 references

Research works printed but not linked: 8

  1. Hertz, J., Krogh, A. & Palmer, R. G. Introduction of Neural Computation (Perseus, Cambridge, MA, 1991).
  2. Hubara, I., Courbariaux, M., Soudry, D., El-Yaniv, R. & Bengio, Y. Quantized Neural Network. Training neural networks with low precision weights and activations. J. Mach. Learn. Res. (JMLR) 18, 1–30 (2018).
  3. Han, S., Mao, H. & Dally, W. J. Deep compression: Compressing deep neural networks with pruning, trained quantization and huffman coding. arXiv preprint arXiv:1510.00149. (2015). · arXiv
  4. Zhu, C., Han, S., Mao, H. & Dally, W. J. Trained ternary quantization. arXiv preprint arXiv:1612.01064. (2016). · arXiv
  5. Howard, A. G. et al. MobileNets: Efficient Convolutional Neural Networks for Mobile Vision Applications. arXiv:1704.04861, (2017). · arXiv
  6. Lee, S. et al. Hardware architecture and software stack for PIM based on commercial DRAM technology: Industrial product. in Ac. Med. 48th Annual International Symposium on Computer Architecture (ISCA) 43–56 (IEEE, 20212021).
  7. Courbariaux, M., Hubara, I., Soudry, D., El-Yaniv, R. & Bengio, Y. Binarized neural networks: Training deep neural networks with weights and activations constrained to+ 1 or-1. arXiv preprint arXiv:1602.02830 (2016). · arXiv
  8. Li, Y., Liu, Z., Xu, K., Yu, H. & Ren, F. A GPU-outperforming FPGA accelerator architecture for binary convolutional neural networks. J. Emerg. Technol. Comput. Syst. 14, 1–16 (2018).

Cited by

Sorted by citations

Items 101–108 of 108

Metadata

Authors
Jeon, K., Ryu, J. J., Im, S., Seo, H. K., Eom, T., Ju, H., Yang, M. K., Jeong, D. S., & Kim, G. H.
Affiliations
  • Korea Research Institute of Chemical Technology (KR)
  • Yonsei University (KR)
  • Korea Institute of Science and Technology (KR)
  • Sahmyook University (KR)
  • Hanyang University (KR)
Corresponding author
  • Ju, Hyunsu
  • Yang, Min Kyu
  • Jeong, Doo Seok
  • Kim, Gun Hwan
Venue
Nature Communications
Published
2024-01-02
Volume
15
Issue
1
Pages
129-129
ISSN
2041-1723 (ISSN-L)
OpenAlex
W4390502105
Cited by
108
References
56
Citations by year
2026: 33 · 2025: 48 · 2024: 27
FWCI
11.17
Type
journal article
Language
en
Open access
Locations
  • Nature Communications (publishedVersion, cc-by)
  • PubMed Central (publishedVersion, cc-by)
  • PubMed (publishedVersion)
  • RePEc: Research Papers in Economics (submittedVersion)
  • DOAJ (DOAJ: Directory of Open Access Journals) (submittedVersion, cc-by-sa)
Funders
  • Ministry of Culture, Sports and Tourism (CR202104002)
  • Korea Institute of Science and Technology (2E32242)
Topics
  • Physical Sciences › Engineering › Electrical and Electronic Engineering › Advanced Memory and Neural Computing
  • Physical Sciences › Computer Science › Artificial Intelligence › Neural Networks and Applications
  • Physical Sciences › Computer Science › Artificial Intelligence › Neural Networks and Reservoir Computing
Keywords
memristors, self-rectifying memristors, defect tolerance, image classification

About these checks

Registry, retraction, Cites and statistics results are computed, not judged, with one exception: a printed reference that no index lists is read once by a model before it counts as a citation error. Claims are extracted by a model and kept only when their quote appears verbatim in the text; each cited source is then checked, with a model’s help, for whether it says what the claim relies on. Those verdicts can be wrong — read the claim’s quote and the cited source before relying on one.

Statistics and arithmetic are recomputed, not judged.

Confidence bands are shown only for fields calibrated on our annotated test set. None is calibrated yet, so no band is shown.

What counts as a claim ›How we measure confidence ›How we check this ›

Are you an author, or do you see a problem with this page? Request a review