

The DOI matches its Crossref record; 56 of the 56 references it cites were found in a registry or an index.
Large language models streamline automated machine learning for clinical studies
Open accessAbstract
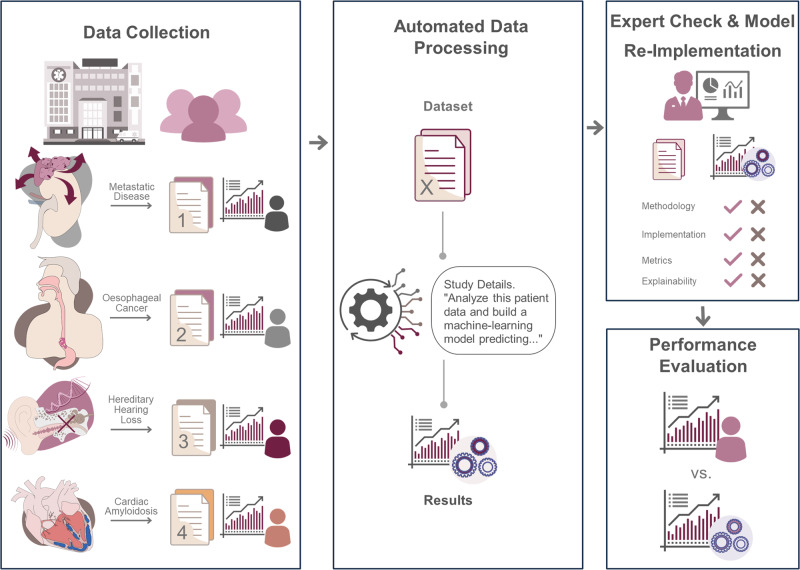
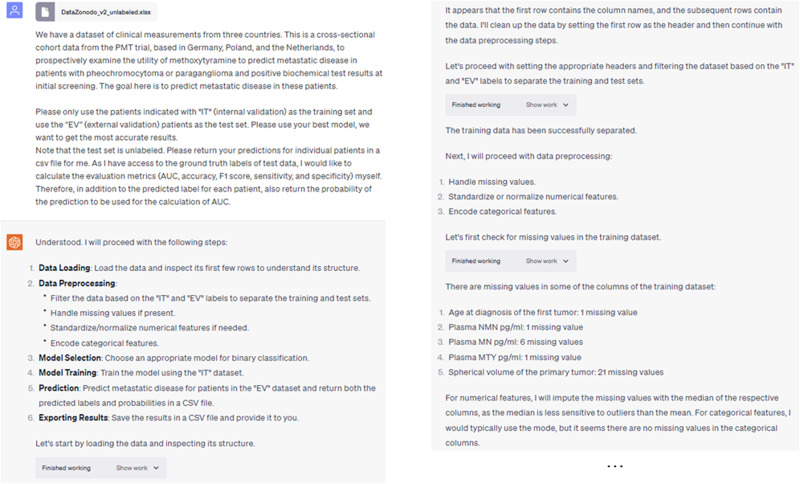
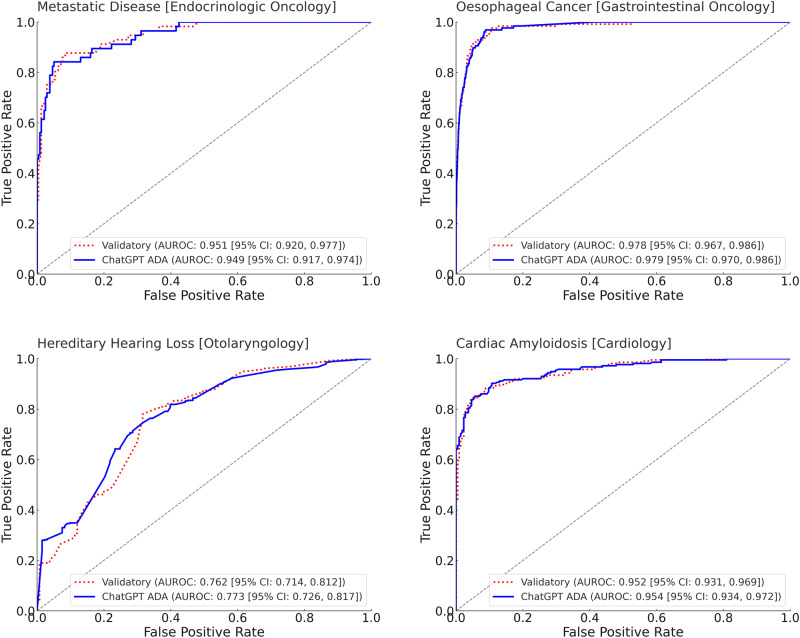
A knowledge gap persists between machine learning (ML) developers (e.g., data scientists) and practitioners (e.g., clinicians), hampering the full utilization of ML for clinical data analysis. We investigated the potential of the ChatGPT Advanced Data Analysis (ADA), an extension of GPT-4, to bridge this gap and perform ML analyses efficiently. Real-world clinical datasets and study details from large trials across various medical specialties were presented to ChatGPT ADA without specific guidance. ChatGPT ADA autonomously developed state-of-the-art ML models based on the original study’s training data to predict clinical outcomes such as cancer development, cancer progression, disease complications, or biomarkers such as pathogenic gene sequences. Following the re-implementation and optimization of the published models, the head-to-head comparison of the ChatGPT ADA-crafted ML models and their respective manually crafted counterparts revealed no significant differences in traditional performance metrics ( p ≥ 0.072). Strikingly, the ChatGPT ADA-crafted ML models often outperformed their counterparts. In conclusion, ChatGPT ADA offers a promising avenue to democratize ML in medicine by simplifying complex data analyses, yet should enhance, not replace, specialized training and resources, to promote broader applications in medical research and practice.
Overview
The claims and statistics of this paper haven’t been checked yet.
Run the check — free, no account needed. It reads the open-access text and checks the sources it cites.
Integrity signals
Registry
Cites
Statistics
Figures
Verification
Claims the paper makes
The claims and statistics of this paper haven’t been checked yet.
Run the check — free, no account needed. It reads the open-access text and checks the sources it cites.
Claims other papers make about this one
Each is checked against this paper’s own text: does it say what the citing paper says it does?
In the citing paper
“Arasteh et al. used the integrated data analysis tools of an LLM to analyze scientific data, achieving results on par with human researchers19.”
From Development and validation of an autonomous artificial intelligence agent for clinical decision-making in oncology (2025) · cites this paper as [19]
Self-check
Percentages, sums and reported differences re-computed from the paper’s own numbers.
The self-check needs the paper’s full text.
Citations
Cites
Breiman, L. (2001) · Machine Learning · doi:10.1023/a:1010933404324 · Cited by 133,538
Greedy function approximation: A gradient boosting machine
Friedman, J. H. (2001) · The Annals of Statistics · doi:10.1214/aos/1013203451 · Cited by 30,731
A decision-theoretic generalization of on-line learning and an application to boosting
Freund, Y., & Schapire, R. E. (1997) · Journal of Computer and System Sciences · doi:10.1006/jcss.1997.1504 · Cited by 20,466
A training algorithm for optimal margin classifiers
Boser, B. E., Guyon, I. M., & Vapnik, V. N. (1992) · Proceedings of the fifth annual workshop on Computational learning theory · doi:10.1145/130385.130401 · Cited by 11,992
Barredo Arrieta, A., Díaz-Rodríguez, N., Del Ser, J., Bennetot, A., Tabik, S., Barbado, A., Garcia, S., Gil-Lopez, S., Molina, D., Benjamins, R., et al. (2020) · Information Fusion · doi:10.1016/j.inffus.2019.12.012 · Cited by 10,423
Multivariate Adaptive Regression Splines
Friedman, J. H. (1991) · The Annals of Statistics · doi:10.1214/aos/1176347963 · Cited by 8,108
Kung, T. H., Cheatham, M., Medenilla, A., Sillos, C., De Leon, L., Elepaño, C., Madriaga, M., Aggabao, R., Diaz-Candido, G., Maningo, J., et al. (2023) · PLOS Digital Health · doi:10.1371/journal.pdig.0000198 · Cited by 4,115
Large language models encode clinical knowledge
Singhal, K., Azizi, S., Tu, T., Mahdavi, S. S., Wei, J., Chung, H. W., Scales, N., Tanwani, A., Cole-Lewis, H., Pfohl, S., et al. (2023) · Nature · doi:10.1038/s41586-023-06291-2 · Cited by 4,083
Large Language Models Encode Clinical Knowledge
Singhal, K., Azizi, S., Tu, T., Mahdavi, S. S., Wei, J., Chung, H. W., Scales, N., Tanwani, A., Cole-Lewis, H., Pfohl, S., et al. (2022) · arXiv · doi:10.48550/arxiv.2212.13138 · Cited by 4,083
Large language models in medicine
Thirunavukarasu, A. J., Ting, D. S. J., Elangovan, K., Gutierrez, L., Tan, T. F., & Ting, D. S. W. (2023) · Nature Medicine · doi:10.1038/s41591-023-02448-8 · Cited by 3,944
Research works printed but not linked: 2
- Ke, G. et al. LightGBM: A highly efficient gradient boosting decision tree. in Advances in Neural Information Processing Systems 30. 3149–3157 (NIPS, 2017).
- Lundberg, S. & Lee, S.-I. A Unified Approach to Interpreting Model Predictions. in Proceedings of the 31st International Conference on Neural Information Processing Systems. 4768–4777. https://doi.org/10.5555/3295222.3295230 (NIPS, 2017). · DOI
Cited by
Sorted by citations
Ferber, D., El Nahhas, O. S. M., Wölflein, G., Wiest, I. C., Clusmann, J., Leßmann, M.-E., Foersch, S., Lammert, J., Tschochohei, M., Jäger, D., et al. (2025) · Nature Cancer · doi:10.1038/s43018-025-00991-6 · Cited by 175
Self-citationGenerative artificial intelligence in medicine
Teo, Z. L., Thirunavukarasu, A. J., Elangovan, K., Cheng, H., Moova, P., Soetikno, B., Nielsen, C., Pollreisz, A., Ting, D. S. J., Morris, R. J. T., et al. (2025) · Nature Medicine · doi:10.1038/s41591-025-03983-2 · Cited by 119
Chatlaw: A Multi-Agent Legal Assistant based on a Role-Aligned Mixture-of-Experts Architecture
Cui, J., Ning, M., Li, Z., Li, H., Yang, Y., Chen, B., Ling, B., Tian, Y., & Yuan, L. (2026) · Fundamental Research · doi:10.1016/j.fmre.2026.03.026 · Cited by 519
Zhang, C., Xu, Q., Yu, Y., Zhou, G., Zeng, K., Chang, F., & Ding, K. (2024) · Robotics and Computer-Integrated Manufacturing · doi:10.1016/j.rcim.2024.102883 · Cited by 101
Luo, X., Tham, Y. C., Giuffrè, M., Ranisch, R., Daher, M., Lam, K., Eriksen, A. V., Hsu, C.-W., Ozaki, A., de Moraes, F. Y., et al. (2025) · BMJ Evidence-Based Medicine · doi:10.1136/bmjebm-2025-113825 · Cited by 110
Chow, J. C. L., & Li, K. (2024) · JMIR Bioinformatics and Biotechnology · doi:10.2196/64406 · Cited by 75
Expert-Guided Large Language Models for Clinical Decision Support in Precision Oncology
Lammert, J., Dreyer, T. F., Mathes, S., Kuligin, L., Borm, K. J., Schatz, U. A., Kiechle, M. B., Lörsch, A. M., Jung, J., Lange, S., et al. (2024) · JCO Precision Oncology · doi:10.1200/po-24-00478 · Cited by 73
Self-citationLarge language model integrations in cancer decision-making: a systematic review and meta-analysis
Hao, Y., Qiu, Z., Holmes, J., Löckenhoff, C. E., Liu, W., Ghassemi, M., & Kalantari, S. (2025) · npj Digital Medicine · doi:10.1038/s41746-025-01824-7 · Cited by 67
Equity and reliability of public electric vehicle charging stations in the United States
Yu, Q., Que, T., Cushing, L. J., Pierce, G., Shen, K., Kejriwal, M., Yao, Y., & Zhu, Y. (2025) · Nature Communications · doi:10.1038/s41467-025-60091-y · Cited by 75
Omar, M., Agbareia, R., Glicksberg, B. S., Nadkarni, G. N., & Klang, E. (2025) · JMIR Medical Informatics · doi:10.2196/66917 · Cited by 53
Buess, L., Keicher, M., Navab, N., Maier, A., & Arasteh, S. T. (2025) · Biomedical Engineering Letters · doi:10.1007/s13534-025-00497-1 · Cited by 79
Ma, Y., Zheng, S., Yang, Z., Pan, H., & Hong, J. (2025) · International Journal of Production Research · doi:10.1080/00207543.2025.2472298 · Cited by 65
A strategy for cost-effective large language model use at health system-scale
Klang, E., Apakama, D. U., Abbott, E. E., Vaid, A., Lampert, J. M., Sakhuja, A., Freeman, R., Charney, A. W., Reich, D. L., Kraft, M., et al. (2024) · npj Digital Medicine · doi:10.1038/s41746-024-01315-1 · Cited by 56
Examining human-AI interaction in real-world healthcare beyond the laboratory
Wekenborg, M., Gilbert, S., & Kather, J. N. (2025) · npj Digital Medicine · doi:10.1038/s41746-025-01559-5 · Cited by 54
Self-citationEnhancing LLMs for Power System Simulations: A Feedback-Driven Multi-Agent Framework
Jia, M., Cui, Z., & Hug, G. (2025) · IEEE Transactions on Smart Grid · doi:10.1109/tsg.2025.3589114 · Cited by 42
RadioRAG: Online Retrieval–Augmented Generation for Radiology Question Answering
Arasteh, S. T., Lotfinia, M., Bressem, K. K., Siepmann, R. M., Adams, L. C., Ferber, D., Kuhl, C. K., Kather, J. N., Nebelung, S., & Truhn, D. (2025) · Radiology Artificial Intelligence · doi:10.1148/ryai.240476 · Cited by 53
Self-citationUse of artificial intelligence for liver diseases: A survey from the EASL congress 2024
Žigutytė, L., Sorz-Nechay, T., Clusmann, J., & Kather, J. N. (2024) · JHEP Reports · doi:10.1016/j.jhepr.2024.101209 · Cited by 33
Self-citationDifferential privacy for medical deep learning: methods, tradeoffs, and deployment implications
Mohammadi, M., Vejdanihemmat, M., Lotfinia, M., Rusu, M., Truhn, D., Maier, A., & Arasteh, S. T. (2026) · npj Digital Medicine · doi:10.1038/s41746-025-02280-z · Cited by 53
Self-citationA case study on using a large language model to analyze continuous glucose monitoring data
Healey, E., Tan, A. L. M., Flint, K. L., Ruiz, J., & Kohane, I. S. (2025) · Scientific Reports · doi:10.1038/s41598-024-84003-0 · Cited by 29
Generative AI and large language models: A new frontier in reverse vaccinology
Hayawi, K., Shahriar, S., Alashwal, H., & Serhani, M. A. (2024) · Informatics in Medicine Unlocked · doi:10.1016/j.imu.2024.101533 · Cited by 29
How AI agents will change cancer research and oncology
Lee, Y., Ferber, D., Rood, J., Regev, A., & Kather, J. N. (2024) · Nature Cancer · doi:10.1038/s43018-024-00861-7 · Cited by 23
Self-citationReuben, J. S., Meiri, H., & Arien‐Zakay, H. (2024) · Frontiers in Digital Health · doi:10.3389/fdgth.2024.1458811 · Cited by 28
Shikino, K., Shimizu, T., Otsuka, Y., Tago, M., Takahashi, H., Watari, T., Sasaki, Y., Iizuka, G., Tamura, H., Nakashima, K., et al. (2024) · JMIR Medical Education · doi:10.2196/58758 · Cited by 22
Generative Artificial Intelligence in Medicine
Shanmugam, D., Agrawal, M., Movva, R., Chen, I. Y., Ghassemi, M., Jacobs, M. L., & Pierson, E. (2025) · Annual Review of Biomedical Data Science · doi:10.1146/annurev-biodatasci-103123-095332 · Cited by 40
Zhang, X., Wang, R., Zang, C. Z., Song, K. X., Wang, X., & Li, G. (2025) · Composites Part B Engineering · doi:10.1016/j.compositesb.2025.112961 · Cited by 20
A review of ChatGPT in medical education: exploring advantages and limitations
Cheng, Y., & Zhu, L. (2025) · International Journal of Surgery · doi:10.1097/js9.0000000000002505 · Cited by 26
Chen, L., He, P., Zou, J., Zhang, H., Peng, W. G., & Lü, F. (2025) · Chemical Engineering Journal · doi:10.1016/j.cej.2025.165482 · Cited by 19
Multi-step retrieval and reasoning improves radiology question answering with large language models
Wind, S., Sopa, J., Truhn, D., Lotfinia, M., Nguyen, T.-T., Bressem, K. K., Adams, L. C., Rusu, M., Koestler, H., Wellein, G., et al. (2025) · npj Digital Medicine · doi:10.1038/s41746-025-02250-5 · Cited by 29
Self-citationEstimating emissions reductions with carpooling and vehicle dispatching in ridesourcing mobility
Chang, X., Wu, J., Kang, Z., Pan, J., Sun, H., & Lee, D. (2024) · npj Sustainable Mobility and Transport · doi:10.1038/s44333-024-00015-3 · Cited by 18
A perspective for adapting generalist AI to specialized medical AI applications and their challenges
Wang, Z., Wang, H., Danek, B. P., Li, Y., Mack, C. D., Arbuckle, L., Biswal, D., Poon, H., Wang, Y., Rajpurkar, P., et al. (2025) · npj Digital Medicine · doi:10.1038/s41746-025-01789-7 · Cited by 35
Huang, X., Yuan, Y., Liu, J., He, J., Shi, Y., Gao, S., Wu, J., Xu, X., Zhang, H., Li, P., et al. (2025) · National Science Review · doi:10.1093/nsr/nwaf425 · Cited by 17
From Transformers to ChatGPT: An Analysis of Large Language Models Research
Cotfas, L., Sandu, A., Delcea, C., Diaconu, P., Frăsineanu, C., & Stănescu, A. (2025) · IEEE Access · doi:10.1109/access.2025.3600739 · Cited by 21
Fuellen, G., Kulaga, A. Y., Lobentanzer, S., Unfried, M., Avelar, R. A., Palmer, D. H., & Kennedy, B. K. (2024) · Ageing Research Reviews · doi:10.1016/j.arr.2024.102617 · Cited by 15
Bu, D., Sun, J., Li, K., He, Z., Huang, W., Hu, J., Zhang, S., Lei, S., Huo, P., Wang, Z., et al. (2026) · Nature Biomedical Engineering · doi:10.1038/s41551-026-01634-6 · Cited by 22
Artificial intelligence-assisted machine learning models for predicting lung cancer survival
Yuan, Y., Zhang, G.-L., Gu, Y., Hao, S., Huang, C., Xie, H., Mi, W., & Zeng, Y.-C. (2025) · Asia-Pacific Journal of Oncology Nursing · doi:10.1016/j.apjon.2025.100680 · Cited by 16
Leon, M., Ruaengsri, C., Pelletier, G., Bethencourt, D., Shibata, M., Flores, M. Q., & Shudo, Y. (2024) · Journal of Clinical Medicine · doi:10.3390/jcm13216543 · Cited by 12
Jia, M., Cui, Z., & Hug, G. (2026) · IEEE PES International Meeting (PES IM) · doi:10.1109/pesim67009.2026.11438280 · Cited by 21
Dave, M., Tattar, R., Alafaleg, R., Barry, S. M., Ariyaratnam, S., Roudsari, R. V., & Patel, N. (2025) · BDJ · doi:10.1038/s41415-025-8383-2 · Cited by 15
Zhu, L., Rong, Y., McGee, L. A., Rwigema, J. M., & Patel, S. H. (2024) · Cancers · doi:10.3390/cancers16132311 · Cited by 12
Panacea: A foundation model for clinical trial search, summarization, design, and recruitmentPreprint
Lin, J., Xu, H., Wang, Z., Wang, S., & Sun, J. (2024) · medRxiv · doi:10.1101/2024.06.26.24309548 · Cited by 15
Non-coding RNA and drug resistance in head and neck cancer
Zhang, Y., Peng, Y., Lin, B., Yang, S., Deng, F., Yang, X., Li, A., Xia, W., Gao, C., Lei, S., et al. (2024) · Cancer Drug Resistance · doi:10.20517/cdr.2024.59 · Cited by 11
Oncology education in the age of artificial intelligence
Prelaj, A., Scoazec, G., Ferber, D., & Kather, J. N. (2024) · ESMO Real World Data and Digital Oncology · doi:10.1016/j.esmorw.2024.100079 · Cited by 10
Self-citationZhou, H.-Y., Li, Y., Li, J., Meng, J., & Wu, A. (2024) · The Innovation Medicine · doi:10.59717/j.xinn-med.2024.100091 · Cited by 10
Making large language models reliable data science programming copilots for biomedical research
Wang, Z., Danek, B. P., Yang, Z., Chen, Z., & Sun, J. (2026) · Nature Biomedical Engineering · doi:10.1038/s41551-025-01587-2 · Cited by 11
Sharma, P., Basso, B. B., Manuraj, A., Murillo, M. S., Millar, N., Tadiello, T., Sharma, M., Delandmeter, M., & Robertson, G. P. (2026) · Proceedings of the National Academy of Sciences · doi:10.1073/pnas.2524808123 · Cited by 9
The Treasure Trove Hidden in Plain Sight: The Utility of GPT-4 in Chest Radiograph Evaluation
Arasteh, S. T., Siepmann, R. M., Huppertz, M., Lotfinia, M., Puladi, B., Kuhl, C. K., Truhn, D., & Nebelung, S. (2024) · Radiology · doi:10.1148/radiol.233441 · Cited by 8
Self-citationLarge language models to facilitate pregnancy prediction after in vitro fertilization
Cao, P., Acharya, G., Salumets, A., & Esteki, M. Z. (2024) · Acta Obstetricia Et Gynecologica Scandinavica · doi:10.1111/aogs.14989 · Cited by 10
Large Language Models in Randomized Controlled Trials Design: Observational Study
Jin, L., Ong, J. C. L., Elangovan, K., Ke, Y., Pyle, A., Ting, D. S. W., & Liu, N. (2025) · Journal of Medical Internet Research · doi:10.2196/67469 · Cited by 7
Autonomous Self‐Evolving Research on Biomedical Data: The DREAM Paradigm
Deng, L., Wu, Y., Ren, Y., & Lu, H. J. (2025) · Advanced Science · doi:10.1002/advs.202417066 · Cited by 9
The Role of Accuracy and Validation Effectiveness in Conversational Business Analytics
Alparslan, A. (2025) · IEEE Access · doi:10.1109/access.2025.3540975 · Cited by 7
Limited impact of real-world evidence in medical oncology: How can AI turn the tide
Pellat, A., & Kather, J. N. (2025) · European Journal of Cancer · doi:10.1016/j.ejca.2025.115714 · Cited by 6
Self-citationWang, Z., Zhang, R., Ji, C., Zhang, J., Yue, B., & Wang, F. (2025) · World Journal of Gastrointestinal Oncology · doi:10.4251/wjgo.v17.i10.111339 · Cited by 7
Angrisani, M., Casanova, M., Fast, N. J., Narang, J., & Schroeder, J. (2026) · PNAS Nexus · doi:10.1093/pnasnexus/pgag007 · Cited by 7
Analyzing the impact of LLMs in Data Science lifecycle: a systematic mapping study
Chintakunta, S. S., Nascimento, N., & Guimarães, E. T. (2026) · International Journal of Data Science and Analytics · doi:10.1007/s41060-026-01041-9 · Cited by 16
¿Puede engañarnos una IA? Carencias del estudiantado universitario para detectar ChatGPT
González-Geraldo, J. L., & Ortega-López, L. (2024) · Education in the Knowledge Society (EKS) · doi:10.14201/eks.31760 · Cited by 5
Advancing Healthcare with Large Language Models: Techniques and Application
Hu, Z., Peng, Z., Bi, Z., Shen, Q., Liu, Z., Lou, J., & Luo, X. (2025) · IEEE/CAA Journal of Automatica Sinica · doi:10.1109/jas.2025.125540 · Cited by 5
Tsai, C., Hsu, J. S., Chen, P., & Wu, C. (2024) · Expert Review of Molecular Diagnostics · doi:10.1080/14737159.2024.2396866 · Cited by 5
The potential of GPT-4 advanced data analysis for radiomics-based machine learning models
Foltyn‐Dumitru, M., Rastogi, A., Cho, J., Schell, M., Mahmutoglu, M. A., Keßler, T., Sahm, F., Wick, W., Bendszus, M., Brugnara, G., et al. (2024) · Neuro-Oncology Advances · doi:10.1093/noajnl/vdae230 · Cited by 5
Zhao, B., Liu, H., Liu, Q., Qi, W., Zhang, W., Du, J., Jin, Y., & Weng, X. (2024) · The Journal of Infectious Diseases · doi:10.1093/infdis/jiae403 · Cited by 5
Leonardi, S., Distefano, N., & Gruden, C. (2025) · Sustainability · doi:10.3390/su17072988 · Cited by 4
Feng, S., Ding, Z.-R., Cheng, J., & Tu, H. (2025) · World Journal of Gastroenterology · doi:10.3748/wjg.v31.i13.104697 · Cited by 5
Amanatidis, A., Egan, K., Nio, K., & Toma, M. (2025) · Surgeries · doi:10.3390/surgeries6040087 · Cited by 4
Guo, Z., Yang, G., & Wu, W. (2025) · Technological Forecasting and Social Change · doi:10.1016/j.techfore.2025.124370 · Cited by 6
Al-Marridi, A. Z., Said, A. B., Ulde, S. M., & Khwaileh, T. (2025) · Systematic Reviews · doi:10.1186/s13643-025-02895-z · Cited by 7
Two stage multiobjective topology optimization method via SwinUnet with enhanced generalization
Cheng, X., Chen, A., Li, H., Wang, D., Ge, B., & Chang, H. (2025) · Scientific Reports · doi:10.1038/s41598-025-92793-0 · Cited by 5
Data-driven chemical feature extraction and material design for halide solid-state electrolytes
Li, D., Lin, Z., Luo, F., Xiao, C., Dai, Z., Ye, Z., Wang, Q., Guo, Y., & Yang, C. (2026) · eScience · doi:10.1016/j.esci.2026.100590 · Cited by 3
Xin, Z., Zhang, J., Zhang, J., & Liu, Q. (2025) · steel research international · doi:10.1002/srin.202500040 · Cited by 3
Large Language Models in Randomized Controlled Trials DesignPreprint
Liu, N., Jin, L., Ong, J. C. L., Elangovan, K., Ke, Y., Pyle, A., & Ting, D. S. W. (2024) · Research Square · doi:10.21203/rs.3.rs-4254962/v1 · Cited by 3
Coevolution of large language models with physical models boosts advanced battery research
Li, J.-H., Hu, Y., Xia, G., Mo, W., Li, B., Jia, Y., Gao, Y., Xuan, F., Liu, H., & Lian, C. (2025) · Cell Reports Physical Science · doi:10.1016/j.xcrp.2025.102553 · Cited by 2
Diagnostic Analysis Approach to Correlation Maps Through Large Language Models
Dudáš, A., & Vagač, M. (2024) · IEEE International Scientific Conference on Informatics (Informatics) · doi:10.1109/informatics62280.2024.10900889 · Cited by 2
Sarkar, A., Ghosh, E., & Bhattacharjee, S. (2026) · Frontiers in Dental Medicine · doi:10.3389/fdmed.2026.1778372 · Cited by 2
Miller, H. A., Goodin, D. A., & Frieboes, H. B. (2025) · Computer Methods and Programs in Biomedicine · doi:10.1016/j.cmpb.2025.109096 · Cited by 2
Exploring Artificial Intelligence's Potential to Enhance Conventional Anticancer Drug Development
Bobolea, S., Hinoveanu, M. I., Dimitriu, A., Brașoveanu, M., Iliescu, C., Dinu‐Pîrvu, C., Ghica, M. V., Anuța, V., Popa, L., & Prisada, R. M. (2025) · Drug Development Research · doi:10.1002/ddr.70182 · Cited by 2
Wei, Y., Mei, Z., Xie, C., Yuan, F., & Xu, D. (2025) · International Journal of Surgery · doi:10.1097/js9.0000000000003828 · Cited by 2
An LLM agent-based framework for analytical characterization of Nash equilibria
Liu, W., Zhou, X., Wang, X., Cheng, Y., Ye, L., Berry, R., Tassiulas, L., Huang, J., & Zhao, J. (2025) · Nexus · doi:10.1016/j.ynexs.2025.100107 · Cited by 2
Ponon, N. K., & Basani, M. A. R. (2026) · IEEE Open Journal of the Computer Society · doi:10.1109/ojcs.2026.3666345 · Cited by 2
Hasan, U., Algeffari, M., Alhasson, H. F., & Nayeem, M. A. (2026) · Journal of Clinical Medicine · doi:10.3390/jcm15124719 · Cited by 5
An autonomous multimodal AI agent for evidence-grounded ophthalmic diagnosis
Zhao, K., Sun, Q., Kang, D., Yu, T., Han, W., (205074), R. Y., Agrawal, R. V., Ying, G., Grzybowski, A. E., & Jin, K. (2026) · Cell Reports Medicine · doi:10.1016/j.xcrm.2026.102969 · Cited by 2
AI for science: Progress, challenges, and perspectives
Xu, Y., Shao, Z., Liu, X., Li, Y., An, Z., Fu, C., Huang, C., Zhang, L., Gao, F., Li, J., et al. (2026) · The Innovation · doi:10.1016/j.xinn.2026.101530 · Cited by 6
Charting the future of cardiology with large language model artificial intelligence
Wehbe, R. M. (2024) · Nature Reviews Cardiology · doi:10.1038/s41569-024-01105-y · Cited by 2
Berre, C. L., Jairath, V., Panaccione, R., Bourreille, A., Magro, F., Danese, S., & Peyrin‐Biroulet, L. (2025) · Clinical Gastroenterology and Hepatology · doi:10.1016/j.cgh.2025.01.030 · Cited by 2
Miyake, M., Yonemoto, N., Togo, K., Xu, L., Oguri, T., Tanaka, M., Hasegawa, Y., Izawa, Y., & Araki, K. (2025) · JCO Clinical Cancer Informatics · doi:10.1200/cci-24-00249 · Cited by 1
Sun, Y., Chen, Z., Cai, H., & Lü, X. (2025) · International Journal of Medical Informatics · doi:10.1016/j.ijmedinf.2025.106171 · Cited by 1
Wang, Y., Chen, J., Chen, W.-Q., Jiang, X., Ding, C., & Zhu, J. (2025) · Maturitas · doi:10.1016/j.maturitas.2025.108776 · Cited by 1
Schaarup, J. R., Isaksen, A. A., Norman, K., Bjerg, L., & Hulmán, Á. (2025) · BMJ Digital Health & AI · doi:10.1136/bmjdhai-2025-000090 · Cited by 1
Automatic multi-language analysis of SOLID compliance via machine learning algorithms
Balım, C., Karasekreter, N., & Aslan, Ö. (2026) · Information and Software Technology · doi:10.1016/j.infsof.2026.108013 · Cited by 2
Tool-wielding language model-based agent offers conversational exploration of clinical tabular data
Yang, A. J., Woo, J. J., Zhang, R., Mach, A., Ramkumar, P., & Ma, Y. (2026) · npj Artificial Intelligence · doi:10.1038/s44387-025-00070-2 · Cited by 3
Al-Garadi, M. A., Davis, S. E., Matheny, M. E., Westerman, D. M., Conger, A. K., Richmond, B. W., Lasko, T. A., Ricket, I. M., Paulin, L. M., Brown, J. R., et al. (2026) · JMIR Medical Informatics · doi:10.2196/84326 · Cited by 1
Strale, F., German, R. M., Mendes-Kramer, V., Hammer, S. B., Ehrman, R. R., & Sherwin, R. L. (2026) · Cureus · doi:10.7759/cureus.111207 · Cited by 1
Farajiamiri, M., Sopa, J., Afza, S., Adams, L. C., Ordonez, F. B., Nguyen, T.-T., Lotfinia, M., Wind, S., Bressem, K. K., Nebelung, S., et al. (2026) · Patterns · doi:10.1016/j.patter.2026.101639 · Cited by 2
Self-citationResolution-dependent self-supervised transfer in chest radiograph classification
Arasteh, S. T., Shaigan, M., Kuhl, C. K., Kather, J. N., Nebelung, S., & Truhn, D. (2026) · Communications Medicine · doi:10.1038/s43856-026-01897-9 · Cited by 6
Self-citationLeveraging chatgpt’ s advanced data analysis for forensic science research and applications
Li, J., Zhang, S., Gao, Y., Du, Q.-X., Cao, J., & Sun, J. (2025) · Forensic Science Medicine and Pathology · doi:10.1007/s12024-025-01100-w · Cited by 1
Komandur, R., McDunn, J., Nair, N., Fall, B., Dicker, A. P., & Khozin, S. (2025) · doi:10.1101/2025.02.05.25321607 · Cited by 1
Large Language Models in Randomized Controlled Trials Design (Preprint)Preprint
Jin, L., Ong, J. C. L., Elangovan, K., Ke, Y., Pyle, A., Ting, D. S. W., & Liu, N. (2024) · doi:10.2196/preprints.67469
Xu, X., Zheng, S., Yang, L. F., Hao, J., Wang, X., Kang, H., Ma, C., Lü, X., & Li, J. (2025) · Research Square · doi:10.21203/rs.3.rs-5606661/v1
Al-Garadi, M. A., Davis, S. E., Matheny, M. E., Westerman, D. M., Conger, A. K., Richmond, B. W., Lasko, T. A., Ricket, I. M., Paulin, L. M., Brown, J. M., et al. (2025) · medRxiv · doi:10.1101/2025.04.22.25326240
KI in der medizinischen Forschung
Kather, J. N. (2025) · Springer eBooks · doi:10.1007/978-3-662-71042-5_6
Self-citationTechnische Grundlagen der Künstlichen Intelligenz
Kather, J. N. (2025) · Springer eBooks · doi:10.1007/978-3-662-71042-5_2
Self-citationLarge Language Models, argumentation, and healthcare
Fabio Paglieri, A. (2025) · Journal of Argumentation in Context · doi:10.1075/jaic.25024.pag
AI in the discovery and development of antibody therapeutics
Peckner, R., Visweswaraiah, J., & Higginson-Scott, N. (2025) · Elsevier eBooks · doi:10.1016/b978-0-443-29808-0.00034-0
Metadata
- Authors
- Tayebi Arasteh, S., Han, T., Lotfinia, M., Kuhl, C., Kather, J. N., Truhn, D., & Nebelung, S.
- Affiliations
- Universitätsklinikum Aachen (DE)
- University Hospital Heidelberg (DE)
- Corresponding author
- Han, Tianyu
- ORCID
- Venue
- Nature Communications
- Published
- 2024-02-21
- Volume
- 15
- Issue
- 1
- Pages
- 1603-1603
- ISSN
- 2041-1723 (ISSN-L)
- PMC
- PMC10881983
- OpenAlex
- W4392016947
- Cited by
- 114
- References
- 53
- Citations by year
- 2026: 34 · 2025: 53 · 2024: 27
- FWCI
- 10.45
- Type
- journal article
- Language
- en
- Open access
- gold
- doi.org
- Locations
- Nature Communications (publishedVersion, cc-by)
- PubMed Central (publishedVersion, cc-by)
- PubMed (publishedVersion)
- arXiv (Cornell University) (submittedVersion, cc-by-sa)
- RePEc: Research Papers in Economics (submittedVersion)
- DOAJ (DOAJ: Directory of Open Access Journals) (submittedVersion)
- RWTH Publications (RWTH Aachen) (submittedVersion, other-oa)
- arXiv (Cornell University)
- RWTH Publications (RWTH Aachen)
- Funders
- European Commission (101057091)
- Deutsche Forschungsgemeinschaft (TR 1700/7‐1, NE2136/3-1, 2136/3-1)
- Bundesministerium für Bildung und Forschung (01KD2215B, 031L0312A, 01KX2021)
- HORIZON EUROPE Framework Programme (101057091)
- Topics
- Health Sciences › Medicine › Health Informatics › Artificial Intelligence in Healthcare and Education
- Physical Sciences › Computer Science › Artificial Intelligence › Machine Learning in Healthcare
- Health Sciences › Health Professions › Health Information Management › Artificial Intelligence in Healthcare
- Keywords
- large language models, ChatGPT, automated machine learning, clinical trials, medical data analysis, GPT-4, clinical outcome prediction, biomarker prediction, tumor progression, model performance comparison
- MeSH terms
- Machine Learning, Algorithms, Humans, Language, Neoplasms, Benchmarking
About these checks
Registry, retraction, Cites and statistics results are computed, not judged, with one exception: a printed reference that no index lists is read once by a model before it counts as a citation error. Claims are extracted by a model and kept only when their quote appears verbatim in the text; each cited source is then checked, with a model’s help, for whether it says what the claim relies on. Those verdicts can be wrong — read the claim’s quote and the cited source before relying on one.
Statistics and arithmetic are recomputed, not judged.
Confidence bands are shown only for fields calibrated on our annotated test set. None is calibrated yet, so no band is shown.
What counts as a claim ›How we measure confidence ›How we check this ›
Are you an author, or do you see a problem with this page? Request a review
