

The DOI matches its Crossref record; 79 of the 79 references it cites were found in a registry or an index; 29 of the 36 sources its claims cite were checked for support.
Data leakage inflates prediction performance in connectome-based machine learning models
Open accessPublished version of a preprint
Abstract
Predictive modeling is a central technique in neuroimaging to identify brain-behavior relationships and test their generalizability to unseen data. However, data leakage undermines the validity of predictive models by breaching the separation between training and test data. Leakage is always an incorrect practice but still pervasive in machine learning. Understanding its effects on neuroimaging predictive models can inform how leakage affects existing literature. Here, we investigate the effects of five forms of leakage-involving feature selection, covariate correction, and dependence between subjects-on functional and structural connectome-based machine learning models across four datasets and three phenotypes. Leakage via feature selection and repeated subjects drastically inflates prediction performance, whereas other forms of leakage have minor effects. Furthermore, small datasets exacerbate the effects of leakage. Overall, our results illustrate the variable effects of leakage and underscore the importance of avoiding data leakage to improve the validity and reproducibility of predictive modeling.
Overview
CoChat Summary
TL;DR
This paper evaluates five forms of data leakage in connectome-based machine learning across four datasets and three phenotypes, showing that feature selection and repeated-subject leakage inflate prediction performance while other forms have minor or deflationary effects. Leakage effects are larger in small samples and can also alter model interpretation.
Key findings
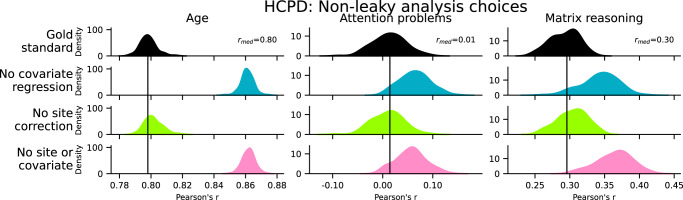
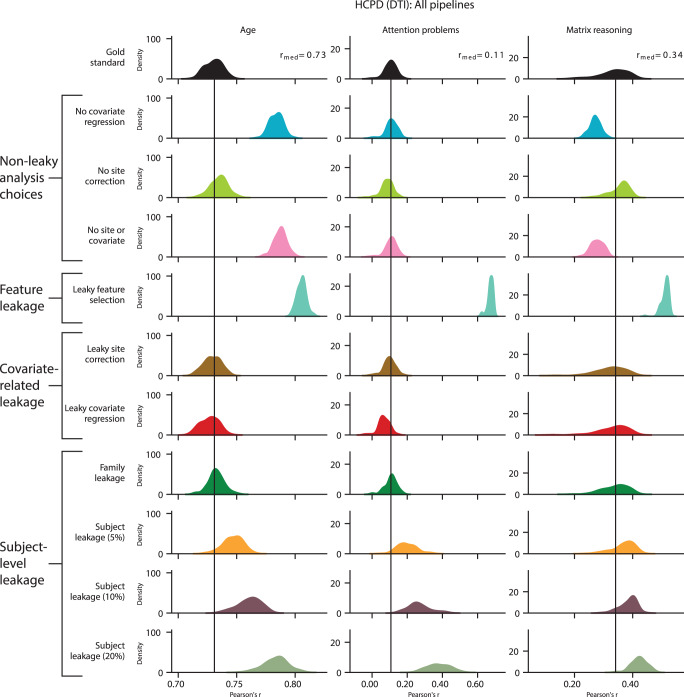
- Feature leakage inflated prediction performance in HCPD: Δr = 0.03 for age, Δr = 0.17 for matrix reasoning, and Δr = 0.47 for attention problems; attention problems went from chance-level (r = 0.01, q2 = −0.13) to moderate (r = 0.48, q2 = 0.22).
- Subject leakage with 20% repeated subjects inflated performance in HCPD: Δr = 0.28 for attention problems, Δr = 0.04 for age, and Δr = 0.14 for matrix reasoning; across all datasets and phenotypes, subject leakage (20%) gave Δr = 0.06–0.29 and Δq2 = 0.03–0.24.
- Leaky covariate regression was the only form that consistently deflated performance: in HCPD, Δr = −0.06 for attention problems, −0.02 for age, and −0.09 for matrix reasoning; across datasets, Δr = −0.09–0.00 and Δq2 = −0.17–0.00. Leaky site correction and family leakage had little to no effect.
- Small samples increased leakage variability: for ABCD matrix reasoning, family leakage Δr ranged from −0.34 to 0.25 at N = 100 versus −0.12 to 0.13 at N = 400; taking medians over multiple k-fold iterations reduced but did not eliminate leakage effects.
Methods
- Four datasets were used: ABCD (N = 7822–7969), HBN (N = 1024–1201), HCPD (N = 424–605), and PNC (N = 1119–1126), predicting age, attention problems, and matrix reasoning from functional connectomes; structural connectomes were also analyzed in 635 HCPD participants.
- The main model was ridge regression with 5-fold cross-validation, 5% feature selection, and a grid search for the L2 regularization parameter; the gold standard included cross-validated covariate regression, site correction with ComBat, and family-aware splits where applicable. Over 400 pipelines tested feature leakage, covariate-related leakage, and subject-level leakage, with sensitivity analyses using SVR and CPM.
- Performance was evaluated with Pearson’s r and cross-validation R2 (q2) over 100 random seeds; sample-size analyses resampled N = 100, 200, 300, and 400 with 10 resamples and 10 iterations of 5-fold cross-validation, and model coefficients were compared between leaky and non-leaky pipelines.
Limitations
- The paper states it cannot cover all leakage forms, including hyperparameter selection leakage, temporal leakage, unsupervised dimensionality reduction, phenotype standardization, and illegitimate features; it also studied child, adolescent, and young adult cohorts in well-harmonized datasets, so other populations or dataset qualities could alter leakage effects.
- The paper notes leakage is not always well-defined and can be application-dependent, and that effects were tested in only three phenotypes, which do not comprehensively cover all effect sizes; complex models such as neural networks may be more susceptible to leakage.
- Evident from the text: many leakage types had little to no effect in these large, harmonized datasets, so results may not generalize to other datasets or pipelines; family leakage analyses were limited by the small proportion of multi-member families in the full datasets, and subject leakage was operationalized as exact scan duplication rather than longitudinal or repeated-measurement designs.
Model-written summary. Check it against the paper before relying on it.
Integrity signals
Registry
Cites
Statistics
Figures



Verification
Claims the paper makes
19 Valid · 1 Not valid · 3 Not checked · 99 Own results and interpretations
At least one cited source doesn’t support this claim or points to a different paper, and none confirmed it — see the verdicts below.
In the paper
“For example, regressing the covariates/confounds out of the whole dataset in a non-cross-validated manner has been shown to negatively affect prediction performance40.”
§ Data leakage inflates prediction performance in connectome-based machine learning models > Methods > Covariate-related leakage
What the sources say
- Disputedcites [40] Chyzhyk, D., Varoquaux, G., Milham, M. & Thirion, B. How to remove or control confounds in predictive models, with applications to brain biomarkers. Gigascience 11, giac014 (2022). sourceExperimental — accuracy not yet measured
The Results of the Empirical Study (Experiments on resting-state fMRI data; page not provided) identify removing a confound’s effect from the full dataset as jointly deconfounding the test and training sets, and report that it had little effect on prediction performance across all datasets. The performance decreases described there concern different approaches, including out-of-sample deconfounding. (LLM, conf=0.88)
Checked by a reasoning model — may be wrong.
plainstates a cause- Asserted: passes — The authors put it forward as true.
- Checkable: passes — It can be checked against evidence.
- Load-bearing: passes — The paper’s conclusions depend on it.
- Based: passes — The paper gives a reason why it holds.
- Disputed
Every source the paper cites for this claim was checked and supports it.
In the paper
“Concerns about reproducibility in machine learning17 can be partially attributed to leakage.”
§ Data leakage inflates prediction performance in connectome-based machine learning models > Discussion
What the sources say
- Supportedcites [17] Kapoor, S. & Narayanan, A. Leakage and the reproducibility crisis in machine-learning-based science. Patterns 4, 100804 (2023). source
The Introduction says the paper investigates reproducibility issues in ML-based science resulting from data leakage. Its survey identifies leakage affecting 294 papers across 17 fields, supporting the claim that leakage accounts for some reproducibility concerns. (LLM, conf=0.92)
plainstates a possible cause- Asserted: passes — The authors put it forward as true.
- Checkable: passes — It can be checked against evidence.
- Load-bearing: unclear — It is unclear whether the paper’s conclusions depend on it.
- Based: passes — The paper gives a reason why it holds.
- Supported
Every source the paper cites for this claim was checked and supports it.
In the paper
“Interestingly, performing covariate regression itself may lead to leakage41 and is another consideration when deciding whether and how to implement covariate regression.”
§ Data leakage inflates prediction performance in connectome-based machine learning models > Discussion
What the sources say
- Supportedcites [41] Hamdan, S. et al. Confound-leakage: confound removal in machine learning leads to leakage. arXiv https://doi.org/10.48550/arXiv.2210.09232 (2022). source
The Introduction (p. 3) says the authors found strong evidence for confound-leakage after confound removal. The clinical analysis (p. 6) reports potential leakage following featurewise confound regression, and the Discussion (p. 6) describes mechanisms by which it can occur. This supports the citing sentence’s qualified claim that covariate regression may lead to leakage. (LLM, conf=0.94)
hedgedstates a possible cause- Asserted: passes — The authors put it forward as true.
- Checkable: passes — It can be checked against evidence.
- Load-bearing: unclear — It is unclear whether the paper’s conclusions depend on it.
- Based: passes — The paper gives a reason why it holds.
- Supported
The cited sources support only part of this claim — read each source’s verdict below.
In the paper
“Our results corroborate previous works, suggesting that covariate regression must be performed within the cross-validation loop to avoid false deflation of effect sizes38–40.”
§ Data leakage inflates prediction performance in connectome-based machine learning models > Discussion
What the sources say
- Partly supportedcites [38] Snoek, L., Miletić, S. & Scholte, H. S. How to control for confounds in decoding analyses of neuroimaging data. Neuroimage 184, 741–760 (2019). sourceExperimental — accuracy not yet measured
The Discussion (page unavailable) says that whole-dataset confound regression produced negatively biased model-performance estimates, and that moving regression inside cross-validation overcame this bias. The paper supports the recommendation for decoding performance, but does not establish that covariate regression outside the loop falsely deflates effect sizes generally. (LLM, conf=0.84)
- Partly supportedcites [39] More, S., Eickhoff, S. B., Caspers, J. & Patil, K. R. Machine Learning and Knowledge Discovery in Databases. Applied Data Science and Demo Track. p. 3–18 (Springer International Publishing, 2021). sourceExperimental — accuracy not yet measured
The Experimental Setup (Confound Regression; page unavailable) says that regression before cross-validation causes data leakage, whereas regression fitted within the loop avoids it. The Results (Generalization Performance Estimates; page unavailable) report lower performance estimates with whole-data regression and suggest the within-loop approach is better. The paper does not establish false deflation of effect sizes specifically, and its recommendation is less categorical than “must.” (LLM, conf=0.86)
- Partly supportedcites [40] Chyzhyk, D., Varoquaux, G., Milham, M. & Thirion, B. How to remove or control confounds in predictive models, with applications to brain biomarkers. Gigascience 11, giac014 (2022). sourceExperimental — accuracy not yet measured
The Discussion (‘Approaches must be adapted to out-of-sample settings’; page unavailable) says deconfounding must separate model estimation from test data, rather than use the whole dataset. The Simulated Data results report a false negative from jointly deconfounding train and test data. However, the paper discusses prediction accuracy rather than effect sizes and says that even correctly performed deconfounding can yield pessimistic evaluations; performing it within cross-validation does not necessarily prevent deflation. (LLM, conf=0.86)
hedgedstates a cause- Asserted: passes — The authors put it forward as true.
- Checkable: passes — It can be checked against evidence.
- Load-bearing: passes — The paper’s conclusions depend on it.
- Based: passes — The paper gives a reason why it holds.
- Partly supported
Every source the paper cites for this claim was checked and supports it.
In the paper
“Various forms of unsupervised dimensionality reduction, such as independent component analysis62,63, are popular in neuroimaging and constitute leakage if performed in the combined training and test datasets prior to performing prediction.”
§ Data leakage inflates prediction performance in connectome-based machine learning models > Methods > Selection of forms of leakage
What the sources say
- Supportedcites [62] McKeown, M. J. et al. Analysis of fMRI data by blind separation into independent spatial components. Hum. Brain Mapp. 6, 160–188 (1998). doi:10.1002/(sici)1097-0193(1998)6:3
The superscripts 62,63 sit directly on 'independent component analysis', so what this citation carries is the identification of ICA as an unsupervised dimensionality-reduction method used in neuroimaging. Our copy of McKeown et al. (1998) states exactly that in INDEPENDENT COMPONENT ANALYSIS: the ICA algorithm of Bell and Sejnowski is described as 'an iterative unsupervised neural network learning algorithm' performing 'blind separation' of fMRI signals into maximally independent component maps, and the INTRODUCTION/abstract present it as a method for analysing fMRI data without a priori assumptions. The leakage assertion in the predicate is the citing authors' own methodological claim, not something attributed to this source; our copy contains no discussion of train/test separation or leakage (the only training-subset passage, in the Added noise/Discussion section, concerns jackknife/bootstrap reliability testing, not prediction). (LLM, conf=0.85)
- Supportedcites [63] Chen, S. et al. Group independent component analysis reveals consistent resting-state networks across multiple sessions. Brain Res. 1239, 141–151 (2008). source
The citation is attached to independent component analysis as an example of dimensionality reduction in neuroimaging, not to the sentence’s separate leakage assertion. The Discussion (section 3; page unavailable) describes group ICA of resting-state fMRI data with three data-reduction steps. (LLM, conf=0.90)
plainstates a cause- Asserted: passes — The authors put it forward as true.
- Checkable: passes — It can be checked against evidence.
- Load-bearing: passes — The paper’s conclusions depend on it.
- Based: passes — The paper gives a reason why it holds.
- Supported
72 more claims · 1 with their cited sources checked
Create a free account to see all 122 claims and every source verdict.
- Probably not a substantial claim. 32
- It may state two separate claims as one. 17
- The quote only partly states this claim. 1
Self-check
Percentages, sums and reported differences re-computed from the paper’s own numbers.
Each contradiction between two passages listed here was confirmed by an independent check.
Rated major: it would touch a result — a value a result rests on, reported and recomputed p-values on opposite sides of the significance level, two passages that conflict with no sign which is right, or a cited work retracted before this paper was published.
In the paper
§ Data leakage inflates prediction performance in connectome-based machine learning models > Results > Additional family leakage analyses in ABCD
“we performed 100 iterations of 5-fold cross-validation for all three phenotypes and model types.”
§ Data leakage inflates prediction performance in connectome-based machine learning models > Results > Additional family leakage analyses in ABCD
“The black bar represents the median performance of the gold standard models across random iterations, and the histograms show prediction performance across 100 iterations of 20-fold cross-validation.”
Rated minor: it would not touch a result — a value no result rests on, a p-value that stays on the same side of the significance level, or a conflict that is clerical, resolved elsewhere in the paper, or outside its own findings.
In the paper
§ Data leakage inflates prediction performance in connectome-based machine learning models > Methods > Sample size
“we randomly sampled without replacement N = 100, 200, 300, and 400 participants from ABCD, HBN, HCPD, and HBN.”
§ Data leakage inflates prediction performance in connectome-based machine learning models > Results > Effect of sample size
“All previously presented results investigated the four datasets at their full sample sizes (ABCD: N = 7822–7969, HBN: N = 1024–1201, HCPD: N = 424-605, PNC: N = 1104–1126).”
Rated minor: it would not touch a result — a value no result rests on, a p-value that stays on the same side of the significance level, or a conflict that is clerical, resolved elsewhere in the paper, or outside its own findings.
In the paper
§ Data leakage inflates prediction performance in connectome-based machine learning models > Results
“the Philadelphia Neurodevelopmental Cohort (PNC) Dataset25,26 (N = 1119–1126).”
§ Data leakage inflates prediction performance in connectome-based machine learning models > Methods > Philadelphia Neurodevelopmental Cohort Data
“1104 participants had this measure available, and the mean was 1.03 (s.d. 1.19), with a range of 0–6.”
Rated minor: it would not touch a result — a value no result rests on, a p-value that stays on the same side of the significance level, or a conflict that is clerical, resolved elsewhere in the paper, or outside its own findings.
In the paper
§ Data leakage inflates prediction performance in connectome-based machine learning models > Results > Effect of sample size
“taking the median across 10 iterations resulted in a slightly smaller range of Δr values for all forms of leakage (N = 400)”
§ Data leakage inflates prediction performance in connectome-based machine learning models > Results > Effect of sample size
“leaky site correction (Δrmultiple = −0.11–0.03 vs. Δrsingle = –0.06–0.01)”
Citations
Cites
Scikit-learn: Machine Learning in Python
Pedregosa, F., Varoquaux, G., Gramfort, A., Michel, V., Thirion, B., Grisel, O., Blondel, M., Müller, A., Nothman, J., Louppe, G., et al. (2012) · arXiv · doi:10.48550/arxiv.1201.0490 · Cited by 71,016
SciPy 1.0: fundamental algorithms for scientific computing in Python
Virtanen, P., Gommers, R., Oliphant, T. E., Haberland, M., Reddy, T., Cournapeau, D., Burovski, E., Peterson, P., Weckesser, W., Bright, J., et al. (2020) · Nature Methods · doi:10.1038/s41592-019-0686-2 · Cited by 38,430
Harris, C. R., Millman, K. J., van der Walt, S. J., Gommers, R., Virtanen, P., Cournapeau, D., Wieser, E., Taylor, J., Berg, S., Smith, N. J., et al. (2020) · Nature · doi:10.1038/s41586-020-2649-2 · Cited by 23,826
Harris, C., Millman, K., van der Walt, S., Gommers, R., Virtanen, P., Cournapeau, D., Wieser, E., Taylor, J., Berg, S., Smith, N., et al. (2020) · RePEc: Research Papers in Economics · Cited by 17,844
SciPy 1.0: fundamental algorithms for scientific computing in Python
Virtanen, P., Gommers, R., Oliphant, T. E., Haberland, M., Reddy, T., Cournapeau, D., Burovski, E., Peterson, P., Weckesser, W., Bright, J., et al. (2019) · Apollo - University of Cambridge Repository · doi:10.17863/cam.64134 · Cited by 10,460
Adjusting batch effects in microarray expression data using empirical Bayes methods
Johnson, W. E., Li, C., & Rabinovic, A. (2007) · Biostatistics · doi:10.1093/biostatistics/kxj037 · Cited by 8,658
Reback, J., McKinney, W., Bossche, J. V. D., Jbrockmendel, Augspurger, T., Cloud, P., Gfyoung, Sinhrks, Klein, A., Tratner, J., et al. (2019) · Zenodo (CERN European Organization for Nuclear Research) · doi:10.5281/zenodo.3509134 · Cited by 3,464
The Adolescent Brain Cognitive Development (ABCD) study: Imaging acquisition across 21 sites
Casey, B. J., Cannonier, T., Conley, M. I., Cohen, A. O., Barch, D. M., Heitzeg, M. M., Soules, M. E., Teslovich, T., Dellarco, D. V., Garavan, H., et al. (2018) · Developmental Cognitive Neuroscience · doi:10.1016/j.dcn.2018.03.001 · Cited by 2,204
Reproducible brain-wide association studies require thousands of individuals
Marek, S., Tervo-Clemmens, B., Calabro, F. J., Montez, D. F., Kay, B. P., Hatoum, A. S., Donohue, M. R., Foran, W., Miller, R. L., Hendrickson, T. J., et al. (2022) · Nature · doi:10.1038/s41586-022-04492-9 · Cited by 1,928
Miller, T. J., McGlashan, T. H., Rosen, J. L., Cadenhead, K., Ventura, J., McFarlane, W., Perkins, D. O., Pearlson, G. D., & Woods, S. W. (2003) · Schizophrenia Bulletin · doi:10.1093/oxfordjournals.schbul.a007040 · Cited by 1,798
Research works printed but not linked: 2
- Carlini, N., Liu, C., Erlingsson, Ú., Kos, J. & Song, D. The secret sharer: evaluating and testing unintended memorization in neural networks. in USENIX Security Symposium 267 (2019).
- Wechsler, D. WISC-V: Technical And Interpretive Manual (NCS Pearson, Incorporated, 2014).
Cited by
Don’t push the button! Exploring data leakage risks in machine learning and transfer learning
Apicella, A., Isgrò, F., & Prevete, R. (2025) · Artificial Intelligence Review · doi:10.1007/s10462-025-11326-3 · Cited by 214
Overview of leakage scenarios in supervised machine learning
Sasse, L., Nicolaisen‐Sobesky, E., Dukart, J., Eickhoff, S. B., GOETZ, M. A., Hamdan, S., Komeyer, V., Kulkarni, A. J., Lahnakoski, J. M., Love, B. C., et al. (2025) · Journal Of Big Data · doi:10.1186/s40537-025-01193-8 · Cited by 145
A review of machine learning methods for cancer characterization from microbiome data
Teixeira, M., Silva, F., Ferreira, R. M., Pereira, T., Figueiredo, C., & Oliveira, H. P. (2024) · npj Precision Oncology · doi:10.1038/s41698-024-00617-7 · Cited by 61
Artificial intelligence investments reduce risks to critical mineral supply
Vespignani, J., & Smyth, R. (2024) · Nature Communications · doi:10.1038/s41467-024-51661-7 · Cited by 54
Ma, C., Zhang, H., Rao, Y., Jiang, X., Liu, B., Sun, Z., Song, Z., Gao, Y., Cui, Y., Liu, X., et al. (2025) · npj Digital Medicine · doi:10.1038/s41746-025-02198-6 · Cited by 71
Metadata
- Authors
- Rosenblatt, M., Tejavibulya, L., Jiang, R., Noble, S., & Scheinost, D.
- Affiliations
- Yale University (US)
- Northeastern University (US)
- Corresponding author
- Rosenblatt, Matthew
- Venue
- Nature Communications
- Published
- 2024-02-28
- Volume
- 15
- Issue
- 1
- Pages
- 1829-1829
- ISSN
- 2041-1723 (ISSN-L)
- PMC
- PMC10901797
- OpenAlex
- W4392232009
- Semantic Scholar
- 22640fdce74910741894099aa71f3eb74877a633
- Cited by
- 236
- References
- 78
- Citations by year
- 2026: 150 · 2025: 61 · 2024: 24
- FWCI
- 57.17
- Type
- journal article
- Language
- en
- Open access
- gold
- doi.org
- Licence
- cc-by
- creativecommons.org/licenses/by/4.0 (tdm)
- creativecommons.org/licenses/by/4.0 (vor)
- Locations
- Nature Communications (publishedVersion, cc-by)
- bioRxiv (Cold Spring Harbor Laboratory) (acceptedVersion, cc-by-nc-nd)
- PubMed Central (publishedVersion, cc-by)
- PubMed (publishedVersion)
- PubMed Central (submittedVersion, cc-by-nd)
- RePEc: Research Papers in Economics (submittedVersion)
- DOAJ (DOAJ: Directory of Open Access Journals) (submittedVersion)
- Funders
- National Science Foundation (DGE2139841)
- Gruber Science Fellowship
- U.S. Department of Health & Human Services | NIH | National Institute of Mental Health (R00MH130894, R01MH121095)
- Topics
- Life Sciences › Neuroscience › Cognitive Neuroscience › Functional Brain Connectivity Studies
- Health Sciences › Medicine › Radiology, Nuclear Medicine and Imaging › Advanced Neuroimaging Techniques and Applications
- Health Sciences › Health Professions › Health Information Management › Artificial Intelligence in Healthcare
- Keywords
- data leakage, functional connectome, structural connectome, brain-behavior relationship, feature selection, small sample size, model generalization, reproducibility
About these checks
Registry, retraction, Cites and statistics results are computed, not judged, with one exception: a printed reference that no index lists is read once by a model before it counts as a citation error. Claims are extracted by a model and kept only when their quote appears verbatim in the text; each cited source is then checked, with a model’s help, for whether it says what the claim relies on. Those verdicts can be wrong — read the claim’s quote and the cited source before relying on one.
The claim verdicts this report counts are experimental: their accuracy is not yet measured.
A language model drew the claims from the paper on 2026-10-10, under version 3 of the claim definition (model deepseek-v4.1-flash, prompt extract-v3).
A second model labelled each claim on 2026-10-10 (model jev-1.13-20260917, definition revision gold-guideline-v0.2).
Cited sources are checked with a language model’s help (gpt-6-sol and qwen3.8-omni-flash).
Statistics and arithmetic are recomputed, not judged.
Confidence bands are shown only for fields calibrated on our annotated test set. None is calibrated yet, so no band is shown.
What counts as a claim ›How we measure confidence ›How we check this ›
Are you an author, or do you see a problem with this page? Request a review
How to cite
Cite CoChat for the checks on this page, and the paper for its own findings.
- This page
- CoChat. (2026). Citation check: Data leakage inflates prediction performance in connectome-based machine learning models. https://app.cochat.ai/papers/10.1038/s41467-024-46150-w
- The paper
- Rosenblatt, M., Tejavibulya, L., Jiang, R., Noble, S., & Scheinost, D. (2024). Data leakage inflates prediction performance in connectome-based machine learning models. Nature Communications. https://doi.org/10.1038/s41467-024-46150-w
Data sources
Bibliographic data: Semantic Scholar, OpenAlex, Crossref.
Contains information from the Semantic Scholar Academic Graph Datasets, made available under the ODC Attribution License (ODC-BY 1.0).
Semantic Scholar’s data is described in: Kinney, R., et al. (2023). The Semantic Scholar Open Data Platform. arXiv:2301.10140.
