

The DOI matches its Crossref record; 6 of the 6 references it cites were found in a registry or an index.
Confirmation bias through selective readout of information encoded in human parietal cortex
Published version of a preprint
Abstract
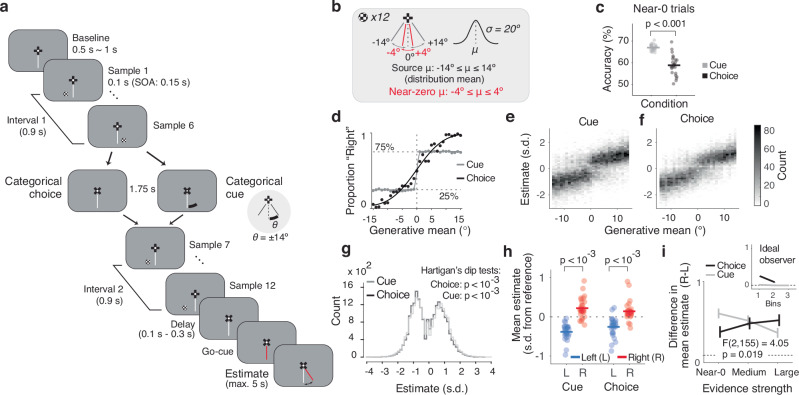
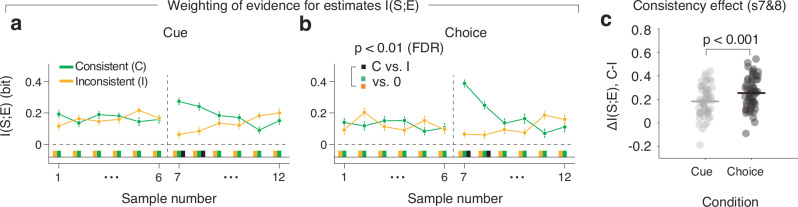
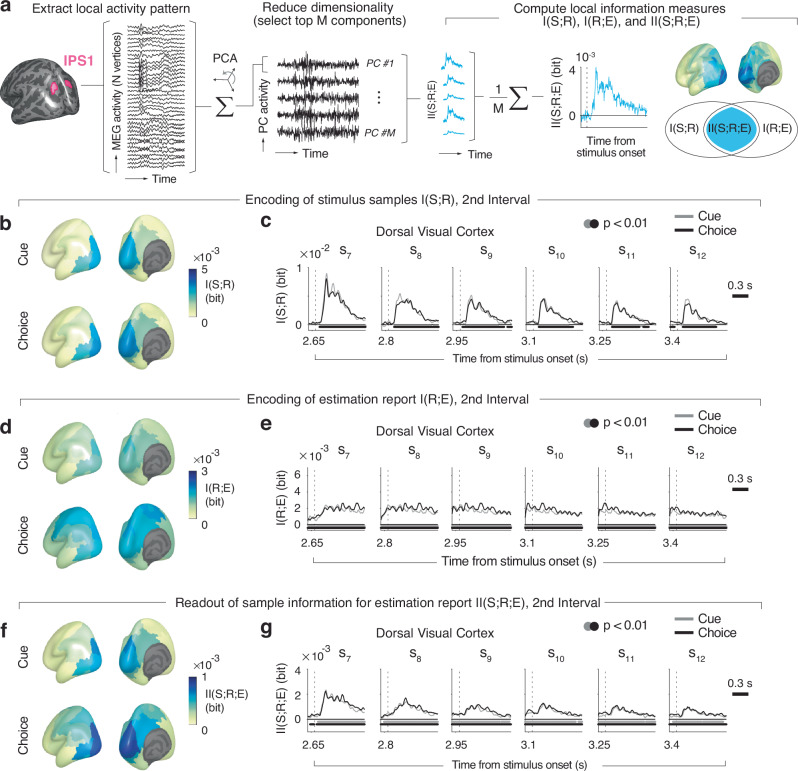
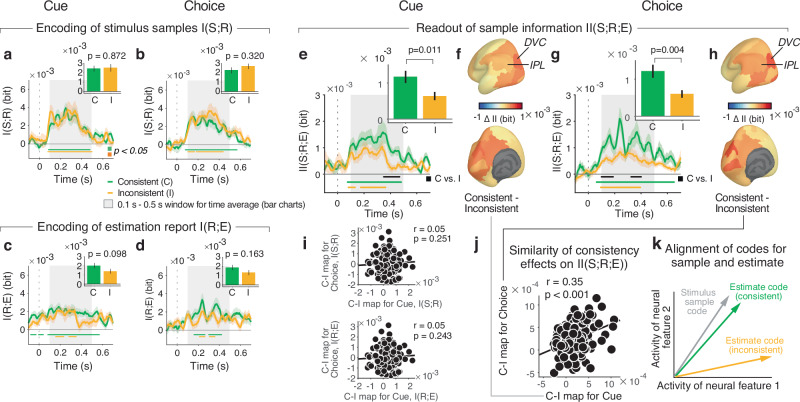
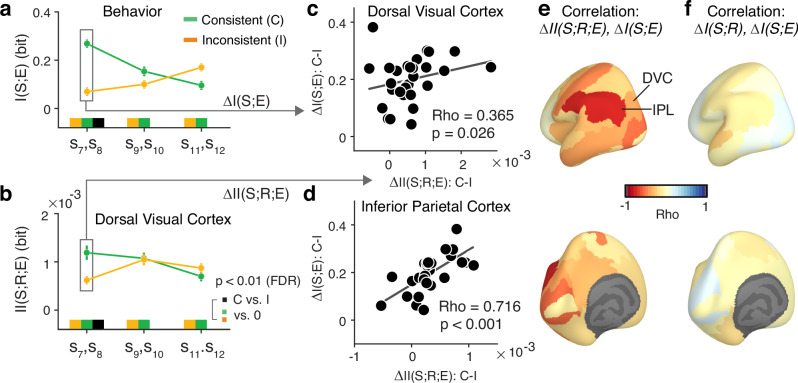
Decision-makers often process new evidence selectively, depending on their current beliefs about the world. We asked whether such confirmation biases result from biases in the encoding of sensory evidence in the brain, or alternatively in the utilization of encoded evidence for behavior. Human participants estimated the source of a sequence of visual-spatial evidence samples while we measured cortical population activity with magnetoencephalography. Halfway through the sequence, participants were prompted to judge the more likely source category. We find that processing of subsequent evidence depends on its consistency with the previously chosen category. Evidence encoded in parietal cortex contributes more to the estimation report when that evidence is consistent with the previous choice compared to when it contradicts that choice. Our results indicate that information contradicting pre-existing beliefs has little impact on subsequent behavior, despite being precisely encoded in the brain. This provides room for deliberative control to counteract confirmation biases.
Overview
The claims and statistics of this paper haven’t been checked yet.
Run the check — free, no account needed. It reads the open-access text and checks the sources it cites.
Integrity signals
Registry
Cites
Statistics
Figures
Verification
Claims the paper makes
The claims and statistics of this paper haven’t been checked yet.
Run the check — free, no account needed. It reads the open-access text and checks the sources it cites.
Claims other papers make about this one
Each is checked against this paper’s own text: does it say what the citing paper says it does?
In the citing paper
“The target variable (visual sample orientation) was drawn from a Gaussian distribution by experimental design.77”
From Sampling bias corrections for discrete and Gaussian partial information decompositions (2026) · cites this paper as [77]
Self-check
Percentages, sums and reported differences re-computed from the paper’s own numbers.
The self-check needs the paper’s full text.
Citations
Cites
Tversky, A., & Kahneman, D. (1974) · Science · doi:10.1126/science.185.4157.1124 · Cited by 28,810
Visual field maps in human cortex.
Wandell, B. A., Dumoulin, S. O., & Brewer, A. A. (2007) · Neuron · doi:10.1016/j.neuron.2007.10.012 · Cited by 1,231
Neural correlates of perceptual learning in a sensory-motor, but not a sensory, cortical area
Law, C.-T., & Gold, J. I. (2008) · Nature Neuroscience · doi:10.1038/nn2070 · Cited by 516
Confirmation bias in the utilization of others’ opinion strength
Kappes, A., Harvey, A. H., Lohrenz, T., Montague, P. R., & Sharot, T. (2020) · Nature Neuroscience · doi:10.1038/s41593-019-0549-2 · Cited by 186
A new perceptual illusion reveals mechanisms of sensory decoding
Jazayeri, M., & Movshon, J. A. (2007) · Nature · doi:10.1038/nature05739 · Cited by 173
Sampling bias corrections for discrete and Gaussian partial information decompositions
Lorenz, G. M., Engel, N. M., Koçillari, L., Celotto, M., Orsenigo, D., Curreli, S., Malerba, S. B., Engel, A. K., Kayser, C., Fellin, T., et al. (2026) · Patterns · doi:10.1016/j.patter.2026.101619 · Cited by 9
Self-citation
Research works printed but not linked: 61
- Behrens, T. E. J., Woolrich, M. W., Walton, M. E. & Rushworth, M. F. S. Learning the value of information in an uncertain world. Nat. Neurosci. 10, 1214–1221 (2007). · DOI · Paper page
- Drugowitsch, J., Wyart, V., Devauchelle, A.-D. & Koechlin, E. Computational precision of mental inference as critical source of human choice suboptimality. Neuron 92, 1398–1411 (2016). · DOI
- Gold, J. I. & Stocker, A. A. Visual decision-making in an uncertain and dynamic world. Annu. Rev. Vis. Sci. 3, 227–250 (2017). · DOI
- Murphy, P. R., Wilming, N., Hernandez-Bocanegra, D. C., Prat-Ortega, G. & Donner, T. H. Adaptive circuit dynamics across human cortex during evidence accumulation in changing environments. Nat. Neurosci. 24, 987–997 (2021). · DOI
- Tavoni, G., Doi, T., Pizzica, C., Balasubramanian, V. & Gold, J. I. Human inference reflects a normative balance of complexity and accuracy. Nat. Hum. Behav. 6, 1153–1168 (2022). · DOI · Paper page
- Nickerson, R. S. Confirmation bias: a ubiquitous phenomenon in many guises. Rev. Gen. Psychol. 2, 175–220 (1998). · DOI · Paper page
- Talluri, B. C., Urai, A. E., Tsetsos, K., Usher, M. & Donner, T. H. Confirmation bias through selective overweighting of choice-consistent evidence. Curr. Biol. 28, 3128–3135.e8 (2018). · DOI
- Rollwage, M. et al. Confidence drives a neural confirmation bias. Nat. Commun. 11, 2634 (2020). · DOI
- Bogacz, R., Brown, E., Moehlis, J., Holmes, P. & Cohen, J. D. The physics of optimal decision making: a formal analysis of models of performance in two-alternative forced-choice tasks. Psychol. Rev. 113, 700–765 (2006). · DOI
- Glaze, C. M., Kable, J. W. & Gold, J. I. Normative evidence accumulation in unpredictable environments. eLife 4, e08825 (2015). · DOI
- Brody, C. D. & Hanks, T. D. Neural underpinnings of the evidence accumulator. Curr. Opin. Neurobiol. 37, 149–157 (2016). · DOI
- Wilming, N., Murphy, P. R., Meyniel, F. & Donner, T. H. Large-scale dynamics of perceptual decision information across human cortex. Nat. Commun. 11, 5109 (2020). · DOI
- Wang, X.-J. Theory of the multiregional neocortex: large-scale neural dynamics and distributed cognition. Annu. Rev. Neurosci. 45, 533–560 (2022). · DOI · Paper page
- Steinemann, N. A. et al. Direct observation of the neural computations underlying a single decision. eLife. 12, RP90859 (2022). · DOI
- Baillet, S. Magnetoencephalography for brain electrophysiology and imaging. Nat. Neurosci. 20, 327–339 (2017). · DOI · Paper page
- Panzeri, S., Harvey, C. D., Piasini, E., Latham, P. E. & Fellin, T. Cracking the neural code for sensory perception by combining statistics, intervention, and behavior. Neuron 93, 491–507 (2017). · DOI
- Pica, G. et al. Quantifying how much sensory information in a neural code is relevant for behavior. In Advances in Neural Information Processing Systems (eds. Guyon, I. et al.) 3686–3696 (Curran Associates, Inc., 2017).
- Luu, L. & Stocker, A. A. Post-decision biases reveal a self-consistency principle in perceptual inference. eLife 7, e33334 (2018). · DOI
- Sanders, J. I., Hangya, B. & Kepecs, A. Signatures of a statistical computation in the human sense of confidence. Neuron 90, 499–506 (2016). · DOI · Paper page
- Waskom, M. L., Okazawa, G. & Kiani, R. Designing and interpreting psychophysical investigations of cognition. Neuron 104, 100–112 (2019). · DOI
- Glasser, M. F. et al. A multi-modal parcellation of human cerebral cortex. Nature 536, 171–178 (2016). · DOI · Paper page
- Wang, L., Mruczek, R. E. B., Arcaro, M. J. & Kastner, S. Probabilistic maps of visual topography in human cortex. Cereb. Cortex 25, 3911–3931 (2015). · DOI
- Silver, M. A., Ress, D. & Heeger, D. J. Topographic maps of visual spatial attention in human parietal cortex. J. Neurophysiol. 94, 1358–1371 (2005). · DOI
- Silver, M. A. & Kastner, S. Topographic maps in human frontal and parietal cortex. Trends Cogn. Sci. 13, 488–495 (2009). · DOI
- Schluppeck, D., Curtis, C. E., Glimcher, P. W. & Heeger, D. J. Sustained activity in topographic areas of human posterior parietal cortex during memory-guided saccades. J. Neurosci. 26, 5098–5108 (2006). · DOI
- Law, C.-T. & Gold, J. I. Reinforcement learning can account for associative and perceptual learning on a visual-decision task. Nat. Neurosci. 12, 655–663 (2009). · DOI
- Kahneman, D. Maps of bounded rationality: psychology for behavioral economics. Am. Econ. Rev. 93, 1449–1475 (2003). · DOI · Paper page
- Gigerenzer, G. & Gaissmaier, W. Heuristic decision making. Annu. Rev. Psychol. 62, 451–482 (2011). · DOI · Paper page
- Qiu, C., Luu, L. & Stocker, A. A. Benefits of commitment in hierarchical inference. Psychol. Rev. 127, 622–639 (2020). · DOI
- Luu, L. & Stocker, A. A. Categorical judgments do not modify sensory representations in working memory. PLoS Comput. Biol. 17, e1008968 (2021). · DOI
- Brehm, J. W. Postdecision changes in the desirability of alternatives. J. Abnorm. Soc. Psychol. 52, 384–389 (1956). · DOI
- Stocker, A. A. & Simoncelli, E. A Bayesian Model of Conditioned Perception. In Advances in Neural Information Processing Systems (eds. Platt, J., Koller, D., Singer, Y. & Roweis, S.) 20 (Curran Associates, Inc., 2008).
- Maunsell, J. H. R. & Treue, S. Feature-based attention in visual cortex. Trends Neurosci. 29, 317–322 (2006). · DOI
- Reynolds, J. H. & Heeger, D. J. The normalization model of attention. Neuron 61, 168–185 (2009). · DOI · Paper page
- Prat-Ortega, G. & Rocha, J. D. L. Selective attention: a plausible mechanism underlying confirmation bias. Curr. Biol. 28, R1151–R1154 (2018). · DOI
- Nienborg, H. & Cumming, B. G. Decision-related activity in sensory neurons reflects more than a neuron’s causal effect. Nature 459, 89–92 (2009). · DOI
- Lange, R. D., Chattoraj, A., Beck, J. M., Yates, J. L. & Haefner, R. M. A confirmation bias in perceptual decision-making due to hierarchical approximate inference. PLoS Comput Biol. 17, e1009517 (2021). · DOI
- Desimone, R. & Duncan, J. Neural mechanisms of selective visual attention. Annu. Rev. Neurosci. 18, 193–222 (1995). · DOI · Paper page
- Pestilli, F., Carrasco, M., Heeger, D. J. & Gardner, J. L. Attentional enhancement via selection and pooling of early sensory responses in human visual cortex. Neuron 72, 832–846 (2011). · DOI · Paper page
- Yates, J. L., Park, I. M., Katz, L. N., Pillow, J. W. & Huk, A. C. Functional dissection of signal and noise in MT and LIP during decision-making. Nat. Neurosci. 20, 1285–1292 (2017). · DOI
- Zhao, Y., Yates, J. L., Levi, A. J., Huk, A. C. & Park, I. M. Stimulus-choice (mis)alignment in primate area MT. PLoS Comput Biol. 16, e1007614 (2020). · DOI
- Valente, M. et al. Correlations enhance the behavioral readout of neural population activity in association cortex. Nat. Neurosci. https://doi.org/10.1038/s41593-021-00845-1 (2021). · DOI
- Urai, A. E. & Donner, T. H. Persistent activity in human parietal cortex mediates perceptual choice repetition bias. Nat. Commun. 13, 6015 (2022). · DOI
- Urai, A. E., de Gee, J. W., Tsetsos, K. & Donner, T. H. Choice history biases subsequent evidence accumulation. eLife 8, e46331 (2019). · DOI
- Oostenveld, R., Fries, P., Maris, E. & Schoffelen, J.-M. FieldTrip: Open source software for advanced analysis of MEG, EEG, and invasive electrophysiological data. Comput. Intell. Neurosci. 2011, 1–9 (2011). · DOI · Paper page
- Gramfort, A. et al. MNE software for processing MEG and EEG data. NeuroImage 86, 446–460 (2014). · DOI
- Lorenz, G. M. et al. MINT: A toolbox for the analysis of multivariate neural information coding and transmission. PLoS Comput. Biol. 21, e1012934 (2025). · DOI
- Quian Quiroga, R. & Panzeri, S. Extracting information from neuronal populations: information theory and decoding approaches. Nat. Rev. Neurosci. 10, 173–185 (2009). · DOI
- Shannon, C. E. A Mathematical theory of communication. Bell Syst. Tech. J. 27, 379–423 (1948). · DOI · Paper page
- Magri, C., Whittingstall, K., Singh, V., Logothetis, N. K. & Panzeri, S. A toolbox for the fast information analysis of multiple-site LFP, EEG and spike train recordings. BMC Neurosci. 10, 81 (2009). · DOI
- Panzeri, S., Senatore, R., Montemurro, M. A. & Petersen, R. S. Correcting for the sampling bias problem in spike train information measures. J. Neurophysiol. 98, 1064–1072 (2007). · DOI · Paper page
- Strong, S. P., Koberle, R., de Ruyter van Steveninck, R. R. & Bialek, W. Entropy and information in neural spike trains. Phys. Rev. Lett. 80, 197–200 (1998). · DOI · Paper page
- Bertschinger, N., Rauh, J., Olbrich, E., Jost, J. & Ay, N. Quantifying unique information. Entropy 16, 2161–2183 (2014). · DOI · Paper page
- Koçillari, L. et al. Sampling bias corrections for accurate neural measures of redundant, unique, and synergistic information. bioRxiv https://doi.org/10.1101/2024.06.04.597303 (2024). · DOI
- Panzeri, S. & Treves, A. Analytical estimates of limited sampling biases in different information measures. Netw.: Comput. Neural Syst. 7, 87–107 (1996). · DOI · Paper page
- Ince, R. A. A., Mazzoni, A., Bartels, A., Logothetis, N. K. & Panzeri, S. A novel test to determine the significance of neural selectivity to single and multiple potentially correlated stimulus features. J. Neurosci. Methods 210, 49–65 (2012). · DOI
- Rouder, J. N., Speckman, P. L., Sun, D., Morey, R. D. & Iverson, G. Bayesian t tests for accepting and rejecting the null hypothesis. Psychon. Bull. Rev. 16, 225–237 (2009). · DOI · Paper page
- Jeffreys, H. Theory of Probability. (Clarendon Press. New York. Oxford University Press: Oxford [Oxfordshire, 1998.
- Cohen, J. Eta-squared and partial Eta-squared in fixed factor anova designs. Educ. Psychol. Meas. 33, 107–112 (1973). · DOI · Paper page
- Alexander-Bloch, A. F. et al. On testing for spatial correspondence between maps of human brain structure and function. NeuroImage 178, 540–551 (2018). · DOI · Paper page
- Markello, R. D. & Misic, B. Comparing spatial null models for brain maps. NeuroImage 236, 118052 (2021). · DOI
Cited by
Sorted by citations
Sampling bias corrections for discrete and Gaussian partial information decompositions
Lorenz, G. M., Engel, N. M., Koçillari, L., Celotto, M., Orsenigo, D., Curreli, S., Malerba, S. B., Engel, A. K., Kayser, C., Fellin, T., et al. (2026) · Patterns · doi:10.1016/j.patter.2026.101619 · Cited by 9
Self-citation
Metadata
- Authors
- Park, H., Arazi, A., Talluri, B. C., Celotto, M., Panzeri, S., Stocker, A. A., & Donner, T. H.
- Venue
- Nature Communications
- Published
- 2025-06-25
- Volume
- 16
- Issue
- 1
- ISSN
- 2041-1723
- PMC
- PMC12198416
- Cited by
- 10
- References
- 6
- Language
- en
About these checks
Registry, retraction, Cites and statistics results are computed, not judged, with one exception: a printed reference that no index lists is read once by a model before it counts as a citation error. Claims are extracted by a model and kept only when their quote appears verbatim in the text; each cited source is then checked, with a model’s help, for whether it says what the claim relies on. Those verdicts can be wrong — read the claim’s quote and the cited source before relying on one.
Statistics and arithmetic are recomputed, not judged.
Confidence bands are shown only for fields calibrated on our annotated test set. None is calibrated yet, so no band is shown.
What counts as a claim ›How we measure confidence ›How we check this ›
Are you an author, or do you see a problem with this page? Request a review
How to cite
Cite CoChat for the checks on this page, and the paper for its own findings.
- This page
- CoChat. (2026). Citation check: Confirmation bias through selective readout of information encoded in human parietal cortex. https://app.cochat.ai/papers/10.1038/s41467-025-61010-x
- The paper
- Park, H., Arazi, A., Talluri, B. C., Celotto, M., Panzeri, S., Stocker, A. A., & Donner, T. H. (2025). Confirmation bias through selective readout of information encoded in human parietal cortex. Nature Communications. https://doi.org/10.1038/s41467-025-61010-x
