Cited by 11Biochemical and Molecular ResearchRNA and protein synthesis mechanismsGenomics and Phylogenetic Studies

The DOI matches its Crossref record; 8 of the 8 references it cites were found in a registry or an index.

The role of gene duplication and paralog specialisation in the evolution of the mammalian PRPS complex

Open access
Karki, Bibek R., MacMillan, Austin C., Vicente-Muñoz, Sara, Greis, Kenneth D., Romick, Lindsey E., Cunningham, John T.·2025·Nature Communications

Published version of a preprint

Abstract

The phosphoribosyl pyrophosphate synthetase (PRPS) enzyme catalyzes a chokepoint reaction in nucleotide production, making it essential for life. Here, we show that the presence of multiple PRPS-encoding genes is a hallmark trait of eukaryotes, and we find that gains or losses of paralogs are associated with major branching events in the eukaryotic tree. We pinpoint the evolutionary origins and define the individual roles for each of the mammalian PRPS paralogs, which we demonstrate work together as a heterogeneous multicomponent complex. Employing isogenic cells representing all viable individual or combinatorial assembly states, we dissect the basic organizational principles of the enzyme complex and characterize the emergent properties responsible for paralog specialization, including new modes of regulation that govern complex assembly and activity in vivo. Collectively, our study demonstrates how evolution has transformed a single PRPS enzyme into a biochemical complex endowed with novel functional and regulatory features that fine-tune mammalian metabolism.

Overview

The claims and statistics of this paper haven’t been checked yet.

Run the check — free, no account needed. It reads the open-access text and checks the sources it cites.

A few free checks a day · papers already verified open instantly · results are public

Integrity signals

Registry

Crossref · 10.1038/s41467-025-61216-z

Cites

8 of 8 references verified0 citation errors · 0 not checkable

Statistics

Figures

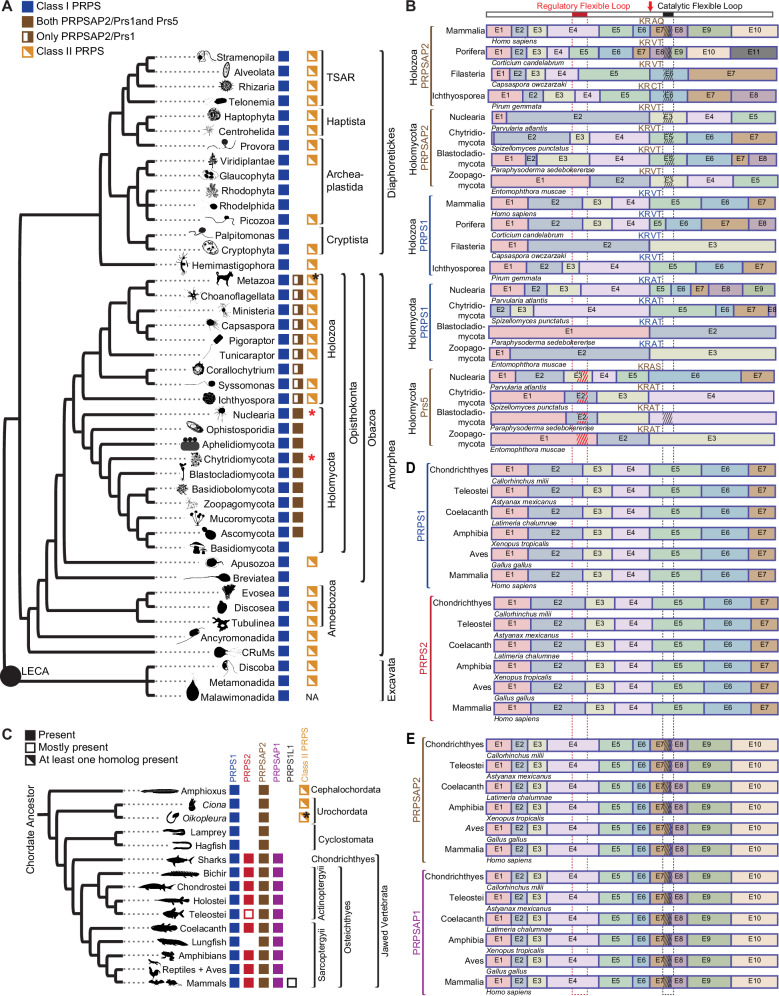
Fig. 1 Loss of Class II PRPS associated with expanded Class I PRPS homolog repertoire. A Phylogenetic distribution of PRPS homologs in eukaryotes, with presence/absence of NHR-containing PRPS homologs in opisthokonts. PRPSAP2 denotes orthologs of mammalian PRPSAP2; Prs1 and Prs5 represent S. cerevisiae Prs1 and Prs5, respectively. Black asterisk indicates Class II presence across most metazoans, excluding Craniata. Red asterisks indicate Class II PRPS identified in only two Nuclearia species and one Chytridomycota species. B Conserved splice site junctions among PRPS homologs across different representative organisms in Opisthokonta. Gene structures for PRPS, PRPSAP2, and Prs5-encoding genes shown with exons as colored boxes; introns not displayed. Multiple sequence alignment (MSA) of translated sequences via Clustal Omega highlights a conserved splice site junction (red arrow) with adjacent amino acids shown. Top bar shows full H. sapiens PRPS1 with RF loop (red box) and CF loop (black box). Dotted red and black lines project corresponding RF and CF loops positions, respectively onto other homologs. Insertions in RF and CF loops of PRPSAP2 and Prs5 shown with red and black hatch marks, respectively (hatch marks not to scale; NHRs vary in length). C Phylogenetic distribution of PRPS homologs in chordates. Mostly present – indicates present in most taxa. Black asterisk highlights that Class II PRPS is found in most urochordates, except Oikopleura, which has additional Class I PRPS homologs not observed in other organisms from this clade. D, E Conserved splice site junctions between PRPS1 and PRPS2 (D), and PRPSAP2 and PRPSAP1 (E) across different representative organisms in jawed Vertebrata. Gene structures for PRPS, PRPSAP2, and Prs5-encoding genes shown with exons as colored boxes; introns not displayed. Dotted red and black lines denote RF and CF loop regions, respectively; insertions in PRPSAP2 and PRPSAP1 shown as red and black hatch marks, respectively (hatch marks not to scale; NHRs vary in length).
Fig. 1 Loss of Class II PRPS associated with expanded Class I PRPS homolog repertoire. A Phylogenetic distribution of PRPS homologs in eukaryotes, with presence/absence of NHR-containing PRPS homologs in opisthokonts. PRPSAP2 denotes orthologs of mammalian PRPSAP2; Prs1 and Prs5 represent S. cerevisiae Prs1 and Prs5, respectively. Black asterisk indicates Class II presence across most metazoans, excluding Craniata. Red asterisks indicate Class II PRPS identified in only two Nuclearia species and one Chytridomycota species. B Conserved splice site junctions among PRPS homologs across different representative organisms in Opisthokonta. Gene structures for PRPS, PRPSAP2, and Prs5-encoding genes shown with exons as colored boxes; introns not displayed. Multiple sequence alignment (MSA) of translated sequences via Clustal Omega highlights a conserved splice site junction (red arrow) with adjacent amino acids shown. Top bar shows full H. sapiens PRPS1 with RF loop (red box) and CF loop (black box). Dotted red and black lines project corresponding RF and CF loops positions, respectively onto other homologs. Insertions in RF and CF loops of PRPSAP2 and Prs5 shown with red and black hatch marks, respectively (hatch marks not to scale; NHRs vary in length). C Phylogenetic distribution of PRPS homologs in chordates. Mostly present – indicates present in most taxa. Black asterisk highlights that Class II PRPS is found in most urochordates, except Oikopleura, which has additional Class I PRPS homologs not observed in other organisms from this clade. D, E Conserved splice site junctions between PRPS1 and PRPS2 (D), and PRPSAP2 and PRPSAP1 (E) across different representative organisms in jawed Vertebrata. Gene structures for PRPS, PRPSAP2, and Prs5-encoding genes shown with exons as colored boxes; introns not displayed. Dotted red and black lines denote RF and CF loop regions, respectively; insertions in PRPSAP2 and PRPSAP1 shown as red and black hatch marks, respectively (hatch marks not to scale; NHRs vary in length).CC BY · PubMed Central
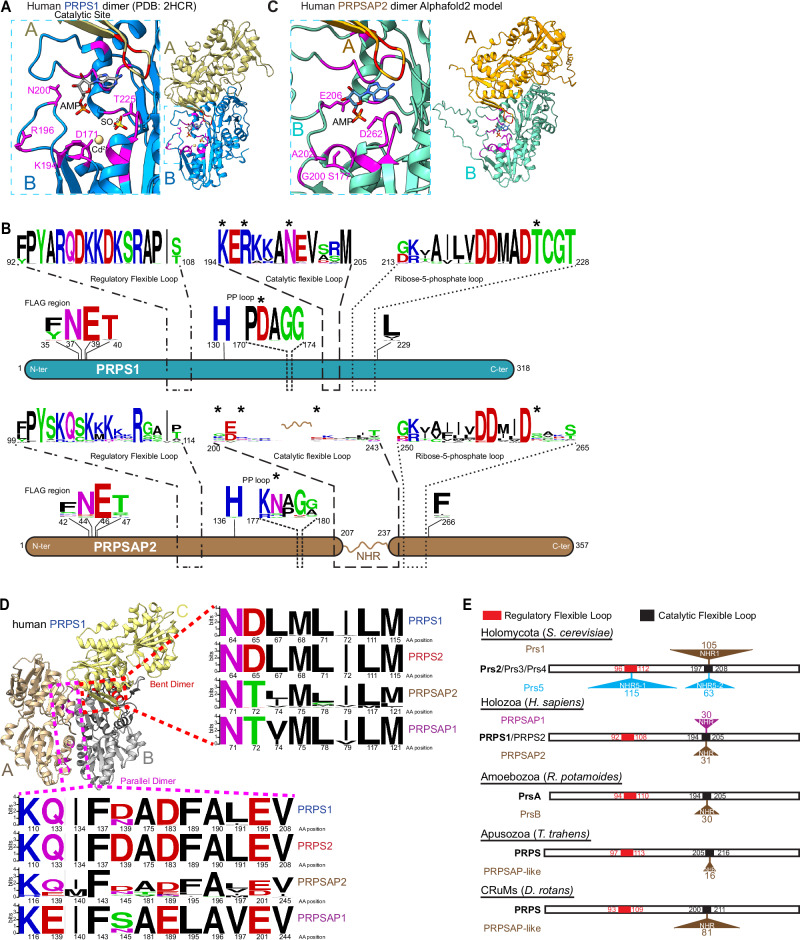
Fig. 2 Convergent evolution of PRPSAP-like homologs in Amorphea. A Structure of dimeric human PRPS1 (PDB: 2HCR), with a zoom-in of catalytic site highlighting metal binding site (Cd2+), AMP (represents AMP moiety of ATP), SO42− (represents 5′-phosphate of R5P), and several conserved active site residues (magenta). D171 coordinates metal binding, K194 interacts with ATP, R196, and T225 interact with R5P, and N200 stabilizes the catalytic loop. B WebLogo depicting MSA of active and regulatory site residues from PRPS1 and PRPSAP2 from representative organisms in opisthokonts (n = 44 each). Numbers below indicate corresponding residue positions in human PRPS1 (NP_002755.1) and PRPSAP2 (NP_001340030.1). Asterisks denote residues conserved in PRPS but substituted in PRPSAP2 (also shown in A). C AlphaFold2-predicted structure of human PRPSAP2 (NP_001340030.1), with a zoom-in highlighting four non-conserved residues (magenta) at corresponding active site positions in PRPS1 shown in (A). AMP modeled to indicate putative ATP binding site. D Trimeric structure of human PRPS1 (PDB: 2HCR). Red and magenta residues in dashed box represent dimer interface residues in bent (B, C) and parallel (A, B) dimers, respectively. Amino acid sequence of B. subtilis PRPS aligned with Opisthokonta PRPS homologs to identify corresponding dimer interface residues for WebLogo. Representative sequences include PRPS1 (n = 44), PRPSAP2 (n = 44) from opisthokonts, and PRPS2 (n = 46), PRPSAP1 (n = 92) from jawed vertebrates. Residue numbers based on human PRPS1 (NP_002755.1), PRPS2 (NP_002756.1), PRPSAP1 (AAH09012.1), and PRPSAP2 (NP_001340030.1). E PRPS paralogs from S. cerevisiae, H. sapiens, R. potamoides, T. trahens, and D. rotans showing relative NHR positions in paralogs with expanded CF and/or RF loops. Open bar for each representative species represents full polypeptide sequences of their ancestral PRPS (bold). Amino acid positions corresponding to RF and CF loops labeled within bars. NHR insertions sites for Prs1, Prs5, PRPSAP1, PRPSAP2, PrsB, and PRPSAP-like homologs marked by triangles above/below bars. Numbers next to triangles indicate amino acid count per NHR.
Fig. 2 Convergent evolution of PRPSAP-like homologs in Amorphea. A Structure of dimeric human PRPS1 (PDB: 2HCR), with a zoom-in of catalytic site highlighting metal binding site (Cd2+), AMP (represents AMP moiety of ATP), SO42− (represents 5′-phosphate of R5P), and several conserved active site residues (magenta). D171 coordinates metal binding, K194 interacts with ATP, R196, and T225 interact with R5P, and N200 stabilizes the catalytic loop. B WebLogo depicting MSA of active and regulatory site residues from PRPS1 and PRPSAP2 from representative organisms in opisthokonts (n = 44 each). Numbers below indicate corresponding residue positions in human PRPS1 (NP_002755.1) and PRPSAP2 (NP_001340030.1). Asterisks denote residues conserved in PRPS but substituted in PRPSAP2 (also shown in A). C AlphaFold2-predicted structure of human PRPSAP2 (NP_001340030.1), with a zoom-in highlighting four non-conserved residues (magenta) at corresponding active site positions in PRPS1 shown in (A). AMP modeled to indicate putative ATP binding site. D Trimeric structure of human PRPS1 (PDB: 2HCR). Red and magenta residues in dashed box represent dimer interface residues in bent (B, C) and parallel (A, B) dimers, respectively. Amino acid sequence of B. subtilis PRPS aligned with Opisthokonta PRPS homologs to identify corresponding dimer interface residues for WebLogo. Representative sequences include PRPS1 (n = 44), PRPSAP2 (n = 44) from opisthokonts, and PRPS2 (n = 46), PRPSAP1 (n = 92) from jawed vertebrates. Residue numbers based on human PRPS1 (NP_002755.1), PRPS2 (NP_002756.1), PRPSAP1 (AAH09012.1), and PRPSAP2 (NP_001340030.1). E PRPS paralogs from S. cerevisiae, H. sapiens, R. potamoides, T. trahens, and D. rotans showing relative NHR positions in paralogs with expanded CF and/or RF loops. Open bar for each representative species represents full polypeptide sequences of their ancestral PRPS (bold). Amino acid positions corresponding to RF and CF loops labeled within bars. NHR insertions sites for Prs1, Prs5, PRPSAP1, PRPSAP2, PrsB, and PRPSAP-like homologs marked by triangles above/below bars. Numbers next to triangles indicate amino acid count per NHR.CC BY · PubMed Central
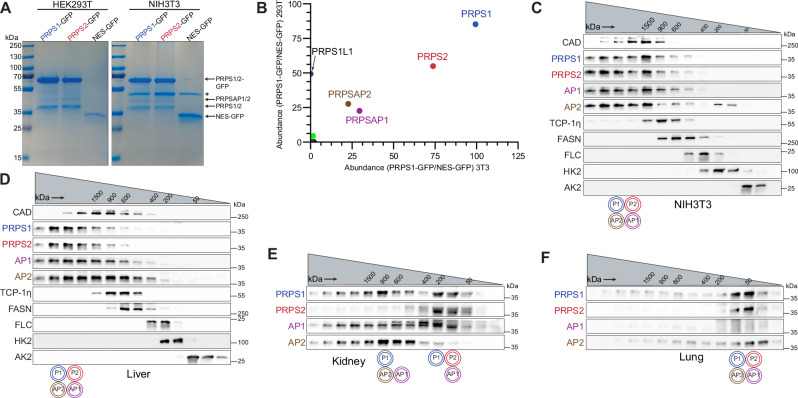
Fig. 3 PRPS enzymes operate as a multimeric complex that attains heterogeneous configurations. A SDS-PAGE followed by Coomassie stain of eluates from GFP immunoprecipitation (IP) performed in NIH3T3 and HEK293T cells stably expressing PRPS1-GFP, PRPS2-GFP, and NES-GFP. NES (Nuclear export signal)-GFP used as control. Asterisk indicates a non-specific band in eluates. B Scatter plot from mass spectrometry (MS) runs of eluates from GFP IP in NIH3T3 (x-axis) and HEK293T cells (y-axis) stably expressing PRPS1-GFP. Axes represent square root-transformed SEQUEST HT scores of PRPS1-GFP normalized to control. PRPS1L1 isoform detected only in HEK29T cells. C Western blot analysis of size exclusion chromatography (SEC) fractions collected from NIH3T3 native whole cell lysates. Cell lysates were fractionated using a Superose 6 Increase 3.2/300 column. Immunoblots probing indicated PRPS complex members and internal standards shown. D–F Western blot analysis of SEC fractions from native tissue lysates of liver (D), kidney (E), and lung (F). Twelve-week-old male C57BL/6 mice were used. Lysates were fractionated on a Superose 6 Increase 3.2/300 column. Immunoblots probing PRPS complex members and internal standards are shown. Circular pictograms below SEC immunoblots schematize PRPS complex configurations; double circle denotes multiple copies of the protein interacting within the heteromeric complex. Coomassie staining (A) and western blot data (C–F) are representative of at least 3 biological repeats. Source data are provided as a Source Data file.
Fig. 3 PRPS enzymes operate as a multimeric complex that attains heterogeneous configurations. A SDS-PAGE followed by Coomassie stain of eluates from GFP immunoprecipitation (IP) performed in NIH3T3 and HEK293T cells stably expressing PRPS1-GFP, PRPS2-GFP, and NES-GFP. NES (Nuclear export signal)-GFP used as control. Asterisk indicates a non-specific band in eluates. B Scatter plot from mass spectrometry (MS) runs of eluates from GFP IP in NIH3T3 (x-axis) and HEK293T cells (y-axis) stably expressing PRPS1-GFP. Axes represent square root-transformed SEQUEST HT scores of PRPS1-GFP normalized to control. PRPS1L1 isoform detected only in HEK29T cells. C Western blot analysis of size exclusion chromatography (SEC) fractions collected from NIH3T3 native whole cell lysates. Cell lysates were fractionated using a Superose 6 Increase 3.2/300 column. Immunoblots probing indicated PRPS complex members and internal standards shown. D–F Western blot analysis of SEC fractions from native tissue lysates of liver (D), kidney (E), and lung (F). Twelve-week-old male C57BL/6 mice were used. Lysates were fractionated on a Superose 6 Increase 3.2/300 column. Immunoblots probing PRPS complex members and internal standards are shown. Circular pictograms below SEC immunoblots schematize PRPS complex configurations; double circle denotes multiple copies of the protein interacting within the heteromeric complex. Coomassie staining (A) and western blot data (C–F) are representative of at least 3 biological repeats. Source data are provided as a Source Data file.CC BY · PubMed Central
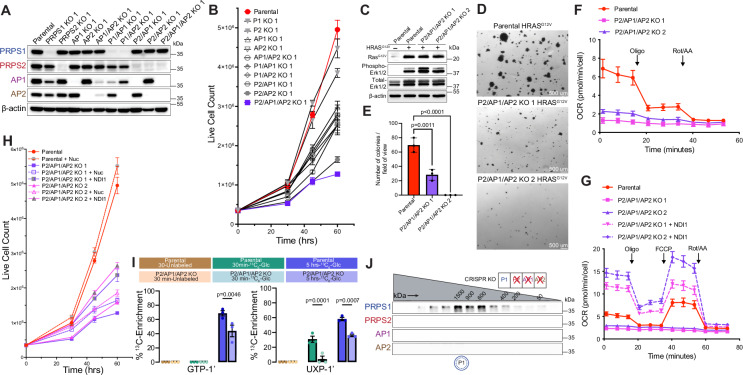
Fig. 4 Cells exclusively expressing PRPS1 display metabolic defects and decreased cellular proliferation. A Western blot validating CRISPR-Cas9-generated isogenic knockout cell lines. B Proliferation of NIH3T3 parental and knockout cell lines generated in (A) (n = 3 technical replicates). C Western blot validating HRASG12V-overexpression in NIH3T3 parental and P2/AP1/AP2 KO cell lines. Phospho-MAPK (Erk1/2) (T202/Y204) used as a marker for activation of signaling pathways upon HRASG12V overexpression. D Representative images from soft agar colony formation assay performed in NIH3T3 parental and P2/AP1/AP2 KO cells expressing HRASG12V. Scale bar, 500 μm. E Quantification of colonies from (D) (n = 3 experimental replicates). F Oxygen consumption rate (OCR) measured by Seahorse ATP Rate Assay in NIH3T3 parental and P2/AP1/AP2 KO cell lines (n = 8 technical replicates). G OCR measured by Seahorse mitochondrial stress tests in NIH3T3 parental and NDI1-expressing P2/AP1/AP2 KO cell lines (n = 7 technical replicates). H Proliferation of nucleoside supplemented and NDI1 expressing NIH3T3 P2/AP1/AP2 cell lines (n = 3 technical replicates). I13C6-glucose metabolic labeling performed in NIH3T3 parental and P2/AP1/AP2 KO cell lines for 30 min and 5 h. Unlabeled, 13C-labeled (30 min), and 13C-labeled (5 h) samples are represented in brown, green, and blue colors, respectively. 13C-enrichments quantified from 1H-NMR spectra (n = 3 experimental replicates). J Western blot analysis of SEC fractions collected from NIH3T3 P2/AP1/AP2 KO native whole-cell lysates. Cell lysates were fractionated on a Superose 6 Increase 3.2/300 column. In the pictogram below SEC immunoblots, the double circle with dotted inner circle denotes multiple copies of PRPS1 forming homo-oligomers. Data are represented as mean ± SD for (B, E–H) and mean ± SEM for (I). Statistical comparisons made using one way ANOVA followed by Tukey’s HSD post hoc test (E, I). Source data are provided as a Source Data file.
Fig. 4 Cells exclusively expressing PRPS1 display metabolic defects and decreased cellular proliferation. A Western blot validating CRISPR-Cas9-generated isogenic knockout cell lines. B Proliferation of NIH3T3 parental and knockout cell lines generated in (A) (n = 3 technical replicates). C Western blot validating HRASG12V-overexpression in NIH3T3 parental and P2/AP1/AP2 KO cell lines. Phospho-MAPK (Erk1/2) (T202/Y204) used as a marker for activation of signaling pathways upon HRASG12V overexpression. D Representative images from soft agar colony formation assay performed in NIH3T3 parental and P2/AP1/AP2 KO cells expressing HRASG12V. Scale bar, 500 μm. E Quantification of colonies from (D) (n = 3 experimental replicates). F Oxygen consumption rate (OCR) measured by Seahorse ATP Rate Assay in NIH3T3 parental and P2/AP1/AP2 KO cell lines (n = 8 technical replicates). G OCR measured by Seahorse mitochondrial stress tests in NIH3T3 parental and NDI1-expressing P2/AP1/AP2 KO cell lines (n = 7 technical replicates). H Proliferation of nucleoside supplemented and NDI1 expressing NIH3T3 P2/AP1/AP2 cell lines (n = 3 technical replicates). I13C6-glucose metabolic labeling performed in NIH3T3 parental and P2/AP1/AP2 KO cell lines for 30 min and 5 h. Unlabeled, 13C-labeled (30 min), and 13C-labeled (5 h) samples are represented in brown, green, and blue colors, respectively. 13C-enrichments quantified from 1H-NMR spectra (n = 3 experimental replicates). J Western blot analysis of SEC fractions collected from NIH3T3 P2/AP1/AP2 KO native whole-cell lysates. Cell lysates were fractionated on a Superose 6 Increase 3.2/300 column. In the pictogram below SEC immunoblots, the double circle with dotted inner circle denotes multiple copies of PRPS1 forming homo-oligomers. Data are represented as mean ± SD for (B, E–H) and mean ± SEM for (I). Statistical comparisons made using one way ANOVA followed by Tukey’s HSD post hoc test (E, I). Source data are provided as a Source Data file.CC BY · PubMed Central
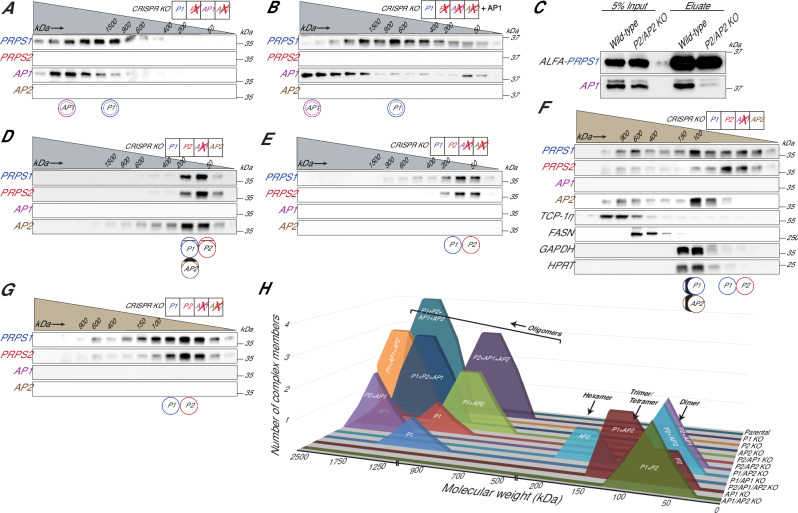
Fig. 5 PRPSAPs are molecular scaffolds with preferential binding partners among PRPS isozymes. A, B Western blot analysis of SEC fractions collected from native whole cell lysates of NIH3T3 P2/AP2 KO cells (A) and P2/AP1/AP2 KO cells stably expressing AP1 (B). C ALFA pulldown from whole cell extracts of NIH3T3 parental and P2/AP2 KO cells transiently transfected with PRPS1-ALFA. D–G Western blot analysis of SEC fractions collected from native whole-cell lysates of NIH3T3 AP1 KO cells (D), AP1/AP2 KO cells (E), AP1 KO cells (F), and AP1/AP2 KO cells (G). H Summary comparing SEC profiles from NIH3T3 parental and CRISPR KO lines. The x-axis represents relative molecular weight of the complex, and the y-axis represents the number of PRPS complex members interacting in the complex. Cell lysates for (A, B, D, and E) were fractionated on a Superose 6 Increase 3.2/300 column, while cell lysates for (F) and (G) were fractionated on a Yarra SEC-2000 column. Circular pictograms below SEC immunoblots schematize PRPS complex configurations. Double circle denotes multiple copies of the protein interacting in a heteromeric complex. Double circle with dotted inner circle denotes multiple copies forming homo-oligomers. Single circle denotes a single protein interacting within the complex. Circle with inner vertical lines denotes proteins forming a trimer or tetramer. Western blot data (A–G) are representative of at least 2 biological repeats. Source data are provided as a Source Data file.
Fig. 5 PRPSAPs are molecular scaffolds with preferential binding partners among PRPS isozymes. A, B Western blot analysis of SEC fractions collected from native whole cell lysates of NIH3T3 P2/AP2 KO cells (A) and P2/AP1/AP2 KO cells stably expressing AP1 (B). C ALFA pulldown from whole cell extracts of NIH3T3 parental and P2/AP2 KO cells transiently transfected with PRPS1-ALFA. D–G Western blot analysis of SEC fractions collected from native whole-cell lysates of NIH3T3 AP1 KO cells (D), AP1/AP2 KO cells (E), AP1 KO cells (F), and AP1/AP2 KO cells (G). H Summary comparing SEC profiles from NIH3T3 parental and CRISPR KO lines. The x-axis represents relative molecular weight of the complex, and the y-axis represents the number of PRPS complex members interacting in the complex. Cell lysates for (A, B, D, and E) were fractionated on a Superose 6 Increase 3.2/300 column, while cell lysates for (F) and (G) were fractionated on a Yarra SEC-2000 column. Circular pictograms below SEC immunoblots schematize PRPS complex configurations. Double circle denotes multiple copies of the protein interacting in a heteromeric complex. Double circle with dotted inner circle denotes multiple copies forming homo-oligomers. Single circle denotes a single protein interacting within the complex. Circle with inner vertical lines denotes proteins forming a trimer or tetramer. Western blot data (A–G) are representative of at least 2 biological repeats. Source data are provided as a Source Data file.CC BY · PubMed Central
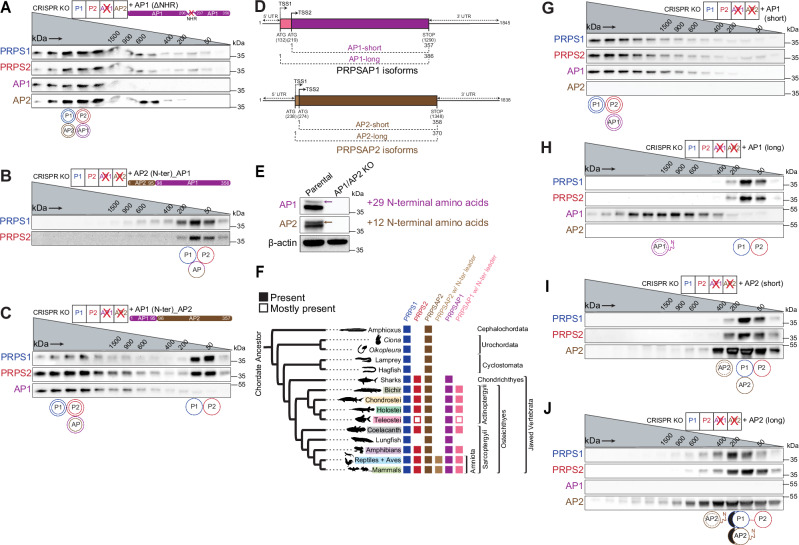
Fig. 6 Translation control of PRPS complex assembly. A–C Western blot analysis of SEC fractions collected from native whole-cell lysates of NIH3T3 AP1 KO cells stably expressing AP1 lacking the non-homologous region (NHR) (A), AP1/AP2 KO cells stably expressing chimeric AP1 with AP2’s N-terminus (residues 1–95) B and chimeric AP2 with AP1’s N-terminus (residues 1–95) (C). D Schematic representation of alternative start sites in mammalian AP1 and AP2 and their consequent translation into short and long isoforms. Base positions correspond to the mouse homologs. TSS1 and TSS2 represent upstream and downstream translation start sites, respectively. E Multiple isoforms for AP1 and AP2 detected under optimal SDS-PAGE resolution. Arrows in immunoblots indicate the longer isoforms of AP1 and AP2, corresponding to N-terminal leader sequences of 29 and 12 amino acids, respectively. F Phylogenetic distribution of PRPS homologs (PRPS1, PRPS2, PRPSAP2, PRPSAP2 with N-terminal leader sequence, PRPSAP1, and PRPSAP1 with N-terminal leader sequence) in chordates. Presence/absence noted across the tree. PRPSAP2 and PRPSAP1 isoforms with N-terminal leader sequences emerged in ancestors of Amniota and Osteichthyes, respectively. G–J Western blot analysis of SEC fractions collected from NIH3T3 AP1/AP2 KO cells stably expressing the short isoform of AP1 (G), long isoform of AP1 (H), short isoform of AP2 (I), and long isoform of AP2 (J). Cell lysates were fractionated on a Superose 6 Increase 3.2/300 column. Circular pictograms below SEC immunoblots schematize PRPS complex configurations. Double circle denotes multiple copies of the protein interacting in a heteromeric complex. Double circle with dotted inner circle denotes multiple copies forming homo-oligomers. Single circle denotes a single protein interacting within the complex. Circle with inner vertical lines denotes proteins forming a trimer or tetramer. Western blot data (A–C, E, G–J) are representative of at least 2 biological repeats. Source data are provided as a Source Data file.
Fig. 6 Translation control of PRPS complex assembly. A–C Western blot analysis of SEC fractions collected from native whole-cell lysates of NIH3T3 AP1 KO cells stably expressing AP1 lacking the non-homologous region (NHR) (A), AP1/AP2 KO cells stably expressing chimeric AP1 with AP2’s N-terminus (residues 1–95) B and chimeric AP2 with AP1’s N-terminus (residues 1–95) (C). D Schematic representation of alternative start sites in mammalian AP1 and AP2 and their consequent translation into short and long isoforms. Base positions correspond to the mouse homologs. TSS1 and TSS2 represent upstream and downstream translation start sites, respectively. E Multiple isoforms for AP1 and AP2 detected under optimal SDS-PAGE resolution. Arrows in immunoblots indicate the longer isoforms of AP1 and AP2, corresponding to N-terminal leader sequences of 29 and 12 amino acids, respectively. F Phylogenetic distribution of PRPS homologs (PRPS1, PRPS2, PRPSAP2, PRPSAP2 with N-terminal leader sequence, PRPSAP1, and PRPSAP1 with N-terminal leader sequence) in chordates. Presence/absence noted across the tree. PRPSAP2 and PRPSAP1 isoforms with N-terminal leader sequences emerged in ancestors of Amniota and Osteichthyes, respectively. G–J Western blot analysis of SEC fractions collected from NIH3T3 AP1/AP2 KO cells stably expressing the short isoform of AP1 (G), long isoform of AP1 (H), short isoform of AP2 (I), and long isoform of AP2 (J). Cell lysates were fractionated on a Superose 6 Increase 3.2/300 column. Circular pictograms below SEC immunoblots schematize PRPS complex configurations. Double circle denotes multiple copies of the protein interacting in a heteromeric complex. Double circle with dotted inner circle denotes multiple copies forming homo-oligomers. Single circle denotes a single protein interacting within the complex. Circle with inner vertical lines denotes proteins forming a trimer or tetramer. Western blot data (A–C, E, G–J) are representative of at least 2 biological repeats. Source data are provided as a Source Data file.CC BY · PubMed Central
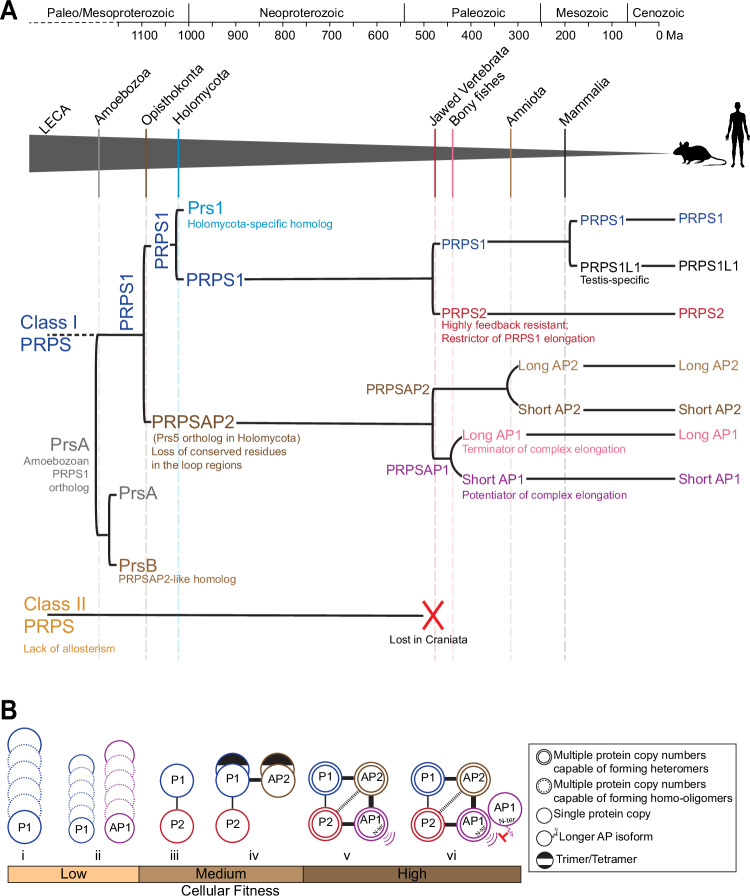
Fig. 7 Timeline of PRPS complex evolution in mammals and implications of distinct PRPS assembly states on cellular fitness. A Chronological duplication events of a Class I PRPS encoding gene in indicated eukaryotes. Grey triangle traces the evolutionary trajectory leading to the emergence of mammalian PRPS homologs. Solid vertical lines within the triangle denote the origin of major lineages; dashed lines indicate significant duplication events giving rise to PRPS homologs, with notable functional innovations occurring post-duplication. Class II PRPS, likely present in the LECA, is lost in craniates, followed by rapid expansion of Class I PRPS homologs in jawed vertebrates. Left square bracket indicates a gene duplication event; left round bracket indicates an extension at the N-terminus. Molecular clock-based evolutionary timeline (in millions of years before present, Ma) adapted from ref. 52. B Association of different PRPS complex configurations with cellular fitness in mammals (i) PRPS1 alone undergoes self-assembly to form homo-oligomers. (ii) PRPS1 and AP1 cannot interact directly and form separate homo-oligomers. (iii) PRPS2 binds PRPS1 to form a dimer and disrupts PRPS1 homotypic assemblies. (iv) AP2 preferentially binds with PRPS1 to form a trimer/tetramer to nucleate the complex. (v) AP1 preferentially binds with AP2 and PRPS2 to elongate the PRPS complex via its N-terminus. (vi) The longer isoform of AP1 with flexible N-terminal extension likely caps the complex. The weight of the connectors between the circles representing proteins reflects the predicted strength of protein-protein interactions; heavier lines indicate stronger predicted interactions.
Fig. 7 Timeline of PRPS complex evolution in mammals and implications of distinct PRPS assembly states on cellular fitness. A Chronological duplication events of a Class I PRPS encoding gene in indicated eukaryotes. Grey triangle traces the evolutionary trajectory leading to the emergence of mammalian PRPS homologs. Solid vertical lines within the triangle denote the origin of major lineages; dashed lines indicate significant duplication events giving rise to PRPS homologs, with notable functional innovations occurring post-duplication. Class II PRPS, likely present in the LECA, is lost in craniates, followed by rapid expansion of Class I PRPS homologs in jawed vertebrates. Left square bracket indicates a gene duplication event; left round bracket indicates an extension at the N-terminus. Molecular clock-based evolutionary timeline (in millions of years before present, Ma) adapted from ref. 52. B Association of different PRPS complex configurations with cellular fitness in mammals (i) PRPS1 alone undergoes self-assembly to form homo-oligomers. (ii) PRPS1 and AP1 cannot interact directly and form separate homo-oligomers. (iii) PRPS2 binds PRPS1 to form a dimer and disrupts PRPS1 homotypic assemblies. (iv) AP2 preferentially binds with PRPS1 to form a trimer/tetramer to nucleate the complex. (v) AP1 preferentially binds with AP2 and PRPS2 to elongate the PRPS complex via its N-terminus. (vi) The longer isoform of AP1 with flexible N-terminal extension likely caps the complex. The weight of the connectors between the circles representing proteins reflects the predicted strength of protein-protein interactions; heavier lines indicate stronger predicted interactions.CC BY · PubMed Central

Verification

Claims the paper makes

The claims and statistics of this paper haven’t been checked yet.

Run the check — free, no account needed. It reads the open-access text and checks the sources it cites.

A few free checks a day · papers already verified open instantly · results are public

Self-check

Percentages, sums and reported differences re-computed from the paper’s own numbers.

The self-check needs the paper’s full text.

Citations

Cites

Research works printed but not linked: 87

  1. Moody, E. R. R. et al. The nature of the last universal common ancestor and its impact on the early Earth system. Nat. Ecol. Evol. 1, 13 (2024).
  2. Crapitto, A. J., Campbell, A., Harris, A. & Goldman, A. D. A consensus view of the proteome of the last universal common ancestor. Ecol. Evol. 12, e8930 (2022). · DOI
  3. Feng, J.-M., Tian, H.-F. & Wen, J.-F. Origin and evolution of the eukaryotic SSU processome revealed by a comprehensive genomic analysis and implications for the origin of the nucleolus. Genome Biol. Evol. 5, 2255–2267 (2013). · DOI
  4. Kornberg, A., Lieberman, I. & Simms, E. S. Enzymatic synthesis and properties of 5-phosphoribosylpyrophosphate. J. Biol. Chem. 215, 389–402 (1955). · DOI
  5. Hove-Jensen, B. et al. Phosphoribosyl diphosphate (PRPP): biosynthesis, enzymology, utilization, and metabolic significance. Microbiol. Mol. Biol. Rev. 81, e00040–16 (2017). · DOI
  6. Eriksen, T. A., Kadziola, A., Bentsen, A. K., Harlow, K. W. & Larsen, S. Structural basis for the function of Bacillus subtilis phosphoribosyl-pyrophosphate synthetase. Nat. Struct. Biol. 7, 303–308 (2000). · DOI
  7. Timofeev, V. I. et al. Three-dimensional structure of phosphoribosyl pyrophosphate synthetase from E. coli at 2.71 Å resolution. Crystallogr. Rep. 61, 44–54 (2016). · DOI
  8. Li, S., Lu, Y., Peng, B. & Ding, J. Crystal structure of human phosphoribosylpyrophosphate synthetase 1 reveals a novel allosteric site. Biochem. J. 401, 39–47 (2007). · DOI
  9. Krath, B. N., Eriksen, T. A., Poulsen, T. S. & Hove-Jensen, B. Cloning and sequencing of cDNAs specifying a novel class of phosphoribosyl diphosphate synthase in Arabidopsis thaliana. Biochim. Biophys. Acta 1430, 403–408 (1999). · DOI
  10. Krath, B. N. & Hove-Jensen, B. Organellar and cytosolic localization of four phosphoribosyl diphosphate synthase isozymes in spinach. Plant Physiol. 119, 497–506 (1999). · DOI
  11. Sculaccio, S. A. et al. Sugarcane phosphoribosyl pyrophosphate synthetase: molecular characterization of a phosphate-independent PRS. Plant Mol. Biol. Rep. 26, 301–315 (2008). · DOI
  12. Rashid, N., Morikawa, M. & Imanaka, T. Gene cloning and characterization of recombinant ribose phosphate pyrophosphokinase from a hyperthermophilic archaeon. J. Ferment. Bioeng. 83, 412–418 (1997). · DOI
  13. Kadziola, A. et al. Novel Class III phosphoribosyl diphosphate synthase: structure and properties of the tetrameric, phosphate-activated, non-allosterically inhibited enzyme from Methanocaldococcus jannaschii. J. Mol. Biol. 354, 815–828 (2005). · DOI
  14. Cherney, M. M., Cherney, L. T., Garen, C. R. & James, M. N. G. The structures of Thermoplasma volcanium phosphoribosyl pyrophosphate synthetase bound to ribose-5-phosphate and ATP analogs. J. Mol. Biol. 413, 844–856 (2011). · DOI
  15. Andersen, R. W., Leggio, L. L., Hove-Jensen, B. & Kadziola, A. Structure of dimeric, recombinant Sulfolobus solfataricus phosphoribosyl diphosphate synthase: a bent dimer defining the adenine specificity of the substrate ATP. Extremophiles 19, 407–415 (2015). · DOI
  16. Becker, M. A. et al. Cloning of cDNAs for human phosphoribosylpyrophosphate synthetases 1 and 2 and X chromosome localization of PRPS1 and PRPS2 genes. Genomics 8, 555–561 (1990). · DOI
  17. Taira, M. et al. A human testis-specific mRNA for phosphoribosylpyrophosphate synthetase that initiates from a non-AUG codon. J. Biol. Chem. 265, 16491–16497 (1990). · DOI
  18. Ishizuka, T. et al. Cloning and sequencing of human complementary DNA for the phosphoribosylpyrophosphate synthetase-associated protein 39. Biochim. Biophys. Acta (BBA) - Gene Struct. Expr. 1306, 27–30 (1996). · DOI
  19. Katashima, R. et al. Molecular cloning of a human cDNA for the 41-kDa phosphoribosylpyrophosphate synthetase-associated protein1. Biochim. Biophys. Acta (BBA) - Gene Struct. Expr. 1396, 245–250 (1998). · DOI
  20. Becker, M. A., Meyer, L. J., Huisman, W. H., Lazar, C. & Adams, W. B. Human erythrocyte phosphoribosylpyrophosphate synthetase. Subunit analysis and states of subunit association. J. Biol. Chem. 252, 3911–3918 (1977). · DOI
  21. Kita, K., Otsuki, T., Ishizuka, T. & Tatibana, M. Rat liver phosphoribosyl pyrophosphate synthetase: existence of the purified enzyme as heterogeneous aggregates and identification of the catalytic subunit. J. Biochem. 105, 736–741 (1989). · DOI
  22. Tatibana, M. et al. Mammalian phosphoribosyl-pyrophosphate synthetase. Adv. Enzym. Regul. 35, 229–249 (1995). · DOI
  23. Hove-Jensen, B., Harlow, K. W., King, C. J. & Switzer, R. L. Phosphoribosylpyrophosphate synthetase of Escherichia coli. Properties of the purified enzyme and primary structure of the prs gene. J. Biol. Chem. 261, 6765–6771 (1986). · DOI
  24. Donini, S. et al. Biochemical and structural investigations on phosphoribosylpyrophosphate synthetase from Mycobacterium smegmatis. PLoS ONE 12, e0175815 (2017). · DOI
  25. Pei, W. et al. Additive reductions in zebrafish PRPS1 activity result in a spectrum of deficiencies modeling several human PRPS1-associated diseases. Sci. Rep. 6, 29946 (2016). · DOI
  26. Carter, A. T. et al. PRS1 is a key member of the gene family encoding phosphoribosylpyrophosphate synthetase in Saccharomyces cerevisiae. Mol. Gen. Genet. 254, 148–156 (1997). · DOI
  27. Burki, F., Roger, A. J., Brown, M. W. & Simpson, A. G. B. The new tree of eukaryotes. Trends Ecol. Evol. 35, 43–55 (2020). · DOI · Paper page
  28. Merényi, Z. et al. Genomes of fungi and relatives reveal delayed loss of ancestral gene families and evolution of key fungal traits. Nat. Ecol. Evol. 7, 1221–1231 (2023). · DOI
  29. Williamson, K. et al. A robustly rooted tree of eukaryotes reveals their excavate ancestry. Nature 640, 974–981 (2025). · DOI
  30. Ohno, S. Evolution by Gene Duplication (Springer-Verlag, New York, 1970). · DOI · Paper page
  31. Yu, D. et al. Hagfish genome elucidates vertebrate whole-genome duplication events and their evolutionary consequences. Nat. Ecol. Evol. 8, 519–535 (2024). · DOI
  32. Chen, P. et al. Crystal and EM structures of human phosphoribosyl pyrophosphate synthase I (PRS1) provide novel insights into the disease-associated mutations. PLoS ONE 10, e0120304 (2015). · DOI
  33. Hvorecny, K. L., Hargett, K., Quispe, J. D. & Kollman, J. M. Human PRPS1 filaments stabilize allosteric sites to regulate activity. Nat. Struct. Mol. Biol. 30, 391–402 (2023). · DOI
  34. Lu, G.-M. et al. Structural basis of human PRPS2 filaments. Cell Biosci. 13, 100 (2023). · DOI
  35. Switzer, R. L. Regulation and mechanism of phosphoribosylpyrophosphate synthetase. 3. Kinetic studies of the reaction mechanism. J. Biol. Chem. 246, 2447–2458 (1971). · DOI
  36. Switzer, R. L. & Sogin, D. C. Regulation and mechanism of phosphoribosylpyrophosphate synthetase. V. Inhibition by end products and regulation by adenosine diphosphate. J. Biol. Chem. 248, 1063–1073 (1973). · DOI
  37. Hove-Jensen, B., Bentsen, A.-K. K. & Harlow, K. W. Catalytic residues Lys197 and Arg199 of Bacillus subtilis phosphoribosyl diphosphate synthase. FEBS J. 272, 3631–3639 (2005). · DOI
  38. Al-Maawali, A. et al. Prenatal growth restriction, retinal dystrophy, diabetes insipidus and white matter disease: expanding the spectrum of PRPS1-related disorders. Eur. J. Hum. Genet 23, 310–316 (2015). · DOI
  39. Hu, H.-H. et al. Filamentation modulates allosteric regulation of PRPS. eLife 11, e79552 (2022). · DOI
  40. Taira, M., Iizasa, T., Yamada, K., Shimada, H. & Tatibana, M. Tissue-differential expression of two distinct genes for phosphoribosyl pyrophosphate synthetase and existence of the testis-specific transcript. Biochim. Biophys. Acta (BBA) - Gene Struct. Expr. 1007, 203–208 (1989). · DOI
  41. Hove-Jensen, B. Heterooligomeric phosphoribosyl diphosphate synthase of Saccharomyces cerevisiae: combinatorial expression of the five PRS genes in Escherichia coli. J. Biol. Chem. 279, 40345–40350 (2004). · DOI
  42. Ugbogu, E. A., Schweizer, L. M. & Schweizer, M. Contribution of model organisms to investigating the far-reaching consequences of PRPP metabolism on human health and well-being. Cells 11, 1909 (2022). · DOI
  43. Gaglio, D. et al. Oncogenic K-Ras decouples glucose and glutamine metabolism to support cancer cell growth. Mol. Syst. Biol. 7, 523 (2011). · DOI · Paper page
  44. MacMillan, A. C. et al. PRPS activity tunes redox homeostasis in Myc-driven lymphoma. Redox Biol. 103649, 2213–2317 (2025).
  45. Zhang, Y. et al. Upregulation of antioxidant capacity and nucleotide precursor availability suffices for oncogenic transformation. Cell Metab. 33, 94–109.e8 (2021). · DOI
  46. Seo, B. B., Matsuno-Yagi, A. & Yagi, T. Modulation of oxidative phosphorylation of human kidney 293 cells by transfection with the internal rotenone-insensitive NADH-quinone oxidoreductase (NDI1) gene of Saccharomyces cerevisiae. Biochim. Biophys. Acta 1412, 56–65 (1999). · DOI
  47. Banani, S. F., Lee, H. O., Hyman, A. A. & Rosen, M. K. Biomolecular condensates: organizers of cellular biochemistry. Nat. Rev. Mol. Cell Biol. 18, 285–298 (2017). · DOI
  48. Lane, N. How energy flow shapes cell evolution. Curr. Biol. 30, R471–R476 (2020). · DOI
  49. Tawfik, D. S. Loop grafting and the origins of enzyme species. Science 311, 475–476 (2006). · DOI
  50. Gunasekaran, K., Ma, B. & Nussinov, R. Triggering loops and enzyme function: identification of loops that trigger and modulate movements. J. Mol. Biol. 332, 143–159 (2003). · DOI
  51. Tokuriki, N. & Tawfik, D. S. Protein dynamism and evolvability. Science 324, 203–207 (2009). · DOI
  52. Sinha, S. C. & Smith, J. L. The PRT protein family. Curr. Opin. Struct. Biol. 11, 733–739 (2001). · DOI
  53. Jing, X. et al. Cell-cycle-dependent phosphorylation of PRPS1 fuels nucleotide synthesis and promotes tumorigenesis. Cancer Res. 79, 4650–4664 (2019). · DOI
  54. Zhang, F. et al. Arginylation regulates purine nucleotide biosynthesis by enhancing the activity of phosphoribosyl pyrophosphate synthase. Nat. Commun. 6, 7517 (2015). · DOI
  55. Qian, X. et al. Conversion of PRPS hexamer to monomer by AMPK-mediated phosphorylation inhibits nucleotide synthesis in response to energy stress. Cancer Discov. 8, 94–107 (2018). · DOI
  56. Nosal, J. M., Switzer, R. L. & Becker, M. A. Overexpression, purification, and characterization of recombinant human 5-phosphoribosyl-1-pyrophosphate synthetase isozymes I and II. J. Biol. Chem. 268, 10168–10175 (1993). · DOI
  57. Markert, C. L. & Møller, F. Multiple forms of enzymes: tissue, ontogenetic, and species specific patterns. Proc. Natl Acad. Sci. USA45, 753–763 (1959). · DOI
  58. Sarnesto, A., Linder, N. & Raivio, K. O. Organ distribution and molecular forms of human xanthine dehydrogenase/xanthine oxidase protein. Lab. Invest. 74, 48–56 (1996).
  59. Fondy, T. P. & Kaplan, N. O. Structural and functional properties of the H and M subunits of lactic dehydrogenases. Ann. N. Y. Acad. Sci. 119, 888–904 (1965). · DOI
  60. Fernandes, P. M., Kinkead, J., McNae, I., Michels, P. A. M. & Walkinshaw, M. D. Biochemical and transcript level differences between the three human phosphofructokinases show optimisation of each isoform for specific metabolic niches. Biochem. J. 477, 4425–4441 (2020). · DOI
  61. Tran, D. H. et al. De novo and salvage purine synthesis pathways across tissues and tumors. Cell 187, 3602–3618.e20 (2024). · DOI · Paper page
  62. Sperling, O., Eilam, G., Sara, P.-B. & De Vries, A. Accelerated erythrocyte 5-phosphoribosyl-1-pyrophosphate synthesis. A familial abnormality associated with excessive uric acid production and gout. Biochem. Med. 6, 310–316 (1972). · DOI
  63. Zoref, E., De Vries, A. & Sperling, O. Mutant feedback-resistant phosphoribosylpyrophosphate synthetase associated with purine overproduction and gout. Phosphoribosylpyrophosphate and purine metabolism in cultured fibroblasts. J. Clin. Invest. 56, 1093–1099 (1975). · DOI
  64. de Brouwer, A. P. M. et al. PRPS1 mutations: four distinct syndromes and potential treatment. Am. J. Hum. Genet. 86, 506–518 (2010). · DOI
  65. Becker, M. A., Taylor, W., Smith, P. R. & Ahmed, M. Overexpression of the normal phosphoribosylpyrophosphate synthetase 1 isoform underlies catalytic superactivity of human phosphoribosylpyrophosphate synthetase *. J. Biol. Chem. 271, 19894–19899 (1996). · DOI
  66. Altschul, S. F., Gish, W., Miller, W., Myers, E. W. & Lipman, D. J. Basic local alignment search tool. J. Mol. Biol. 215, 403–410 (1990). · DOI · Paper page
  67. Leinonen, R., Sugawara, H. & Shumway, M. The sequence read archive. Nucleic Acids Res. 39, D19 (2011). · DOI
  68. Martin, F. J. et al. Ensembl 2023. Nucleic Acids Res. 51, D933–D941 (2023). · DOI
  69. Sievers, F. et al. Fast, scalable generation of high-quality protein multiple sequence alignments using Clustal Omega. Mol. Syst. Biol. 7, 539 (2011). · DOI
  70. Edgar, R. C. MUSCLE: multiple sequence alignment with high accuracy and high throughput. Nucleic Acids Res. 32, 1792–1797 (2004). · DOI · Paper page
  71. Crooks, G. E., Hon, G., Chandonia, J.-M. & Brenner, S. E. WebLogo: a Sequence Logo Generator. Genome Res. 14, 1188–1190 (2004). · DOI
  72. Chen, Y. et al. MetaLogo: a heterogeneity-aware sequence logo generator and aligner. Brief. Bioinform. 23, bbab591 (2022). · DOI
  73. Šali, A. & Blundell, T. L. Comparative protein modelling by satisfaction of spatial restraints. J. Mol. Biol. 234, 779–815 (1993). · DOI · Paper page
  74. Pettersen, E. F. et al. UCSF chimeraX: structure visualization for researchers, educators, and developers. Protein Sci. 30, 70–82 (2021). · DOI
  75. Mirdita, M. et al. ColabFold: making protein folding accessible to all. Nat. Methods 19, 679–682 (2022). · DOI · Paper page
  76. Götzke, H. et al. The ALFA-tag is a highly versatile tool for nanobody-based bioscience applications. Nat. Commun. 10, 4403 (2019). · DOI
  77. Lee, L., Kelly, R. E., Pastra-Landis, S. C. & Evans, D. R. Oligomeric structure of the multifunctional protein CAD that initiates pyrimidine biosynthesis in mammalian cells. Proc. Natl. Acad. Sci. USA 82, 6802–6806 (1985). · DOI
  78. Gestaut, D., Limatola, A., Joachimiak, L. & Frydman, J. The ATP-powered gymnastics of TRiC/CCT: an asymmetric protein folding machine with a symmetric origin story. Curr. Opin. Struct. Biol. 55, 50–58 (2019). · DOI
  79. Chirala, S. S., Jayakumar, A., Gu, Z.-W. & Wakil, S. J. Human fatty acid synthase: role of interdomain in the formation of catalytically active synthase dimer. Proc. Natl. Acad. Sci. USA 98, 3104–3108 (2001). · DOI
  80. Enroth, C. et al. Crystal structures of bovine milk xanthine dehydrogenase and xanthine oxidase: structure-based mechanism of conversion. Proc. Natl. Acad. Sci. USA 97, 10723–10728 (2000). · DOI · Paper page
  81. Ismail, S. A. & Park, H. W. Structural analysis of human liver glyceraldehyde-3-phosphate dehydrogenase. Acta Crystallogr. D. Biol. Crystallogr. 61, 1508–1513 (2005). · DOI
  82. Shi, W. et al. The 2.0 Å structure of human hypoxanthine-guanine phosphoribosyltransferase in complex with a transition-state analog inhibitor. Nat. Struct. Mol. Biol. 6, 588–593 (1999). · DOI
  83. Uhlén, M. et al. Proteomics. Tissue-based map of the human proteome. Science 347, 1260419 (2015). · DOI · Paper page
  84. Schneider, C. A., Rasband, W. S. & Eliceiri, K. W. NIH Image to ImageJ: 25 years of image analysis. Nat. Methods 9, 671–675 (2012). · DOI · Paper page
  85. Fan, T. W.-M., Lane, A. N., Higashi, R. M. & Yan, J. Stable isotope resolved metabolomics of lung cancer in a SCID mouse model. Metabolomics 7, 257–269 (2011). · DOI
  86. Wishart, D. S. et al. HMDB 5.0: the human metabolome database for 2022. Nucleic Acids Res. 50, D622–D631 (2022). · DOI
  87. Ulrich, E. L. et al. BioMagResBank. Nucleic Acids Res. 36, D402–D408 (2008). · DOI

Metadata

Authors
Karki, B. R., MacMillan, A. C., Vicente-Muñoz, S., Greis, K. D., Romick, L. E., & Cunningham, J. T.
Affiliations
  • University of Cincinnati (US)
  • Cincinnati Children's Hospital Medical Center (US)
Corresponding author
Cunningham, John T.
Venue
Nature Communications
Published
2025-07-08
Volume
16
Issue
1
Pages
6076-6076
ISSN
2041-1723 (ISSN-L)
OpenAlex
W4412102667
Cited by
11
References
8
Citations by year
2026: 7 · 2025: 4
FWCI
3.31
Type
journal article
Language
en
Open access
Locations
  • Nature Communications (publishedVersion, cc-by)
  • bioRxiv (Cold Spring Harbor Laboratory) (acceptedVersion, cc-by)
  • PubMed Central (publishedVersion, cc-by)
  • PubMed (publishedVersion)
  • PubMed Central (submittedVersion, cc-by)
  • DOAJ (DOAJ: Directory of Open Access Journals) (submittedVersion, cc-by-sa)
Funders
  • U.S. Department of Health & Human Services | NIH | National Cancer Institute (R01CA230904)
  • U.S. Department of Health & Human Services | NIH | National Institute of General Medical Sciences (R35GM133561)
  • U.S. Department of Health & Human Services | National Institutes of Health (S10OD026717)
Topics
  • Life Sciences › Biochemistry, Genetics and Molecular Biology › Molecular Biology › Biochemical and Molecular Research
  • Life Sciences › Biochemistry, Genetics and Molecular Biology › Molecular Biology › RNA and protein synthesis mechanisms
  • Life Sciences › Biochemistry, Genetics and Molecular Biology › Molecular Biology › Genomics and Phylogenetic Studies
Keywords
phosphoribosylpyrophosphate synthetase, gene duplication, complex assembly, nucleotide synthesis, eukaryotic evolution, isogenic cell lines, enzyme regulation, mammalian metabolism

About these checks

Registry, retraction, Cites and statistics results are computed, not judged, with one exception: a printed reference that no index lists is read once by a model before it counts as a citation error. Claims are extracted by a model and kept only when their quote appears verbatim in the text; each cited source is then checked, with a model’s help, for whether it says what the claim relies on. Those verdicts can be wrong — read the claim’s quote and the cited source before relying on one.

Statistics and arithmetic are recomputed, not judged.

Confidence bands are shown only for fields calibrated on our annotated test set. None is calibrated yet, so no band is shown.

What counts as a claim ›How we measure confidence ›How we check this ›

Are you an author, or do you see a problem with this page? Request a review