Cited by 1Powdery Mildew Fungal DiseasesWheat and Barley Genetics and PathologyPlant-Microbe Interactions and Immunity

The DOI matches its Crossref record; 2 of the 2 references it cites were found in a registry or an index.

Dual recognition of structurally unrelated mildew effectors underlies the broad-spectrum resistance of Pm3e in wheat

Open access

Published version of a preprint

Abstract

Broad-spectrum resistance genes are highly valuable for sustainable crop protection, yet the molecular basis of their activity is often unknown. The Pm3 allelic series in wheat encodes NLR receptors that recognize avirulence (AVR) effectors of wheat powdery mildew. Here, we show that near-identical Pm3 alleles vary greatly in resistance efficacy and broadness against a global mildew isolate collection and subsequently use this model system to study the mechanisms underlying broad-spectrum resistance. We demonstrate that two alleles, Pm3d and Pm3e , provide resistance against most isolates worldwide, by each recognizing two AVR genes, thereby lowering the risk of resistance breakdown. Pm3d recognizes two highly similar RNase-like AVRs, encoded by gene paralogs. In contrast, Pm3e detects two structurally diverse AVRs: one shared with Pm3d, the other originating from a large, uncharacterized protein family with a discrete structural fold. Using chimeric Pm3 NLRs, we identify specificity-defining polymorphisms of Pm3d and Pm3e against their diverse effector targets. Lastly, we demonstrate that Pm3d and Pm3e activities can be combined in engineered Pm3 NLRs, thereby further extending their recognition spectrum. Our findings highlight the potential of Pm3 immune receptors for long-lasting wheat protection by demonstrating their versatility in recognizing structurally diverse effectors and their amenability to NLR engineering.

Overview

The claims and statistics of this paper haven’t been checked yet.

Run the check — free, no account needed. It reads the open-access text and checks the sources it cites.

A few free checks a day · papers already verified open instantly · results are public

Integrity signals

Registry

Crossref · 10.1038/s41467-026-72199-w

Cites

2 of 2 references verified0 citation errors · 0 not checkable

Statistics

Figures

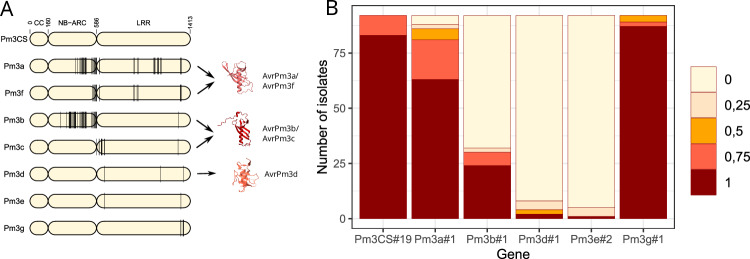
Fig. 1 Pm3e and Pm3d provide broad-spectrum resistance against a global Bgt population. A Schematic representation of NLR variants encoded by allelic Pm3 genes. Black lines indicate amino acid polymorphisms compared to the ancestral, non-functional Pm3CS variant serving as a reference. AlphaFold models of the known AvrPm3a/f, AvrPm3b/c, and AvrPm3d avirulence proteins are included. Black arrows indicate recognition of the AvrPm3 proteins by their corresponding Pm3 NLR variants. B Summary of the resistance response of transgenic lines expressing individual Pm3 alleles in the wheat cultivar ‘Bobwhite’ against a global collection of 92 Bgt isolates. Bgt leaf coverage was assessed 8-9 days after infection using a scale with five categories ranging from 0 (0% leaf coverage) to 1 (100% leaf coverage).
Fig. 1 Pm3e and Pm3d provide broad-spectrum resistance against a global Bgt population. A Schematic representation of NLR variants encoded by allelic Pm3 genes. Black lines indicate amino acid polymorphisms compared to the ancestral, non-functional Pm3CS variant serving as a reference. AlphaFold models of the known AvrPm3a/f, AvrPm3b/c, and AvrPm3d avirulence proteins are included. Black arrows indicate recognition of the AvrPm3 proteins by their corresponding Pm3 NLR variants. B Summary of the resistance response of transgenic lines expressing individual Pm3 alleles in the wheat cultivar ‘Bobwhite’ against a global collection of 92 Bgt isolates. Bgt leaf coverage was assessed 8-9 days after infection using a scale with five categories ranging from 0 (0% leaf coverage) to 1 (100% leaf coverage).CC BY · PubMed Central
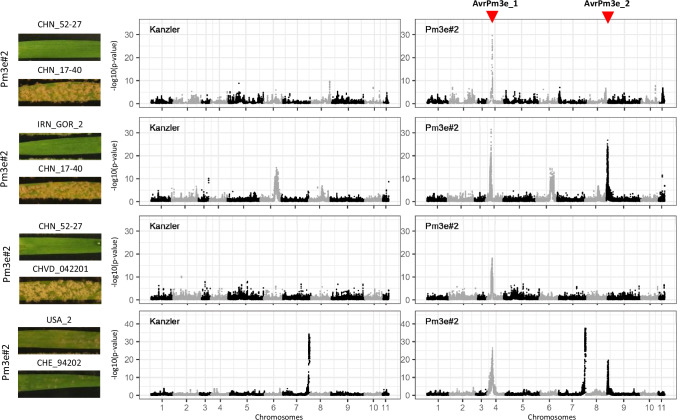
Fig. 2 Avirulence depletion mapping in Bgt reveals two genetic loci associated with avirulence on Pm3e. Avirulence depletion mapping of AvrPm3e loci in four independent crosses between Bgt isolates. Virulence phenotypes of the parental isolates on the Pm3e#2 transgenic wheat line are shown on the left. Statistical analysis of sequenced F1 bulks grown on ‘Kanzler’ (non-selected control) or selected on the Pm3e#2 transgenic line (Pm3e-selected) reveal regions with deviations from an expected 1:1 parental genotype ratio, indicating avirulence allele depletion. Datapoints represent individual SNP markers along the 11 chromosomes of Bgt isolate CHE_96224 (x-axis) with their -log10 transformed p-values (y-axis) when testing for deviation from expected 1:1 segregation (G-test). The two genomic regions exhibiting Pm3e-specific depletion signals are highlighted and labeled as AvrPm3e_1 (common to all four crosses) and AvrPm3e_2 (only found in the IRN_GOR_2 x CHN_17-40 and the USA_2 x CHE_94202 crosses).
Fig. 2 Avirulence depletion mapping in Bgt reveals two genetic loci associated with avirulence on Pm3e. Avirulence depletion mapping of AvrPm3e loci in four independent crosses between Bgt isolates. Virulence phenotypes of the parental isolates on the Pm3e#2 transgenic wheat line are shown on the left. Statistical analysis of sequenced F1 bulks grown on ‘Kanzler’ (non-selected control) or selected on the Pm3e#2 transgenic line (Pm3e-selected) reveal regions with deviations from an expected 1:1 parental genotype ratio, indicating avirulence allele depletion. Datapoints represent individual SNP markers along the 11 chromosomes of Bgt isolate CHE_96224 (x-axis) with their -log10 transformed p-values (y-axis) when testing for deviation from expected 1:1 segregation (G-test). The two genomic regions exhibiting Pm3e-specific depletion signals are highlighted and labeled as AvrPm3e_1 (common to all four crosses) and AvrPm3e_2 (only found in the IRN_GOR_2 x CHN_17-40 and the USA_2 x CHE_94202 crosses).CC BY · PubMed Central
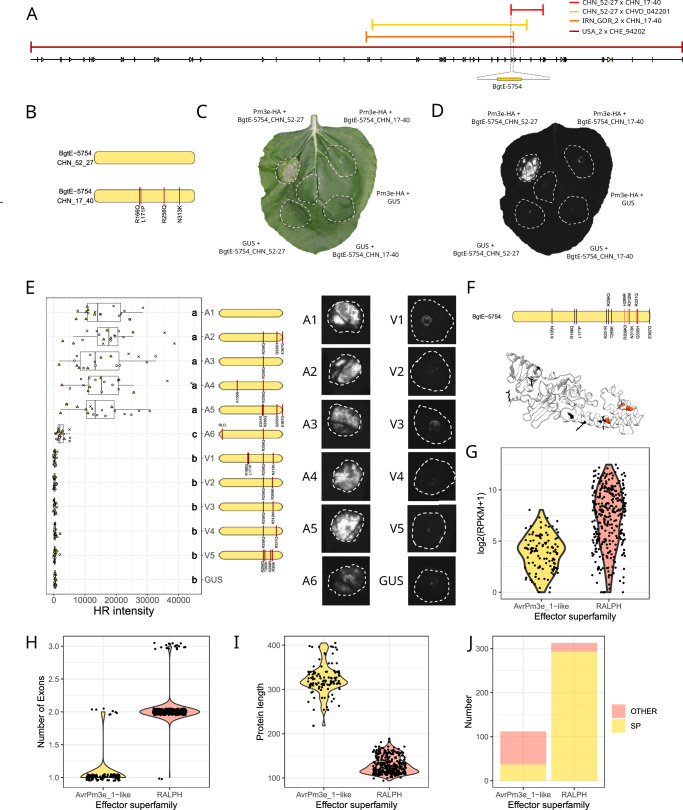
Fig. 3 AvrPm3e_1 (BgtE-5754) belongs to a structurally defined family of Bgt effectors, distinct from RALPH effector proteins. A A single genomic region on chromosome 04 exhibits a Pm3e-specific depletion signal in all four crosses. Regions with the strongest depletion signal (see Fig. 2) for each cross are shown in the CHE_96224 reference genome. The AvrPm3e_1 candidate locus (overlap between all four crosses) contains a single effector gene, BgtE-5754, which exhibits non-synonymous polymorphisms between the parental isolates of all four crosses. B Structural model of the AvrPm3e_1 candidate effector BgtE-5754 in the Pm3e-avirulent isolate CHN_52-27 and the virulent isolate CHN_17-40, with non-synonymous polymorphisms (red lines). C, D Agrobacterium-mediated co-expression of BgtE-5754_CHN_52-27 (BgtE-5754-A1) or BgtE-5754_CHN_17-40 (BgtE-5754-V1) with Pm3e-HA or a GUS negative control in N. benthamiana. Leaves were imaged with a standard camera (C) or a Fusion FX imager (D). The experiment was repeated three times with n = 6 leaves per experiment (n = 18). E Agrobacterium-mediated co-expression of Pm3e-HA with various BgtE-5754 (AvrPm3e_1) variants or GUS. Boxplots show HR intensities from 18 infiltration spots across three experiments (symbols indicate experiments). Boxes represent the interquartile range (IQR; 25–75%) with the thick horizontal line indicating the median, and whiskers extending to the most extreme values within 1.5×IQR. Letters above boxplots denote statistically significant differences at p < 0.05 based on Dunn’s test. Details and exact p-values for statistical tests are reported in Supplementary Dataset 4. Representative pictures for each combination are shown. F Schematic representation of the BgtE-5754 effector protein showing all naturally occurring amino acid polymorphisms found in Bgt compared to the BgtE-5754-A1 variant. AlphaFold3 structural prediction of BgtE-5754 is shown below. Model quality scores are provided in Supplementary Fig. 5. Polymorphisms in black have no effect on Pm3e recognition; red ones disrupt recognition. G, J Comparison between AvrPm3e_1-like genes/proteins and those belonging to the RALPH effector family. Datapoints represent individual effectors. G Effector expression levels in reference isolate CHE_96224 at two days post-inoculation. H Number of exons per gene. I Protein length of all family members. J Number of proteins predicted to have a signal peptide (SignalP6.0).
Fig. 3 AvrPm3e_1 (BgtE-5754) belongs to a structurally defined family of Bgt effectors, distinct from RALPH effector proteins. A A single genomic region on chromosome 04 exhibits a Pm3e-specific depletion signal in all four crosses. Regions with the strongest depletion signal (see Fig. 2) for each cross are shown in the CHE_96224 reference genome. The AvrPm3e_1 candidate locus (overlap between all four crosses) contains a single effector gene, BgtE-5754, which exhibits non-synonymous polymorphisms between the parental isolates of all four crosses. B Structural model of the AvrPm3e_1 candidate effector BgtE-5754 in the Pm3e-avirulent isolate CHN_52-27 and the virulent isolate CHN_17-40, with non-synonymous polymorphisms (red lines). C, D Agrobacterium-mediated co-expression of BgtE-5754_CHN_52-27 (BgtE-5754-A1) or BgtE-5754_CHN_17-40 (BgtE-5754-V1) with Pm3e-HA or a GUS negative control in N. benthamiana. Leaves were imaged with a standard camera (C) or a Fusion FX imager (D). The experiment was repeated three times with n = 6 leaves per experiment (n = 18). E Agrobacterium-mediated co-expression of Pm3e-HA with various BgtE-5754 (AvrPm3e_1) variants or GUS. Boxplots show HR intensities from 18 infiltration spots across three experiments (symbols indicate experiments). Boxes represent the interquartile range (IQR; 25–75%) with the thick horizontal line indicating the median, and whiskers extending to the most extreme values within 1.5×IQR. Letters above boxplots denote statistically significant differences at p < 0.05 based on Dunn’s test. Details and exact p-values for statistical tests are reported in Supplementary Dataset 4. Representative pictures for each combination are shown. F Schematic representation of the BgtE-5754 effector protein showing all naturally occurring amino acid polymorphisms found in Bgt compared to the BgtE-5754-A1 variant. AlphaFold3 structural prediction of BgtE-5754 is shown below. Model quality scores are provided in Supplementary Fig. 5. Polymorphisms in black have no effect on Pm3e recognition; red ones disrupt recognition. G, J Comparison between AvrPm3e_1-like genes/proteins and those belonging to the RALPH effector family. Datapoints represent individual effectors. G Effector expression levels in reference isolate CHE_96224 at two days post-inoculation. H Number of exons per gene. I Protein length of all family members. J Number of proteins predicted to have a signal peptide (SignalP6.0).CC BY · PubMed Central
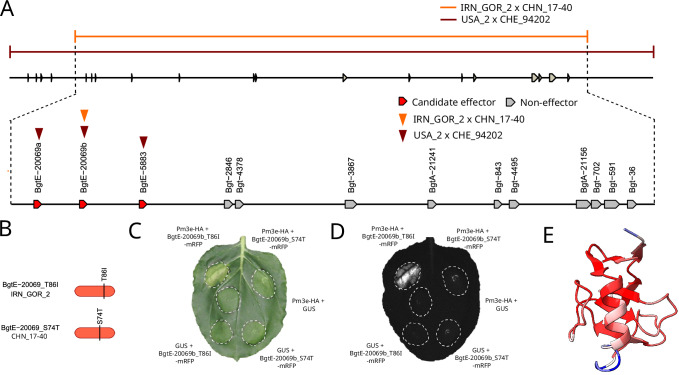
Fig. 4 AvrPm3e_2 (BgtE-20069b) is a RALPH effector. A Genomic region on chromosome 09 exhibiting a Pm3e-specific depletion signal in two out of four crosses (IRN_GOR_2 x CHN_17-40 and USA_2 x CHE_94202). Regions with the strongest depletion signal for both crosses are shown and aligned to the CHE_96224 reference genome. The AvrPm3e_2 candidate locus, defined by the overlap between both crosses, in the reference genome CHE_96224 is shown as a zoom-in. Effector genes (red) and non-effector genes (gray) are represented by arrows. Gene models are not drawn to scale. Effectors exhibiting non-synonymous polymorphisms in the parental isolates of individual crosses are marked by orange (IRN_GOR-2 x CHN_17-40) and dark red (USA_2 x CHE_94202) arrowheads. B Schematic protein model of the AvrPm3e_2 candidate effector BgtE-20069b in the Pm3e-avirulent isolate IRN_GOR-2 and virulent isolate CHN_17-40. Sequence polymorphisms are defined in comparison with BgtE-20069b sequence in the CHE_96224 reference isolate and are highlighted by black lines. C, D Agrobacterium-mediated co-expression of BgtE-20069b_T86I-mRFP or BgtE-20069b_S74T-mRFP with Pm3e-HA or a GUS negative control in N. benthamiana. Leaves were imaged with a camera (C) or a Fusion FX imager (D). The experiment was performed three times with n = 6 leaves per experiment (total n = 18). E Predicted 3D structure of BgtE-20069b_T86I according to Alphafold3 modeling. Coloring represents predicted local distance difference test (pLDDT) local confidence according to Alphafold (100 (dark red) – 0 (dark blue)).
Fig. 4 AvrPm3e_2 (BgtE-20069b) is a RALPH effector. A Genomic region on chromosome 09 exhibiting a Pm3e-specific depletion signal in two out of four crosses (IRN_GOR_2 x CHN_17-40 and USA_2 x CHE_94202). Regions with the strongest depletion signal for both crosses are shown and aligned to the CHE_96224 reference genome. The AvrPm3e_2 candidate locus, defined by the overlap between both crosses, in the reference genome CHE_96224 is shown as a zoom-in. Effector genes (red) and non-effector genes (gray) are represented by arrows. Gene models are not drawn to scale. Effectors exhibiting non-synonymous polymorphisms in the parental isolates of individual crosses are marked by orange (IRN_GOR-2 x CHN_17-40) and dark red (USA_2 x CHE_94202) arrowheads. B Schematic protein model of the AvrPm3e_2 candidate effector BgtE-20069b in the Pm3e-avirulent isolate IRN_GOR-2 and virulent isolate CHN_17-40. Sequence polymorphisms are defined in comparison with BgtE-20069b sequence in the CHE_96224 reference isolate and are highlighted by black lines. C, D Agrobacterium-mediated co-expression of BgtE-20069b_T86I-mRFP or BgtE-20069b_S74T-mRFP with Pm3e-HA or a GUS negative control in N. benthamiana. Leaves were imaged with a camera (C) or a Fusion FX imager (D). The experiment was performed three times with n = 6 leaves per experiment (total n = 18). E Predicted 3D structure of BgtE-20069b_T86I according to Alphafold3 modeling. Coloring represents predicted local distance difference test (pLDDT) local confidence according to Alphafold (100 (dark red) – 0 (dark blue)).CC BY · PubMed Central
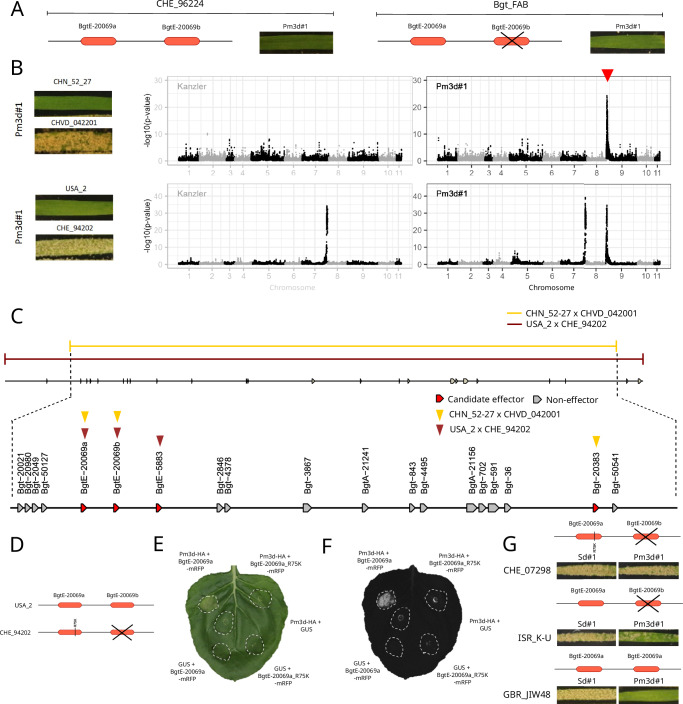
Fig. 5 Avirulence on Pm3d is controlled by two neighboring paralogous AVR genes encoding highly similar RALPH effector proteins. A The UV mutant Bgt_FAB exhibits an avirulent phenotype on the Pm3d#1 wheat line, despite carrying a deletion of the BgtE-20069b (AvrPm3d_1/AvrPm3e_2) effector gene. The phenotype of wild type Bgt isolate CHE_96224, used for UV mutagenesis, is shown as comparison. B Avirulence depletion mapping on Pm3d in two Bgt crosses. Virulence phenotypes of the parental isolates on the Pm3d#1 line are shown. Statistical analysis of sequenced F1 bulks selected on ‘Kanzler’ (non-selected control) or the Pm3d#1 line (Pm3d-selected) are shown on the right. ‘Kanzler’ bulks are drawn with gray lines to represent that these panels were reprinted from Fig. 2. Datapoints represent individual SNP markers along the 11 chromosomes of Bgt isolate CHE_96224 (x-axis) with their -log10 transformed p-values (y-axis) when testing for deviation from expected 1:1 segregation (G-test). Pm3d-specific depletion signal is indicated by a red arrowhead. C The AvrPm3d candidate locus, defined by the overlap between both crosses, in the reference genome CHE_96224. Effector genes (red) and non-effector genes (gray) are represented by arrows. Gene models are not drawn to scale. Effectors exhibiting non-synonymous polymorphisms in the parental isolates of individual crosses are marked by yellow (CHN_52-27 x CHVD_042001) and dark red (USA_2 x CHE_94202) arrowheads. D Gene models of the neighboring effector paralogs BgtE-20069a and BgtE-20069b in the Pm3d-avirulent isolate USA_2 and virulent isolate CHE_94202. The non-synonymous mutation (leading to a R75K substitution in BgtE-20069a) is highlighted by a red vertical line, the deletion of BgtE-20069b in CHE_94202 is indicated by crossed black lines. E, F Agrobacterium-mediated co-expression of BgtE-20069a-mRFP (AvrPm3d_2) or BgtE-20069a_R75K-mRFP with Pm3d-HA or a GUS negative control in N. benthamiana. Leaves were imaged with a camera (E) or a Fusion FX imager (F). The experiment was performed three times with six leaves (total n = 18). G Representative phenotyping pictures of isolates that carry a BgtE-20069b deletion on the Pm3#d1 transgenic line and the corresponding sister line Sd#1. For each isolate, a schematic representation of the two genes is depicted. A black cross indicates BgtE-20069b deletion.
Fig. 5 Avirulence on Pm3d is controlled by two neighboring paralogous AVR genes encoding highly similar RALPH effector proteins. A The UV mutant Bgt_FAB exhibits an avirulent phenotype on the Pm3d#1 wheat line, despite carrying a deletion of the BgtE-20069b (AvrPm3d_1/AvrPm3e_2) effector gene. The phenotype of wild type Bgt isolate CHE_96224, used for UV mutagenesis, is shown as comparison. B Avirulence depletion mapping on Pm3d in two Bgt crosses. Virulence phenotypes of the parental isolates on the Pm3d#1 line are shown. Statistical analysis of sequenced F1 bulks selected on ‘Kanzler’ (non-selected control) or the Pm3d#1 line (Pm3d-selected) are shown on the right. ‘Kanzler’ bulks are drawn with gray lines to represent that these panels were reprinted from Fig. 2. Datapoints represent individual SNP markers along the 11 chromosomes of Bgt isolate CHE_96224 (x-axis) with their -log10 transformed p-values (y-axis) when testing for deviation from expected 1:1 segregation (G-test). Pm3d-specific depletion signal is indicated by a red arrowhead. C The AvrPm3d candidate locus, defined by the overlap between both crosses, in the reference genome CHE_96224. Effector genes (red) and non-effector genes (gray) are represented by arrows. Gene models are not drawn to scale. Effectors exhibiting non-synonymous polymorphisms in the parental isolates of individual crosses are marked by yellow (CHN_52-27 x CHVD_042001) and dark red (USA_2 x CHE_94202) arrowheads. D Gene models of the neighboring effector paralogs BgtE-20069a and BgtE-20069b in the Pm3d-avirulent isolate USA_2 and virulent isolate CHE_94202. The non-synonymous mutation (leading to a R75K substitution in BgtE-20069a) is highlighted by a red vertical line, the deletion of BgtE-20069b in CHE_94202 is indicated by crossed black lines. E, F Agrobacterium-mediated co-expression of BgtE-20069a-mRFP (AvrPm3d_2) or BgtE-20069a_R75K-mRFP with Pm3d-HA or a GUS negative control in N. benthamiana. Leaves were imaged with a camera (E) or a Fusion FX imager (F). The experiment was performed three times with six leaves (total n = 18). G Representative phenotyping pictures of isolates that carry a BgtE-20069b deletion on the Pm3#d1 transgenic line and the corresponding sister line Sd#1. For each isolate, a schematic representation of the two genes is depicted. A black cross indicates BgtE-20069b deletion.CC BY · PubMed Central
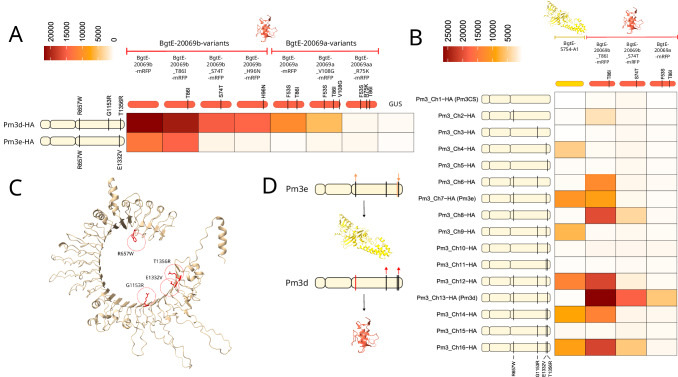
Fig. 6 Single amino acid polymorphisms in the LRR domain of Pm3d and Pm3e determine recognition specificities toward their AVR effectors. A Recognition strength of Pm3d-HA and Pm3e-HA towards variants of BgtE-20069b-mRFP (AvrPm3d_1/AvrPm3e_2) and BgtE-20069a-mRFP (AvrPm3d_2) in N. benthamiana, shown as a heat map. Schematic representations of amino acid polymorphisms defining Pm3d and Pm3e are shown on the left. Schematic representations of BgtE-20069b/BgtE-20069a variants with defining amino acid polymorphisms relative to the BgtE-20069b variant in reference isolate CHE_96224 (left) are shown above the heat map. The heatmap shows the mean HR strength from n = 18 individual replicates across three independent experiments (full dataset is shown in Supplementary Fig. 11). B Heatmap depicting recognition strength of 16 C-terminally HA-tagged Pm3CS/Pm3d/Pm3e NLR chimeras towards BgtE-5754-A1 (AvrPm3e_1) and selected C-terminally mRFP-tagged BgtE-20069b/BgtE-20069a variants. Schematic representations of amino acid polymorphisms defining the individual chimeras are shown on the right. Amino acid polymorphism combinations are illustrated in the drawing relative to the Pm3CS reference. The heatmap shows the mean HR strength from n = 18 individual replicates across three independent experiments (full dataset is shown in Supplementary Fig. 14). C AlphaFold3 structural prediction of the LRR domain of the Pm3_Ch16 construct combining all Pm3d-/Pm3e-specific polymorphisms (highlighted in orange). D Schematic summary of datasets depicted in (B) and Supplementary Fig. 14, highlighting Pm3d/Pm3e-specific polymorphisms that positively or negatively influence recognition of BgtE-5754 (top) or BgtE-20069b/BgtE-20069a (bottom). Polymorphisms highlighted by a yellow or red line are required for recognition of BgtE-5754 and BgtE-20069b/BgtE-20069a, respectively. Polymorphisms that quantitatively influence recognition strength are indicated by arrows (upward arrow = increase HR; downward arrow = decrease HR).
Fig. 6 Single amino acid polymorphisms in the LRR domain of Pm3d and Pm3e determine recognition specificities toward their AVR effectors. A Recognition strength of Pm3d-HA and Pm3e-HA towards variants of BgtE-20069b-mRFP (AvrPm3d_1/AvrPm3e_2) and BgtE-20069a-mRFP (AvrPm3d_2) in N. benthamiana, shown as a heat map. Schematic representations of amino acid polymorphisms defining Pm3d and Pm3e are shown on the left. Schematic representations of BgtE-20069b/BgtE-20069a variants with defining amino acid polymorphisms relative to the BgtE-20069b variant in reference isolate CHE_96224 (left) are shown above the heat map. The heatmap shows the mean HR strength from n = 18 individual replicates across three independent experiments (full dataset is shown in Supplementary Fig. 11). B Heatmap depicting recognition strength of 16 C-terminally HA-tagged Pm3CS/Pm3d/Pm3e NLR chimeras towards BgtE-5754-A1 (AvrPm3e_1) and selected C-terminally mRFP-tagged BgtE-20069b/BgtE-20069a variants. Schematic representations of amino acid polymorphisms defining the individual chimeras are shown on the right. Amino acid polymorphism combinations are illustrated in the drawing relative to the Pm3CS reference. The heatmap shows the mean HR strength from n = 18 individual replicates across three independent experiments (full dataset is shown in Supplementary Fig. 14). C AlphaFold3 structural prediction of the LRR domain of the Pm3_Ch16 construct combining all Pm3d-/Pm3e-specific polymorphisms (highlighted in orange). D Schematic summary of datasets depicted in (B) and Supplementary Fig. 14, highlighting Pm3d/Pm3e-specific polymorphisms that positively or negatively influence recognition of BgtE-5754 (top) or BgtE-20069b/BgtE-20069a (bottom). Polymorphisms highlighted by a yellow or red line are required for recognition of BgtE-5754 and BgtE-20069b/BgtE-20069a, respectively. Polymorphisms that quantitatively influence recognition strength are indicated by arrows (upward arrow = increase HR; downward arrow = decrease HR).CC BY · PubMed Central
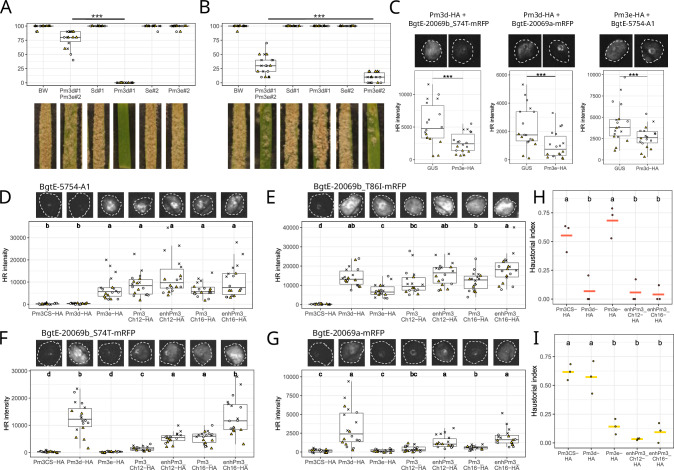
Fig. 7 Pm3d and Pm3e recognition specificity can be combined in chimeric Pm3 NLRs. A,B Virulence phenotypes of isolates CHN_17_40 (A) and CHE_94202 (B) on various wheat lines. “BW” refers to the cultivar ‘Bobwhite’, the background for the Pm3d#1 and Pm3e#2 transgenic lines. “Pm3d#1 / Pm3e#2” denotes F1 plants from a Pm3d#1 × Pm3e#2 cross. Sd#1 and Se#2 refer to transgene-free sister lines of Pm3d#1 and Pm3e#2. Boxplots display infection scores (10-step scale, 0% to 100% leaf coverage) at 11dpi. Eighteen leaf segments across three independent plates were scored (symbols indicate plates). Statistical significance between the Pm3d#1 x Pm3e#2 F1 individuals and the respective parental lines was assessed using the Wilcoxon rank-sum test; *** indicates p < 0.001. C Results of allelic suppression testing in N. benthamiana using the effector variants BgtE-20069b_S74T-mRFP, BgtE-20069a-mRFP (both exclusively recognized by Pm3d-HA) and BgtE-5754-A1 (exclusively recognized by Pm3e-HA). Boxplots show quantified HR intensities from 18 infiltration spots per combination, obtained from three independent experiments (denoted by distinct symbols). Statistical significance was assessed using a paired Wilcoxon signed-rank test; *** indicates p < 0.001. D–F Agrobacterium-mediated co-expression of D BgtE-5754-A1, E BgtE-20069b_T86I-mRFP, F BgtE-20069b_S74T-mRFP, and G BgtE-20069a-mRFP with various Pm3-HA variants. Boxplots show HR intensities from 18 infiltration spots across three experiments (symbols denote experiments). Letters above boxplots denote statistically significant differences at p < 0.05 based on Dunn’s test. Representative HR images are shown above the boxplots. H, I Haustorial index in epidermal cells of wheat cultivar ‘Bobwhite’ transformed via particle bombardment with the reporter pUbi:GUS and the indicated Pm3 constructs. Haustorial index represents the percentage of spores forming haustoria in GUS-positive cells, assessed at 44hpi for H Pm3d-avirulent, Pm3e-virulent isolate CHN_17_40 and for I Pm3e-avirulent, Pm3d-virulent isolate CHE_94202. Black dots represent individual experiments; colored lines indicate the mean across three experiments. Different letters indicate statistically significant differences according to ANOVA followed by Tukey HSD test (p < 0.05). A–G Boxes represent the interquartile range (IQR; 25–75%) with the thick horizontal line indicating the median, and whiskers extending to the most extreme values within 1.5×IQR. Details and exact p-values for all statistical tests shown in A-I) are reported in Supplementary Dataset 4.
Fig. 7 Pm3d and Pm3e recognition specificity can be combined in chimeric Pm3 NLRs. A,B Virulence phenotypes of isolates CHN_17_40 (A) and CHE_94202 (B) on various wheat lines. “BW” refers to the cultivar ‘Bobwhite’, the background for the Pm3d#1 and Pm3e#2 transgenic lines. “Pm3d#1 / Pm3e#2” denotes F1 plants from a Pm3d#1 × Pm3e#2 cross. Sd#1 and Se#2 refer to transgene-free sister lines of Pm3d#1 and Pm3e#2. Boxplots display infection scores (10-step scale, 0% to 100% leaf coverage) at 11dpi. Eighteen leaf segments across three independent plates were scored (symbols indicate plates). Statistical significance between the Pm3d#1 x Pm3e#2 F1 individuals and the respective parental lines was assessed using the Wilcoxon rank-sum test; *** indicates p < 0.001. C Results of allelic suppression testing in N. benthamiana using the effector variants BgtE-20069b_S74T-mRFP, BgtE-20069a-mRFP (both exclusively recognized by Pm3d-HA) and BgtE-5754-A1 (exclusively recognized by Pm3e-HA). Boxplots show quantified HR intensities from 18 infiltration spots per combination, obtained from three independent experiments (denoted by distinct symbols). Statistical significance was assessed using a paired Wilcoxon signed-rank test; *** indicates p < 0.001. D–F Agrobacterium-mediated co-expression of D BgtE-5754-A1, E BgtE-20069b_T86I-mRFP, F BgtE-20069b_S74T-mRFP, and G BgtE-20069a-mRFP with various Pm3-HA variants. Boxplots show HR intensities from 18 infiltration spots across three experiments (symbols denote experiments). Letters above boxplots denote statistically significant differences at p < 0.05 based on Dunn’s test. Representative HR images are shown above the boxplots. H, I Haustorial index in epidermal cells of wheat cultivar ‘Bobwhite’ transformed via particle bombardment with the reporter pUbi:GUS and the indicated Pm3 constructs. Haustorial index represents the percentage of spores forming haustoria in GUS-positive cells, assessed at 44hpi for H Pm3d-avirulent, Pm3e-virulent isolate CHN_17_40 and for I Pm3e-avirulent, Pm3d-virulent isolate CHE_94202. Black dots represent individual experiments; colored lines indicate the mean across three experiments. Different letters indicate statistically significant differences according to ANOVA followed by Tukey HSD test (p < 0.05). A–G Boxes represent the interquartile range (IQR; 25–75%) with the thick horizontal line indicating the median, and whiskers extending to the most extreme values within 1.5×IQR. Details and exact p-values for all statistical tests shown in A-I) are reported in Supplementary Dataset 4.CC BY · PubMed Central

Verification

Claims the paper makes

The claims and statistics of this paper haven’t been checked yet.

Run the check — free, no account needed. It reads the open-access text and checks the sources it cites.

A few free checks a day · papers already verified open instantly · results are public

Self-check

Percentages, sums and reported differences re-computed from the paper’s own numbers.

The self-check needs the paper’s full text.

Citations

Cites

Research works printed but not linked: 79

  1. Poland, J. & Rutkoski, J. Advances and challenges in genomic selection for disease resistance. Annu. Rev. Phytopathol. 54, 79–98 (2016). · DOI
  2. Barragan, A. C. & Weigel, D. Plant NLR diversity: the known unknowns of pan-NLRomes. Plant Cell 33, 814–831 (2021). · DOI
  3. Dodds, P. N. & Rathjen, J. P. Plant immunity: towards an integrated view of plant–pathogen interactions. Nat. Rev. Genet. 11, 539–548 (2010). · DOI
  4. Ngou, B. P. M., Ding, P. & Jones, J. D. G. Thirty years of resistance: zig-zag through the plant immune system. Plant Cell 34, 1447–1478 (2022). · DOI
  5. Dean, R. et al. The Top 10 fungal pathogens in molecular plant pathology. Mol. Plant Pathol. 13, 414–430 (2012). · DOI
  6. Hafeez, A. N. et al. Creation and judicious application of a wheat resistance gene atlas. Mol. Plant 14, 1053–1070 (2021). · DOI
  7. Ayala, F. M., Hernández-Sánchez, I. E., Chodasiewicz, M., Wulff, B. B. H. & Svačina, R. Engineering a One Health Super Wheat. Annu. Rev. Phytopathol. 62, 193–215 (2024). · DOI
  8. Bourras, S. et al. Multiple avirulence loci and allele-specific effector recognition control the Pm3 race-specific resistance of wheat to powdery mildew. Plant Cell 15, 00171 (2015).
  9. Praz, C. R. et al. AvrPm2 encodes an RN ase-like avirulence effector which is conserved in the two different specialized forms of wheat and rye powdery mildew fungus. N. Phytol. 213, 1301–1314 (2017). · DOI
  10. Bourras, S. et al. The AvrPm3-Pm3 effector-NLR interactions control both race-specific resistance and host-specificity of cereal mildews on wheat. Nat. Commun. 10, 2292 (2019). · DOI
  11. Müller, M. C. et al. Ancient variation of the AvrPm17 gene in powdery mildew limits the effectiveness of the introgressed rye Pm17 resistance gene in wheat. Proc. Natl. Acad. Sci. USA 119, e2108808119–e2108808119 (2022). · DOI
  12. Hewitt, T. et al. A highly differentiated region of wheat chromosome 7AL encodes a Pm1a immune receptor that recognizes its corresponding AvrPm1a effector from Blumeria graminis. N. Phytol. 229, 2812–2826 (2021). · DOI
  13. Kloppe, T. et al. Two pathogen loci determine Blumeria graminis f. sp. tritici virulence to wheat resistance gene Pm1a. N. Phytol. 238, 1546–1561 (2023). · DOI
  14. Kunz, L. et al. The broad use of the Pm8 resistance gene in wheat resulted in hypermutation of the AvrPm8 gene in the powdery mildew pathogen. BMC Biol. 21, 29 (2023). · DOI
  15. Kunz, L. et al. Avirulence depletion assay: Combining R gene-mediated selection with bulk sequencing for rapid avirulence gene identification in wheat powdery mildew. PLoS Pathog. 21, e1012799 (2025). · DOI
  16. Cao, Y. et al. Structural polymorphisms within a common powdery mildew effector scaffold as a driver of coevolution with cereal immune receptors. Proc. Natl. Acad. Sci. USA 120, 1–11 (2023). · DOI
  17. Bilstein-Schloemer, M., Müller, M. C., Saur, I. M. L., Muller, M. C. & Saur, I. M. L. Technical advances drive the molecular understanding of effectors from wheat and barley powdery mildew fungi. Mol. Plant-Microbe Interact.® 38, 213–225 (2025). · DOI
  18. Brown, J. K. M. Durable resistance of crops to disease: a Darwinian perspective. Annu. Rev. Phytopathol. 53, 513–539 (2015). · DOI
  19. Zdrzałek, R. et al. Bioengineering a plant NLR immune receptor with a robust binding interface toward a conserved fungal pathogen effector. Proc. Natl. Acad. Sci. USA 121, e2402872121 (2024). · DOI
  20. Wang, J. et al. Remodelling autoactive NLRs for broad-spectrum immunity in plants. Nature 645, 737–745 (2025). · DOI
  21. Yahiaoui, N., Srichumpa, P., Dudler, R. & Keller, B. Genome analysis at different ploidy levels allows cloning of the powdery mildew resistance gene Pm3b from hexaploid wheat. Plant J. 37, 528–538 (2004). · DOI
  22. Bhullar, N. K., Mackay, M. & Keller, B. Genetic Diversity of the Pm3 Powdery Mildew Resistance Alleles in Wheat Gene Bank Accessions as Assessed by Molecular. Markers Diversity 2, 768–786 (2010). · DOI
  23. Brunner, S. et al. Intragenic allele pyramiding combines different specificities of wheat Pm3 resistance alleles. Plant J. 64, 433–445 (2010). · DOI
  24. Yahiaoui, N., Brunner, S. & Keller, B. Rapid generation of new powdery mildew resistance genes after wheat domestication. Plant J. 47, 85–98 (2006). · DOI
  25. Bhullar, N. K., Street, K., Mackay, M., Yahiaoui, N. & Keller, B. Unlocking wheat genetic resources for the molecular identification of previously undescribed functional alleles at the Pm3 resistance locus. Proc. Natl. Acad. Sci. USA 106, 9519–9524 (2009). · DOI
  26. Sotiropoulos, A. G. et al. Global genomic analyses of wheat powdery mildew reveal association of pathogen spread with historical human migration and trade. Nat. Commun. 13, 4315 (2022). · DOI
  27. Brunner, S. et al. Transgenic Pm3b wheat lines show resistance to powdery mildew in the field. Plant Biotechnol. J. 9, 897–910 (2011). · DOI
  28. Brunner, S. et al. Transgenic Pm3 multilines of wheat show increased powdery mildew resistance in the field. Plant Biotechnol. J. 10, 398–409 (2012). · DOI
  29. Koller, T. et al. Field grown transgenic Pm3e wheat lines show powdery mildew resistance and no fitness costs associated with high transgene expression. Transgenic Res. 28, 9–20 (2019). · DOI
  30. Koller, T. et al. Pyramiding of transgenic immune receptors from primary and tertiary wheat gene pools improves powdery mildew resistance in the field. J. Exp. Bot. 75, 1872–1886 (2024). · DOI
  31. Jigisha, J. et al. Population genomics and molecular epidemiology of wheat powdery mildew in Europe. PLoS Biol. 23, e3003097 (2025). · DOI
  32. Müller, M. C. et al. A chromosome-scale genome assembly reveals a highly dynamic effector repertoire of wheat powdery mildew. N. Phytol. 221, 2176–2189 (2019). · DOI
  33. Seong, K. & Krasileva, K. V. Prediction of effector protein structures from fungal phytopathogens enables evolutionary analyses. Nat. Microbiol. 8, 174–187 (2023). · DOI
  34. Bernasconi, Z. et al. Mutagenesis of wheat powdery mildew reveals a single gene controlling both NLR and tandem kinase-mediated immunity. Mol. Plant-Microbe Interact.® 37, 264–276 (2024). · DOI
  35. Koller, T., Brunner, S., Herren, G., Hurni, S. & Keller, B. Pyramiding of transgenic Pm3 alleles in wheat results in improved powdery mildew resistance in the field. Theor. Appl. Genet. 131, 861–871 (2018). · DOI
  36. Stirnweis, D. et al. Suppression among alleles encoding nucleotide-binding–leucine-rich repeat resistance proteins interferes with resistance in F 1 hybrid and allele-pyramided wheat plants. Plant J. 79, 893–903 (2014). · DOI
  37. Stirnweis, D., Milani, S. D., Jordan, T., Keller, B. & Brunner, S. Substitutions of two amino acids in the nucleotide-binding site domain of a resistance protein enhance the hypersensitive response and enlarge the PM3F resistance spectrum in wheat. Mol. Plant-Microbe Interact.® 27, 265–276 (2014). · DOI
  38. Kourelis, J. & Adachi, H. Activation and regulation of NLR immune receptor networks. Plant Cell Physiol. 63, 1366–1377 (2022). · DOI
  39. Bernasconi, Z. et al. Virulence on Pm4 kinase-based resistance is determined by two divergent wheat powdery mildew effectors. Nat. Plants 12, 164–178 (2026). · DOI
  40. Xie, J. et al. A biGWAS strategy reveals the genetic architecture of the interaction between wheat and Blumeria graminis f. sp. tritici. bioRxiv https://doi.org/10.1101/2025.04.09.647224 (2025). · DOI
  41. Cesari, S. et al. The rice resistance protein pair RGA4/RGA5 recognizes the Magnaporthe oryzae effectors AVR-Pia and AVR1-CO39 by direct binding. Plant Cell 25, 1463–1481 (2013). · DOI
  42. Guo, L. et al. Specific recognition of two MAX effectors by integrated HMA domains in plant immune receptors involves distinct binding surfaces. Proc. Natl. Acad. Sci. USA 115, 11637–11642 (2018). · DOI
  43. Brabham, H. J. et al. Barley MLA3 recognizes the host-specificity effector Pwl2 from Magnaporthe oryzae. Plant Cell 36, 447–470 (2024). · DOI
  44. Bettgenhaeuser, J. et al. The barley immune receptor Mla recognizes multiple pathogens and contributes to host range dynamics. Nat. Commun. 12, 6915 (2021). · DOI
  45. Pedersen, C. et al. Structure and evolution of barley powdery mildew effector candidates. BMC Genomics 13, 694 (2012). · DOI
  46. Weiß, L. S. et al. Barley resistance and susceptibility to fungal cell entry involve the interplay of ROP signaling with phosphatidylinositol-monophosphates. Plant J. 123, e70356 (2025). · DOI
  47. Isaksson, J., Kunz, L., Flückiger, S., Widrig, V. & Keller, B. The Wheat NLR Protein PM3b localises to endoplasmic reticulum–plasma membrane contact sites and interacts with AVRPM3 b2/c2 through Its LRR domain. Mol Plant Pathol 26, e70054 (2025). · DOI
  48. Dali, S. et al. Specific phosphoinositide interaction of Jps1 is a key feature during unconventional secretion in Ustilago maydis. J. Biol. Chem. 301, 110215 (2025). · DOI
  49. Dulal, N. & Wilson, R. A. Paths Least Resistance: Unconv. Effector Secret. Fungal Oomycete Plant Pathog. Mol. Plant-Microbe Interact.® 37, 653–661 (2024).
  50. Seong, K. et al. Resurrection of the plant immune receptor Sr50 to overcome pathogen immune evasion. bioRxiv 2024.08.07.607039 (2025) https://doi.org/10.1101/2024.08.07.607039. · DOI
  51. Bentham, A. R. et al. Allelic compatibility in plant immune receptors facilitates engineering of new effector recognition specificities. Plant Cell 35, 3809–3827 (2023). · DOI · Paper page
  52. Bhullar, N. K., Zhang, Z., Wicker, T. & Keller, B. Wheat gene bank accessions as a source of new alleles of the powdery mildew resistance gene Pm3: a large scale allele mining project. BMC Plant Biol. 10, 88 (2010). · DOI
  53. Lindner, S. et al. Single residues in the LRR domain of the wheat PM3A immune receptor can control the strength and the spectrum of the immune response. Plant J. 104, 200–214 (2020). · DOI
  54. Cesari, S. et al. New recognition specificity in a plant immune receptor by molecular engineering of its integrated domain. Nat. Commun. 13, 1524 (2022). · DOI
  55. Parlange, F. et al. A major invasion of transposable elements accounts for the large size of the Blumeria graminis f.sp. Tritici genome. Funct. Integr. Genomics 11, 671–677 (2011). · DOI
  56. Parlange, F. et al. Genetic and molecular characterization of a locus involved in avirulence of Blumeria graminis f. sp. tritici on wheat Pm3 resistance alleles. Fungal Genet. Biol. 82, 181–192 (2015). · DOI
  57. Sotiropoulos, A. G. et al. Combining pangenomics and population genetics finds chromosomal re-arrangements, accessory-like chromosome segments, copy number variations and transposon polymorphisms in wheat and rye powdery mildew. bioRxiv 2025.05.08.652814 (2025) https://doi.org/10.1101/2025.05.08.652814. · DOI
  58. Camacho, C. et al. BLAST+: architecture and applications. BMC Bioinforma. 10, 421 (2009). · DOI · Paper page
  59. Robinson, J. T. et al. Integrative genomics viewer. Nat. Biotechnol. 29, 24–26 (2011). · DOI · Paper page
  60. Petersen, T. N., Brunak, S., von Heijne, G. & Nielsen, H. SignalP 4.0: discriminating signal peptides from transmembrane regions. Nat. Methods 8, 785–786 (2011). · DOI · Paper page
  61. Himmelbach, A. et al. A set of modular binary vectors for transformation of cereals. Plant Physiol. 145, 1192–1200 (2007). · DOI
  62. Weigel, D. & Glazebrook, J. Transformation of agrobacterium using the freeze-thaw method. Cold Spring Harb Protoc 2006, pdb.prot4666 (2006). · DOI
  63. Engelhardt, S. et al. Barley RIC157, a potential RACB scaffold protein, is involved in susceptibility to powdery mildew. Plant Mol. Biol. 111, 329–344 (2023). · DOI
  64. Jay, F., Brioudes, F. & Voinnet, O. A contemporary reassessment of the enhanced transient expression system based on the tombusviral silencing suppressor protein P19. Plant J. 113, 186–P204 (2023). · DOI
  65. Schindelin, J. et al. Fiji: an open-source platform for biological-image analysis. Nat. Methods 9, 676–682 (2012). · DOI · Paper page
  66. Blum, M. et al. InterPro: the protein sequence classification resource in 2025. Nucleic Acids Res. 53, D444–D456 (2025). · DOI
  67. Almagro Armenteros, J. J. et al. SignalP 5.0 improves signal peptide predictions using deep neural networks. Nat. Biotechnol. 37, 420–423 (2019). · DOI
  68. Teufel, F. et al. SignalP 6.0 predicts all five types of signal peptides using protein language models. Nat. Biotechnol. 40, 1023–1025 (2022). · DOI
  69. Hallgren, J. et al. DeepTMHMM predicts alpha and beta transmembrane proteins using deep neural networks. bioRxiv 2022.04.08.487609 (2022) https://doi.org/10.1101/2022.04.08.487609. · DOI
  70. Zhang, Y. & Skolnick, J. TM-align: a protein structure alignment algorithm based on the TM-score. Nucleic Acids Res 33, 2302–2309 (2005). · DOI · Paper page
  71. van Kempen, M. et al. Fast and accurate protein structure search with Foldseek. Nat Biotechnol 42, 243–246 (2024). · DOI · Paper page
  72. Müller, M. C., Graf, J. & Keller, B. Genome and annotation files (v4_23) for Blumeria graminis f. sp. tritici isolate CHE_96224 (genome assembly: Bgt_genome_v3_16). Preprint at https://doi.org/10.5281/zenodo.7018501 (2022). · DOI
  73. Patro, R., Duggal, G., Love, M. I., Irizarry, R. A. & Kingsford, C. Salmon provides fast and bias-aware quantification of transcript expression. Nat. Methods 14, 417–419 (2017). · DOI · Paper page
  74. Robinson, M. D., McCarthy, D. J. & Smyth, G. K. edgeR: a Bioconductor package for differential expression analysis of digital gene expression data. Bioinformatics 26, 139–140 (2010). · DOI · Paper page
  75. Abramson, J. et al. Accurate structure prediction of biomolecular interactions with AlphaFold 3. Nature 630, 493–500 (2024). · DOI · Paper page
  76. Mirdita, M. et al. ColabFold: making protein folding accessible to all. Nat. Methods 19, 679–682 (2022). · DOI · Paper page
  77. Biegert, A., Mayer, C., Remmert, M., Söding, J. & Lupas, A. N. The MPI bioinformatics toolkit for protein sequence analysis. Nucleic Acids Res. 34, W335–W339 (2006). · DOI
  78. Zimmermann, L. et al. A completely reimplemented MPI bioinformatics toolkit with a new HHpred server at its core. J. Mol. Biol. 430, 2237–2243 (2018). · DOI · Paper page
  79. Pettersen, E. F. et al. UCSF ChimeraX: structure visualization for researchers, educators, and developers. Protein Sci. 30, 70–82 (2021). · DOI

Metadata

Authors
Kunz, L., Bernasconi, Z., Heuberger, M., Isaksson, J., Sotiropoulos, A. G., Stirnemann, U., Jigisha, J., Menardo, F., Wicker, T., Müller, M. C., & Keller, B.
Affiliations
  • University of Zurich (CH)
  • University of Southern Queensland (AU)
Corresponding author
  • Kunz, Lukas
  • Müller, Marion C.
  • Keller, Beat
Venue
Nature Communications
Published
2026-05-02
Volume
17
Issue
1
ISSN
2041-1723 (ISSN-L)
OpenAlex
W4415560080
Cited by
1
References
2
Citations by year
2026: 1
FWCI
3.70
Type
journal article
Language
en
Open access
Locations
  • Nature Communications (publishedVersion, cc-by)
  • bioRxiv (Cold Spring Harbor Laboratory) (acceptedVersion, cc-by-nc)
  • PubMed (publishedVersion)
  • PubMed Central (publishedVersion, cc-by)
  • ENLIGHTEN (Jurnal Bimbingan dan Konseling Islam) (acceptedVersion, cc-by-sa)
  • DOAJ (DOAJ: Directory of Open Access Journals) (submittedVersion)
  • Zurich Open Repository and Archive (University of Zurich) (submittedVersion, cc-by)
  • Zurich Open Repository and Archive (University of Zurich)
Funders
  • Deutsche Forschungsgemeinschaft (543878450)
  • Schweizerischer Nationalfonds zur Förderung der Wissenschaftlichen Forschung (PZ00P3_193473, 310030B_182833, 310030_204165)
  • University of Zurich core funding and by the Research Priority Program “Evolution in Action” of the University of Zurich
Topics
  • Life Sciences › Agricultural and Biological Sciences › Plant Science › Powdery Mildew Fungal Diseases
  • Life Sciences › Agricultural and Biological Sciences › Plant Science › Wheat and Barley Genetics and Pathology
  • Life Sciences › Agricultural and Biological Sciences › Plant Science › Plant-Microbe Interactions and Immunity
Keywords
wheat powdery mildew, avirulence effectors, NLR immune receptors, broad-spectrum disease resistance, gene paralogs, resistance breakdown, wheat disease resistance
MeSH terms
NLR Proteins, Alleles, Ascomycota, Plant Diseases, Plant Proteins, Triticum, Disease Resistance

About these checks

Registry, retraction, Cites and statistics results are computed, not judged, with one exception: a printed reference that no index lists is read once by a model before it counts as a citation error. Claims are extracted by a model and kept only when their quote appears verbatim in the text; each cited source is then checked, with a model’s help, for whether it says what the claim relies on. Those verdicts can be wrong — read the claim’s quote and the cited source before relying on one.

Statistics and arithmetic are recomputed, not judged.

Confidence bands are shown only for fields calibrated on our annotated test set. None is calibrated yet, so no band is shown.

What counts as a claim ›How we measure confidence ›How we check this ›

Are you an author, or do you see a problem with this page? Request a review