

The DOI matches its Crossref record; 48 of the 48 references it cites were found in a registry or an index.
NAD+ augmentation with nicotinamide riboside improves lymphoid potential of Atm−/− and old mice HSCs
Open accessAbstract
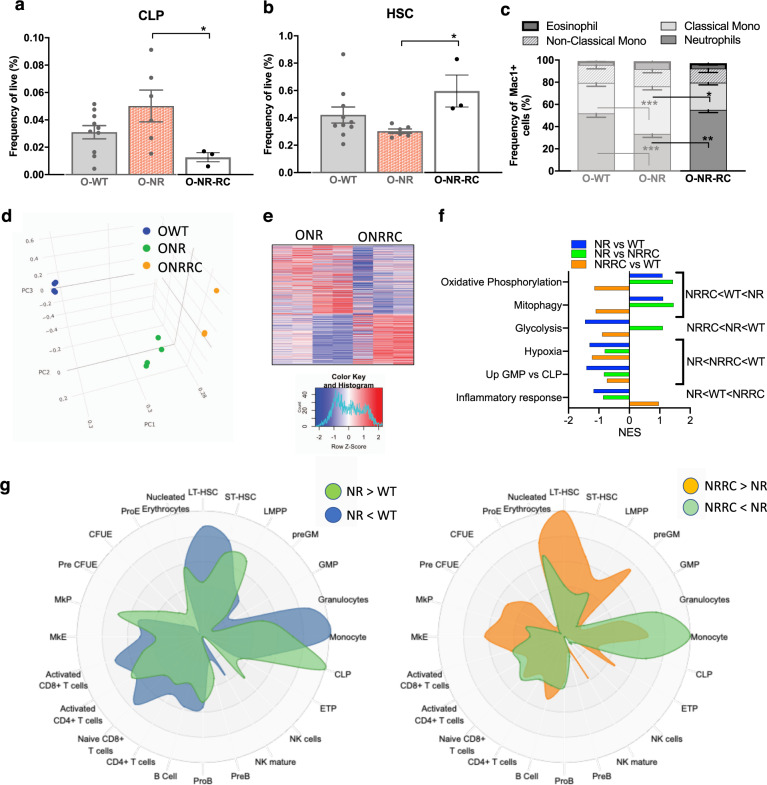
NAD + supplementation has significant benefits in compromised settings, acting largely through improved mitochondrial function and DNA repair. Elevating NAD + to physiological levels has been shown to improve the function of some adult stem cells, with implications that these changes will lead to sustained improvement of the tissue or system. Here, we examined the effect of elevating NAD + levels in models with reduced hematopoietic stem cell (HSC) potential, ATM-deficient and aged WT mice, and showed that supplementation of nicotinamide riboside (NR), a NAD + precursor, improved lymphoid lineage potential during supplementation. In aged mice, this improved lymphoid potential was maintained in competitive transplants and was associated with transcriptional repression of myeloid gene signatures in stem and lineage-committed progenitor cells after NR treatment. However, the altered transcriptional priming of the stem cells toward lymphoid lineages was not sustained in the aged mice after NR removal. These data characterize significant alterations to the lineage potential of functionally compromised HSCs after short-term exposure to NR treatment.
Overview
The claims and statistics of this paper haven’t been checked yet.
Run the check — free, no account needed. It reads the open-access text and checks the sources it cites.
Integrity signals
Registry
Cites
Statistics
Figures
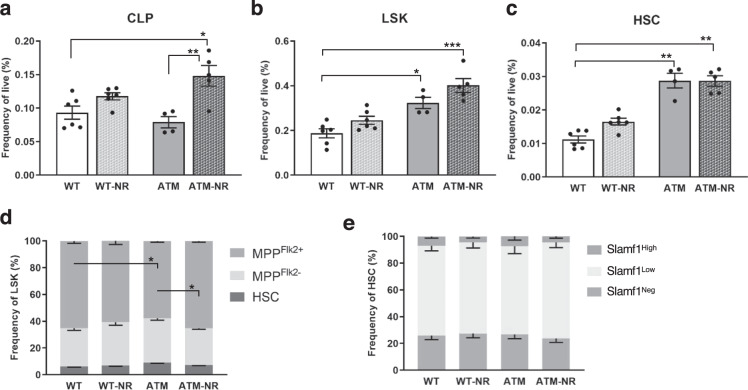
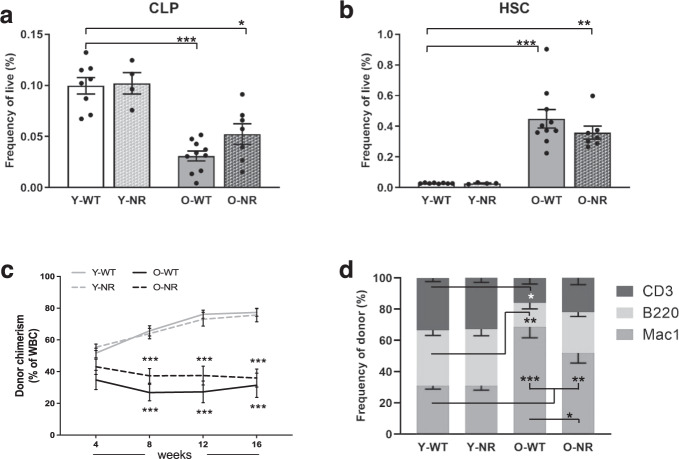
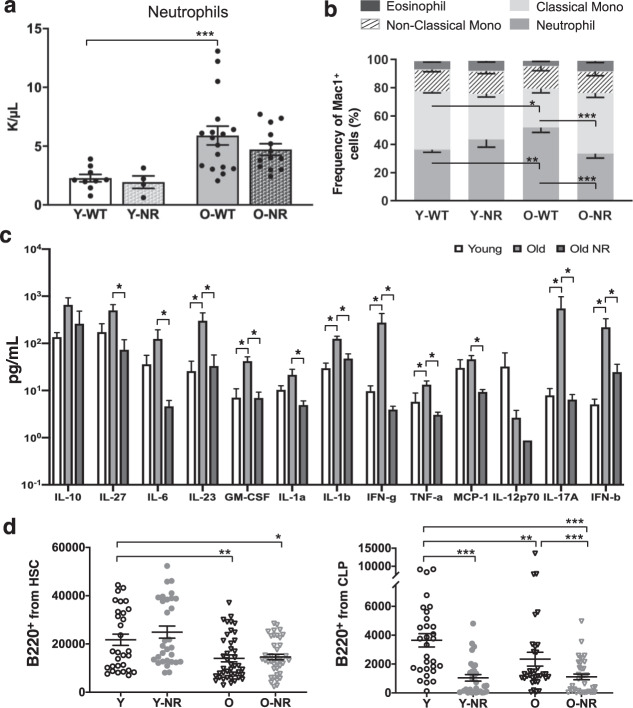
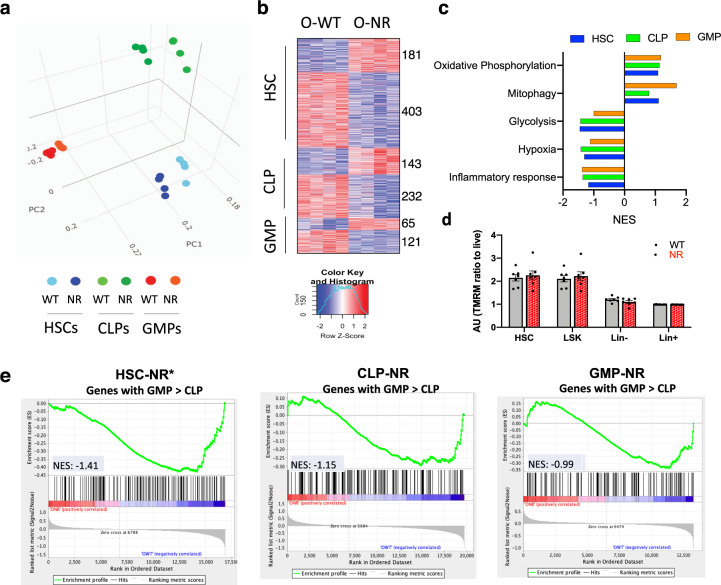
Verification
Claims the paper makes
The claims and statistics of this paper haven’t been checked yet.
Run the check — free, no account needed. It reads the open-access text and checks the sources it cites.
Claims other papers make about this one
Each is checked against this paper’s own text: does it say what the citing paper says it does?
In the citing paper
“Likewise, nicotinamide riboside improves HSC function in young mice221 and ameliorates the lymphoid potential of HSCs in old mice222.”
From Ageing and rejuvenation of tissue stem cells and their niches (2023) · cites this paper as [222]
Self-check
Percentages, sums and reported differences re-computed from the paper’s own numbers.
The self-check needs the paper’s full text.
Citations
Cites
Subramanian, A., Tamayo, P., Mootha, V. K., Mukherjee, S., Ebert, B. L., Gillette, M. A., Paulovich, A., Pomeroy, S. L., Golub, T. R., Lander, E. S., et al. (2005) · Proceedings of the National Academy of Sciences · doi:10.1073/pnas.0506580102 · Cited by 53,625
STAR: ultrafast universal RNA-seq aligner
Dobin, A., Davis, C. A., Schlesinger, F., Drenkow, J., Zaleski, C., Jha, S., Batut, P., Chaisson, M., & Gingeras, T. R. (2013) · Bioinformatics · doi:10.1093/bioinformatics/bts635 · Cited by 51,709
Cutadapt removes adapter sequences from high-throughput sequencing reads
Martin, M. (2011) · EMBnet.journal · doi:10.14806/ej.17.1.200 · Cited by 33,889
featureCounts: an efficient general purpose program for assigning sequence reads to genomic features
Liao, Y., Smyth, G. K., & Shi, W. (2014) · Bioinformatics · doi:10.1093/bioinformatics/btt656 · Cited by 27,219
A Single Ataxia Telangiectasia Gene with a Product Similar to PI-3 Kinase
Savitsky, K., Bar-Shira, A., Gilad, S., Rotman, G., Ziv, Y., Vanagaite, L., Tagle, D. A., Smith, S., Uziel, T., Sfez, S., et al. (1995) · Science · doi:10.1126/science.7792600 · Cited by 2,785
Normalization of RNA-seq data using factor analysis of control genes or samples
Risso, D., Ngai, J., Speed, T. P., & Dudoit, S. (2014) · Nature Biotechnology · doi:10.1038/nbt.2931 · Cited by 2,052
Wilson, A., Laurenti, E., Oser, G., van der Wath, R. C., Blanco-Bose, W., Jaworski, M., Offner, S., Dunant, C. F., Eshkind, L., Bockamp, E., et al. (2008) · Cell · doi:10.1016/j.cell.2008.10.048 · Cited by 1,908
NAD+ and sirtuins in aging and disease
Imai, S.-I., & Guarente, L. (2014) · Trends in Cell Biology · doi:10.1016/j.tcb.2014.04.002 · Cited by 1,481
Atm-Deficient Mice: A Paradigm of Ataxia Telangiectasia
Barlow, C., Hirotsune, S., Paylor, R. E., Liyanage, M., Eckhaus, M., Collins, F. S., Shiloh, Y., Crawley, J. N., Ried, T., Tagle, D. A., et al. (1996) · Cell · doi:10.1016/s0092-8674(00)80086-0 · Cited by 1,465
Identification of Flt3+ Lympho-Myeloid Stem Cells Lacking Erythro-Megakaryocytic Potential
Adolfsson, J., Månsson, R., Buza-Vidas, N., Hultquist, A., Liuba, K., Jensen, C. T., Bryder, D., Yang, L., Borge, O. J., Thorén, L., et al. (2005) · Cell · doi:10.1016/j.cell.2005.02.013 · Cited by 1,323
Cited by
Sorted by citations
Ageing and rejuvenation of tissue stem cells and their niches
Brunet, A., Goodell, M. A., & Rando, T. A. (2023) · Nature Reviews Molecular Cell Biology · doi:10.1038/s41580-022-00510-w · Cited by 407
Neurogenesis in aging and age-related neurodegenerative diseases
Čulig, L., Chu, X., & Bohr, V. A. (2022) · Ageing Research Reviews · doi:10.1016/j.arr.2022.101636 · Cited by 235
Self-citationHematopoietic Stem Cells and the Immune System in Development and Aging
Shevyrev, D., Tereshchenko, V., Berezina, T. N., & Александрович, Р. С. (2023) · International Journal of Molecular Sciences · doi:10.3390/ijms24065862 · Cited by 58
Mitochondrial Contributions to Hematopoietic Stem Cell Aging
Morganti, C., & Ito, K. (2021) · International Journal of Molecular Sciences · doi:10.3390/ijms222011117 · Cited by 50
Biţă, A., Scorei, I. R., Ciocîlteu, M. V., Nicolaescu, O. E., Pîrvu, A. S., Bejenaru, L. E., Rău, G., Bejenaru, C., Radu, A., Neamţu, J., et al. (2023) · Molecules · doi:10.3390/molecules28166078 · Cited by 36
Metadata
- Authors
- Zong, L., Tanaka-Yano, M., Park, B., Yanai, H., Turhan, F. T., Croteau, D. L., Tian, J., Fang, E. F., Bohr, V. A., & Beerman, I.
- Affiliations
- National Institutes of Health (US)
- Corresponding author
- Beerman, Isabel
- ORCID
- Venue
- npj Aging and Mechanisms of Disease
- Published
- 2021-09-21
- Volume
- 7
- Issue
- 1
- Pages
- 25-25
- ISSN
- 2056-3973 (ISSN-L)
- PMC
- PMC8455618
- OpenAlex
- W3199551479
- Cited by
- 22
- References
- 48
- Citations by year
- 2026: 3 · 2025: 6 · 2024: 1 · 2023: 6 · 2022: 4 · 2021: 2
- FWCI
- 1.79
- Type
- journal article
- Language
- en
- Open access
- gold
- doi.org
- Locations
- npj Aging and Mechanisms of Disease (publishedVersion, cc-by)
- Europe PMC (PubMed Central) (publishedVersion, other-oa)
- PubMed Central (publishedVersion, cc-by)
- PubMed (publishedVersion)
- DOAJ (DOAJ: Directory of Open Access Journals) (submittedVersion, cc-by-sa)
- NORA - Norwegian Open Research Archives (submittedVersion, cc-by)
- Funders
- U.S. Department of Health and Human Services (AG000992)
- National Natural Science Foundation of China (#81971327)
- Norges Forskningsråd (#262175)
- National Institutes of Health
- Japan Society for the Promotion of Science
- National Institute on Aging (ZIAAG000992)
- Topics
- Health Sciences › Medicine › Geriatrics and Gerontology › Sirtuins and Resveratrol in Medicine
- Health Sciences › Medicine › Hematology › Hematopoietic Stem Cell Transplantation
- Life Sciences › Biochemistry, Genetics and Molecular Biology › Molecular Biology › Biochemical and Molecular Research
- Keywords
- NAD+ supplementation, nicotinamide riboside, hematopoietic stem cells, ATM deficiency, aging, competitive transplantation, DNA repair, mitochondrial function
About these checks
Registry, retraction, Cites and statistics results are computed, not judged, with one exception: a printed reference that no index lists is read once by a model before it counts as a citation error. Claims are extracted by a model and kept only when their quote appears verbatim in the text; each cited source is then checked, with a model’s help, for whether it says what the claim relies on. Those verdicts can be wrong — read the claim’s quote and the cited source before relying on one.
Statistics and arithmetic are recomputed, not judged.
Confidence bands are shown only for fields calibrated on our annotated test set. None is calibrated yet, so no band is shown.
What counts as a claim ›How we measure confidence ›How we check this ›
Are you an author, or do you see a problem with this page? Request a review
