

The DOI matches its Crossref record; 90 of the 90 references it cites were found in a registry or an index.
Probiotics synergized with conventional regimen in managing Parkinson’s disease
Open accessAbstract
Parkinson’s disease (PD) is mainly managed by pharmacological therapy (e.g., Benserazide and dopamine agonists). However, prolonged use of these drugs would gradually diminish their dopaminergic effect. Gut dysbiosis was observed in some patients with PD, suggesting close association between the gut microbiome and PD. Probiotics modulate the host’s gut microbiota beneficially. A 3-month randomized, double-blind, placebo-controlled clinical trial was conducted to investigate the beneficial effect of probiotic co-administration in patients with PD. Eighty-two PD patients were recruited and randomly divided into probiotic [ n = 48; Bifidobacterium animalis subsp. lactis Probio-M8 (Probio-M8), Benserazide, dopamine agonists] and placebo ( n = 34; placebo, Benserazide, dopamine agonists) groups. Finally, 45 and 29 patients from Probio-M8 and placebo groups provided complete fecal and serum samples for further omics analysis, respectively. The results showed that Probio-M8 co-administration conferred added benefits by improving sleep quality, alleviating anxiety, and gastrointestinal symptoms. Metagenomic analysis showed that, after the intervention, there were significantly more species-level genome bins (SGBs) of Bifidobacterium animalis , Ruminococcaceae , and Lachnospira , while less Lactobacillus fermentum and Klebsiella oxytoca in Probio-M8 group ( P < 0.05). Interestingly, Lactobacillus fermentum correlated positively with the scores of UPDRS-III, HAMA, HAMD-17, and negatively with MMSE. Klebsiella oxytoca correlated negatively with feces hardness. Moreover, co-administering Probio-M8 increased SGBs involved in tryptophan degradation, gamma-aminobutyric acid, short-chain fatty acids, and secondary bile acid biosynthesis, as well as serum acetic acid and dopamine levels ( P < 0.05). Taken together, Probio-M8 synergized with the conventional regimen and strengthened the clinical efficacy in managing PD, accompanied by modifications of the host’s gut microbiome, gut microbial metabolic potential, and serum metabolites.
Overview
The claims and statistics of this paper haven’t been checked yet.
Run the check — free, no account needed. It reads the open-access text and checks the sources it cites.
Integrity signals
Registry
Cites
Statistics
Figures
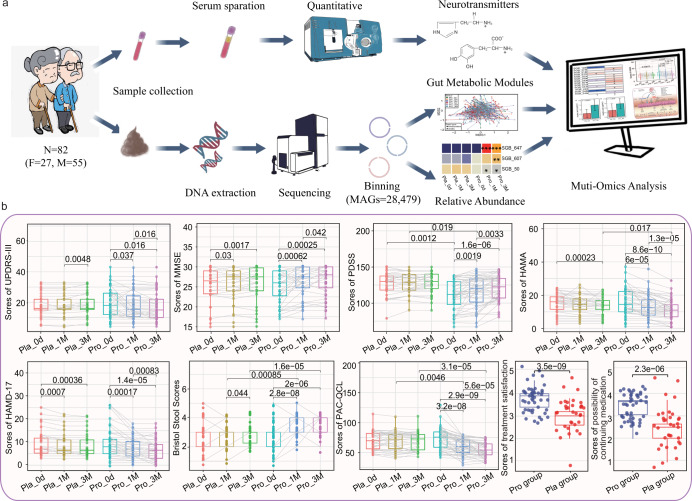
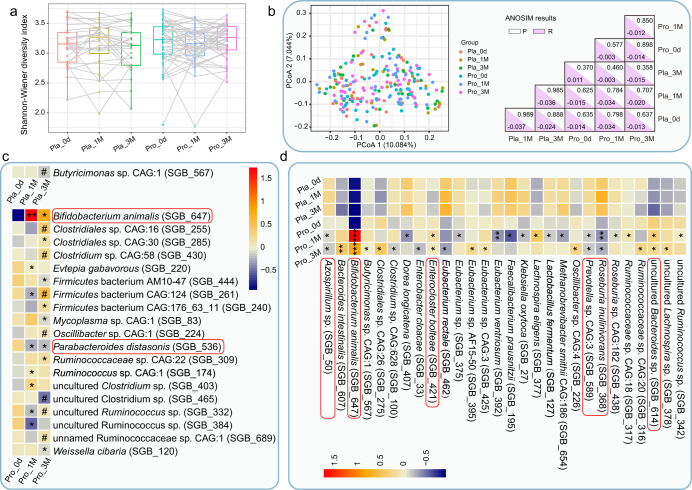
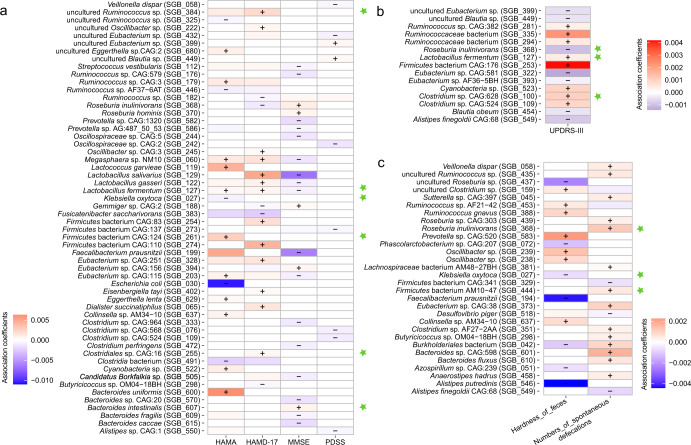
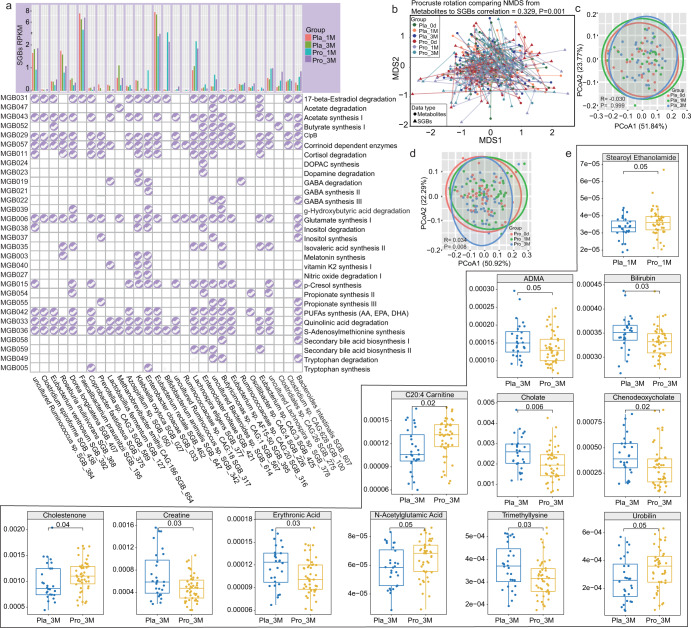
Verification
Claims the paper makes
The claims and statistics of this paper haven’t been checked yet.
Run the check — free, no account needed. It reads the open-access text and checks the sources it cites.
Claims other papers make about this one
Each is checked against this paper’s own text: does it say what the citing paper says it does?
In the citing paper
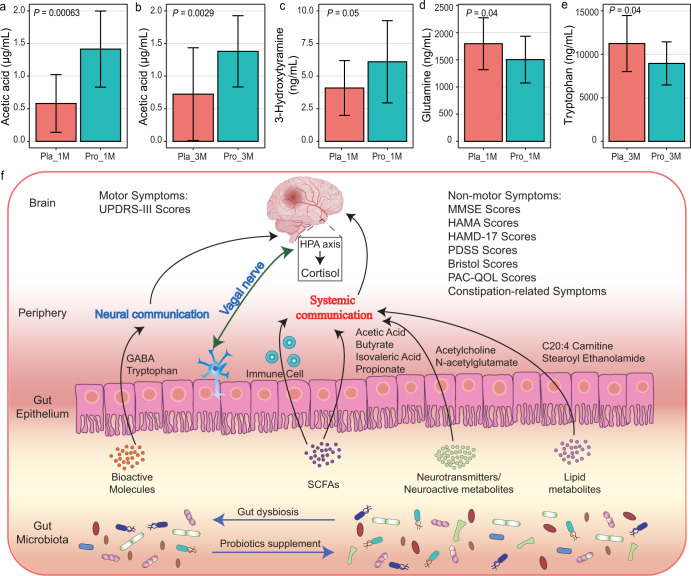
“the combined administration of probiotics with conventional regimen led to a reduction in serum glutamine concentrations in PD patients compared to the placebo group receiving the conventional regimen only.”
From Microbiota–gut–brain axis and its therapeutic applications in neurodegenerative diseases (2024) · cites this paper as [491]
In the citing paper
“In a recent randomized controlled trial (RCT), no significant changes in serum serotonin levels were observed following a 3-month adjunctive probiotic Bifidobacterium animalis subsp. lactis treatment in PD patients receiving conventional regimen (Benserazide and dopamine agonists).491 Furthermore, the administration of L. plantarum PS128 was ineffective in restoring MPTP-induced serotonin”
From Microbiota–gut–brain axis and its therapeutic applications in neurodegenerative diseases (2024) · cites this paper as [491]
Self-check
Percentages, sums and reported differences re-computed from the paper’s own numbers.
The self-check needs the paper’s full text.
Citations
Cites
1 retracted
Tamtaji, O. R., Taghizadeh, M., Daneshvar Kakhaki, R., Kouchaki, E., Bahmani, F., Borzabadi, S., Oryan, S., Mafi, A., & Asemi, Z. (2019) · Clinical Nutrition · doi:10.1016/j.clnu.2018.05.018 · Cited by 398
RetractedThe Sequence Alignment/Map format and SAMtools
Li, H., Handsaker, B., Wysoker, A., Fennell, T., Ruan, J., Homer, N., Marth, G., Abecasis, G., Durbin, R., & 1000 Genome Project Data Processing Subgroup (2009) · Bioinformatics · doi:10.1093/bioinformatics/btp352 · Cited by 62,041
Fast gapped-read alignment with Bowtie 2
Langmead, B., & Salzberg, S. L. (2012) · Nature Methods · doi:10.1038/nmeth.1923 · Cited by 56,400
Prodigal: prokaryotic gene recognition and translation initiation site identification
Hyatt, D., Chen, G.-L., LoCascio, P. F., Land, M., Larimer, F. W., & Hauser, L. (2010) · BMC Bioinformatics · doi:10.1186/1471-2105-11-119 · Cited by 12,692
Parks, D. H., Imelfort, M., Skennerton, C. T., Hugenholtz, P., & Tyson, G. W. (2015) · Genome Research · doi:10.1101/gr.186072.114 · Cited by 12,496
Hill (2014) · doi:10.1038/nrgastro.2014.66 · Cited by 9,592
MDS clinical diagnostic criteria for Parkinson’s disease
Postuma, R. B., Berg, D., Stern, M., Poewe, W., Olanow, C. W., Oertel, W., Obeso, J., Marek, K., Litvan, I., Lang, A. E., et al. (2015) · Movement Disorders · doi:10.1002/mds.26424 · Cited by 7,653
Enterotypes of the human gut microbiome
MetaHIT Consortium (additional members), Arumugam, M., Raes, J., Pelletier, E., Le Paslier, D., Yamada, T., Mende, D. R., Fernandes, G. R., Tap, J., Bruls, T., et al. (2011) · Nature · doi:10.1038/nature09944 · Cited by 7,548
Improved metagenomic analysis with Kraken 2
Wood, D. E., Lu, J., & Langmead, B. (2019) · Genome biology · doi:10.1186/s13059-019-1891-0 · Cited by 7,173
Cryan, J. F., O'Riordan, K. J., Cowan, C. S. M., Sandhu, K. V., Bastiaanssen, T. F. S., Boehme, M., Codagnone, M. G., Cussotto, S., Fulling, C., Golubeva, A. V., et al. (2019) · Physiological Reviews · doi:10.1152/physrev.00018.2018 · Cited by 5,286
Research works printed but not linked: 1
- Hsieh, T. H. et al. Probiotics alleviate the progressive deterioration of motor functions in a mouse model of Parkinson’s disease. Brain Sci. 10, 13 (2020). · DOI · Paper page
Cited by
Sorted by citations
Microbiota–gut–brain axis and its therapeutic applications in neurodegenerative diseases
Loh, J. S., Mak, W. Q., Tan, L. K. S., Ng, C. X., Chan, H. H., Yeow, S. H., Foo, J. B., Ong, Y. S., How, C. W., & Khaw, K. Y. (2024) · Signal Transduction and Targeted Therapy · doi:10.1038/s41392-024-01743-1 · Cited by 1,193
Facchin, S., Bertin, L., Bonazzi, E., Lorenzon, G., Barba, C. D., Barberio, B., Zingone, F., Maniero, D., Scarpa, M., Ruffolo, C., et al. (2024) · Life · doi:10.3390/life14050559 · Cited by 455
Probiotics, prebiotics, and postbiotics in health and disease
Ji, J., Jin, W., Liu, S., Jiao, Z., & Li, X. (2023) · MedComm · doi:10.1002/mco2.420 · Cited by 449
Targeting gut microbiota and metabolism as the major probiotic mechanism - An evidence-based review
Ma, T., Shen, X., Shi, X., Sakandar, H. A., Quan, K., Li, Y., Jin, H., Kwok, L., Zhang, H., & Sun, Z. (2023) · Trends in Food Science & Technology · doi:10.1016/j.tifs.2023.06.013 · Cited by 354
Self-citationQian, X., Li, Q., Zhu, H., Chen, Y., Lin, G., Zhang, H., Chen, W., Wang, G., & Tian, P. (2024) · Cell Reports Medicine · doi:10.1016/j.xcrm.2024.101798 · Cited by 135
Self-citation
Metadata
- Authors
- Sun, H., Zhao, F., Liu, Y., Ma, T., Jin, H., Quan, K., Leng, B., Zhao, J., Yuan, X., Li, Z., Li, F., Kwok, L.-Y., Zhang, S., Sun, Z., Zhang, J., & Zhang, H.
- Affiliations
- Inner Mongolia Agricultural University (CN)
- Shandong University (CN)
- Taishan Medical University (CN)
- Jinzhou Medical University (CN)
- Corresponding author
- Zhang, Jinbiao
- Zhang, Heping
- ORCID
- Venue
- npj Parkinson's Disease
- Published
- 2022-05-24
- Volume
- 8
- Issue
- 1
- Pages
- 62-62
- ISSN
- 2373-8057 (ISSN-L)
- PMC
- PMC9130297
- OpenAlex
- W4281396245
- Cited by
- 136
- References
- 90
- Citations by year
- 2026: 20 · 2025: 39 · 2024: 46 · 2023: 20 · 2022: 11
- FWCI
- 15.27
- Type
- journal article
- Language
- en
- Open access
- gold
- doi.org
- Locations
- npj Parkinson s Disease (publishedVersion, cc-by)
- PubMed Central (publishedVersion, cc-by)
- PubMed (publishedVersion)
- DOAJ (DOAJ: Directory of Open Access Journals) (submittedVersion, cc-by-sa)
- Funders
- National Natural Science Foundation of China (31720103911)
- Inner Mongolia Science & Technology Major Projects
- Topics
- Health Sciences › Medicine › Clinical Neurology › Parkinson's Disease Mechanisms and Treatments
- Life Sciences › Agricultural and Biological Sciences › Food Science › Probiotics and Fermented Foods
- Life Sciences › Biochemistry, Genetics and Molecular Biology › Molecular Biology › Gut microbiota and health
- Keywords
- Parkinson's disease, probiotics, Bifidobacterium animalis subsp. lactis, gut microbiota, benserazide, dopamine agonists, sleep quality, anxiety, gastrointestinal symptoms, Lactobacillus fermentum, Klebsiella oxytoca, tryptophan degradation, short-chain fatty acids, bile acid synthesis, dopamine levels, serum metabolites
About these checks
Registry, retraction, Cites and statistics results are computed, not judged, with one exception: a printed reference that no index lists is read once by a model before it counts as a citation error. Claims are extracted by a model and kept only when their quote appears verbatim in the text; each cited source is then checked, with a model’s help, for whether it says what the claim relies on. Those verdicts can be wrong — read the claim’s quote and the cited source before relying on one.
Statistics and arithmetic are recomputed, not judged.
Confidence bands are shown only for fields calibrated on our annotated test set. None is calibrated yet, so no band is shown.
What counts as a claim ›How we measure confidence ›How we check this ›
Are you an author, or do you see a problem with this page? Request a review
