

Efficient quantum state tomography with convolutional neural networks
Open accessThe DOI matches its Crossref record; 50 of the 51 references it cites were found in a registry or an index.
Abstract
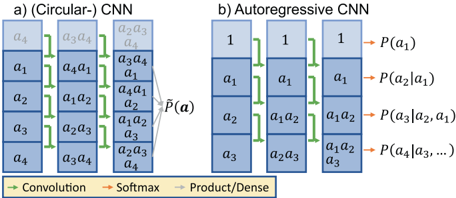
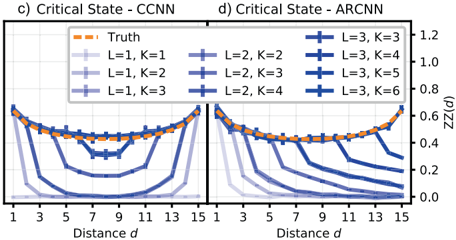
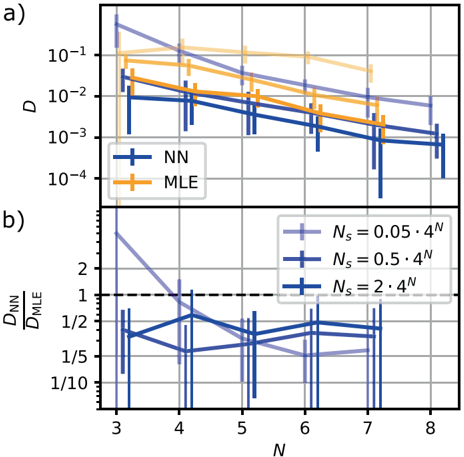
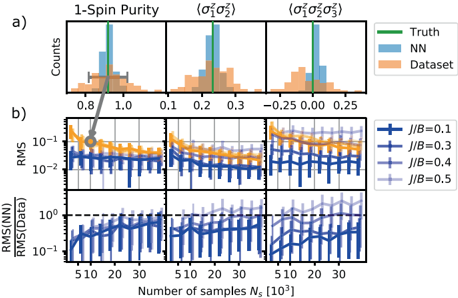
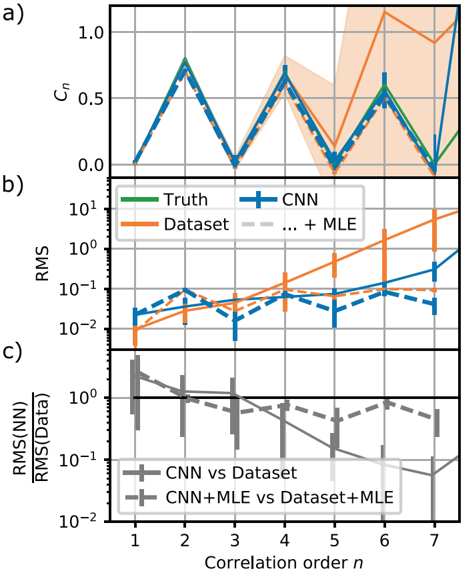
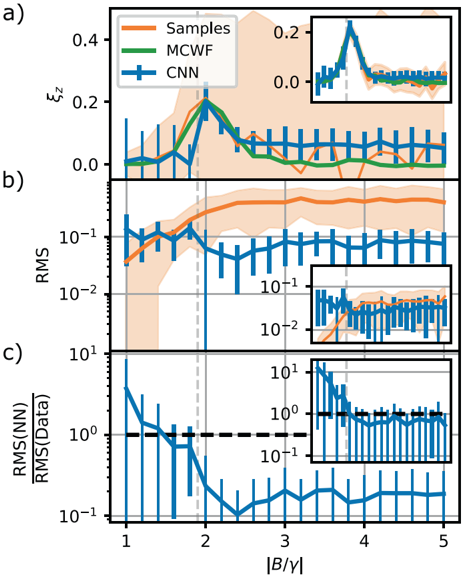
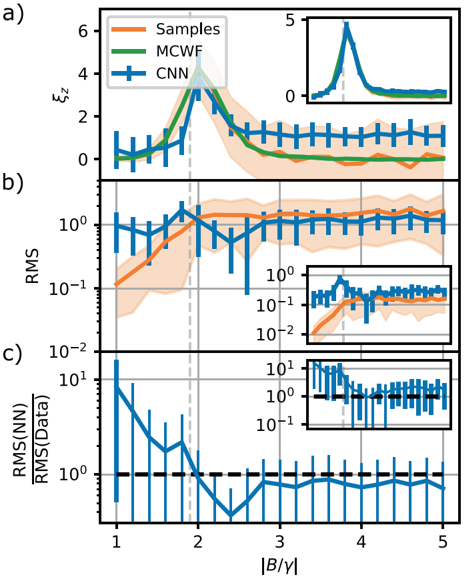
Modern day quantum simulators can prepare a wide variety of quantum states but the accurate estimation of observables from tomographic measurement data often poses a challenge. We tackle this problem by developing a quantum state tomography scheme which relies on approximating the probability distribution over the outcomes of an informationally complete measurement in a variational manifold represented by a convolutional neural network. We show an excellent representability of prototypical ground- and steady states with this ansatz using a number of variational parameters that scales polynomially in system size. This compressed representation allows us to reconstruct states with high classical fidelities outperforming standard methods such as maximum likelihood estimation. Furthermore, it achieves a reduction of the estimation error of observables by up to an order of magnitude compared to their direct estimation from experimental data.
Overview
The claims and statistics of this paper haven’t been checked yet.
Free: it reads the open-access text and checks the first 5 claims that cite a source we can check. Create a free account to check every claim.
Integrity signals
Registry
Cites
Statistics
Figures
Verification
Claims the paper makes
The claims and statistics of this paper haven’t been checked yet.
Free: it reads the open-access text and checks the first 5 claims that cite a source we can check. Create a free account to check every claim.
Self-check
Percentages, sums and reported differences re-computed from the paper’s own numbers.
The self-check needs the paper’s full text.
Citations
Cites
Multilayer feedforward networks are universal approximators
Hornik, K., Stinchcombe, M., & White, H. (1989) · Neural Networks · doi:10.1016/0893-6080(89)90020-8 · Cited by 21,728 · cited 1×
“motivated by universal approximation theorems [20, 21] and the observation that many NQS can efficiently encode volume-law entanglement and thereby have higher representational power compared to most tensor-network based approaches [22–24] as well as a favorable generalization to higher dimensions.”
BackgroundQuantum Computing in the NISQ era and beyond
Preskill, J. (2018) · Quantum · doi:10.22331/q-2018-08-06-79 · Cited by 8,830
Approximation capabilities of multilayer feedforward networks
Hornik, K. (1991) · Neural Networks · doi:10.1016/0893-6080(91)90009-t · Cited by 6,091
Monte Carlo Strategies in Scientific Computing
Liu, J. S. (2004) · Springer Series in Statistics · doi:10.1007/978-0-387-76371-2 · Cited by 2,690
QuTiP 2: A Python framework for the dynamics of open quantum systems
Johansson, J. R., Nation, P. D., & Nori, F. (2013) · Computer Physics Communications · doi:10.1016/j.cpc.2012.11.019 · Cited by 2,242
Solving the quantum many-body problem with artificial neural networks
Carleo, G., & Troyer, M. (2017) · Science · doi:10.1126/science.aag2302 · Cited by 2,215
The quantum-jump approach to dissipative dynamics in quantum optics
Plenio, M. B., & Knight, P. L. (1998) · Reviews of Modern Physics · doi:10.1103/revmodphys.70.101 · Cited by 1,515 · cited 1×
“We use the Monte-Carlo wave function approach [52], to simulate the”
MethodPredicting many properties of a quantum system from very few measurements
Huang, H.-Y., Kueng, R., & Preskill, J. (2020) · Nature Physics · doi:10.1038/s41567-020-0932-7 · Cited by 1,240
Quantum State Tomography via Compressed Sensing
Gross, D., Liu, Y.-K., Flammia, S. T., Becker, S., & Eisert, J. (2010) · Physical Review Letters · doi:10.1103/physrevlett.105.150401 · Cited by 1,093
Neural-network quantum state tomography
Torlai, G., Mazzola, G., Carrasquilla, J., Troyer, M., Melko, R., & Carleo, G. (2018) · Nature Physics · doi:10.1038/s41567-018-0048-5 · Cited by 843
Research works printed but not linked: 4
- Deng, D.-L., Li, X. & Das Sarma, S. Quantum entanglement in neural network states. Phys. Rev. X 7, 021021 (2017).
- Huang, H. & Situ, H. Investigating reconstruction of quantum state distributions with neural networks. Eur. Phys. J. 136, 204 (2021).
- Lohani, S., Kirby, B. T., Brodsky, M., Danaci, O. & Glasser, R. T. Machine learning assisted quantum state estimation. Mach. Learn.: Sci. Technol. 1, 035007 (2020).
- Kingma, D. P. & Ba, J. Adam: A method for stochastic optimization. arXiv:1412.6980. http://arxiv.org/abs/1412.6980 (2017). · arXiv
Cited by
From architectures to applications: a review of neural quantum states
Lange, H., de Walle, A. V., Abedinnia, A., & Bohrdt, A. (2024) · Quantum Science and Technology · doi:10.1088/2058-9565/ad7168 · Cited by 181
Modern applications of machine learning in quantum sciencesPreprint
Dawid, A., Arnold, J., Requena, B., Gresch, A., Płodzień, M., Donatella, K., Nicoli, K. A., Stornati, P., Koch, R., Büttner, M., et al. (2022) · arXiv (Cornell University) · doi:10.48550/arxiv.2204.04198 · Cited by 180
Beyond-classical computation in quantum simulation
King, A. D., Nocera, A., Rams, M. M., Dziarmaga, J., Wiersema, R., Bernoudy, W., Raymond, J., Kaushal, N., Heinsdorf, N., Harris, R., et al. (2025) · Science · doi:10.1126/science.ado6285 · Cited by 138
Artificial intelligence for quantum computing
Alexeev, Y., Farag, M. H., Patti, T. L., Wolf, M. E., Ares, N., Aspuru‐Guzik, A., Benjamin, S. C., Cai, Z., Cao, S., Chamberland, C., et al. (2025) · Nature Communications · doi:10.1038/s41467-025-65836-3 · Cited by 137
Variational Monte Carlo with large patched transformers
Sprague, K., & Czischek, S. (2024) · Communications Physics · doi:10.1038/s42005-024-01584-y · Cited by 73
Metadata
- Authors
- Schmale, T., Reh, M., & Gärttner, M.
- Affiliations
- Heidelberg University (DE)
- Corresponding author
- Schmale, Tobias
- Reh, Moritz
- Gärttner, Martin
- Venue
- npj Quantum Information
- Published
- 2022-09-23
- Volume
- 8
- Issue
- 1
- ISSN
- 2056-6387 (ISSN-L)
- OpenAlex
- W4296836560
- Cited by
- 76
- References
- 51
- Citations by year
- 2026: 13 · 2025: 31 · 2024: 20 · 2023: 11 · 2022: 1
- FWCI
- 5.18
- Type
- journal article
- Language
- en
- Open access
- gold
- doi.org
- Licence
- cc-by
- creativecommons.org/licenses/by/4.0 (tdm)
- creativecommons.org/licenses/by/4.0 (vor)
- Locations
- npj Quantum Information (publishedVersion, cc-by)
- arXiv (Cornell University) (submittedVersion)
- DOAJ (DOAJ: Directory of Open Access Journals) (submittedVersion, cc-by-sa)
- arXiv (Cornell University)
- Funders
- Deutsche Forschungsgemeinschaft (EXC2181/1-390900948, SFB 1225, INST 40/575-1 FUGG)
- Gauss Centre for Supercomputing e.V.
- Topics
- Physical Sciences › Computer Science › Artificial Intelligence › Quantum Computing Algorithms and Architecture
- Physical Sciences › Physics and Astronomy › Atomic and Molecular Physics, and Optics › Quantum many-body systems
- Physical Sciences › Physics and Astronomy › Atomic and Molecular Physics, and Optics › Quantum Information and Cryptography
- Keywords
- quantum state tomography, convolutional neural networks, variational ansatz, informationally complete measurements, density estimation, quantum simulators, ground state, steady state, maximum likelihood estimation
About these checks
Registry, retraction, Cites and statistics results are computed, not judged, with one exception: a printed reference that no index lists is read once by a model before it counts as a citation error. Claims are extracted by a model and kept only when their quote appears verbatim in the text; each cited source is then checked, with a model’s help, for whether it says what the claim relies on. Those verdicts can be wrong — read the claim’s quote and the cited source before relying on one.
Statistics and arithmetic are recomputed, not judged.
Confidence bands are shown only for fields calibrated on our annotated test set. None is calibrated yet, so no band is shown.
What counts as a claim ›How we measure confidence ›How we check this ›
Are you an author, or do you see a problem with this page? Request a review
How to cite
Cite CoChat for the checks on this page, and the paper for its own findings.
- This page
- CoChat. (2026). Citation check: Efficient quantum state tomography with convolutional neural networks. https://app.cochat.ai/papers/10.1038/s41534-022-00621-4
- The paper
- Schmale, T., Reh, M., & Gärttner, M. (2022). Efficient quantum state tomography with convolutional neural networks. npj Quantum Information. https://doi.org/10.1038/s41534-022-00621-4
Data sources
Bibliographic data: Semantic Scholar, OpenAlex, Crossref.
Contains information from the Semantic Scholar Academic Graph Datasets, made available under the ODC Attribution License (ODC-BY 1.0).
Semantic Scholar’s data is described in: Kinney, R., et al. (2023). The Semantic Scholar Open Data Platform. arXiv:2301.10140.
