

From expression footprints to causal pathways: contextualizing large signaling networks with CARNIVAL
Open accessPublished version of a preprint
The DOI matches its Crossref record; 52 of the 52 references it cites were found in a registry or an index.
Abstract
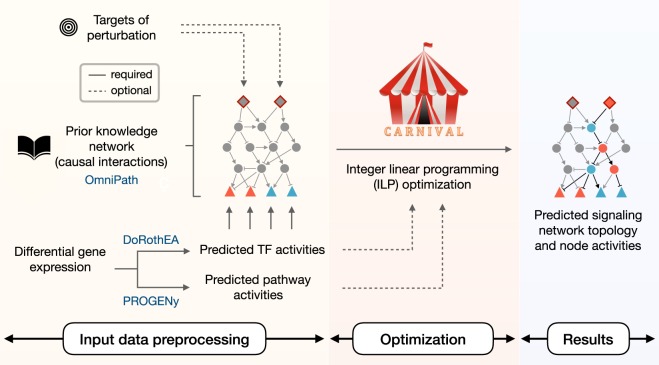
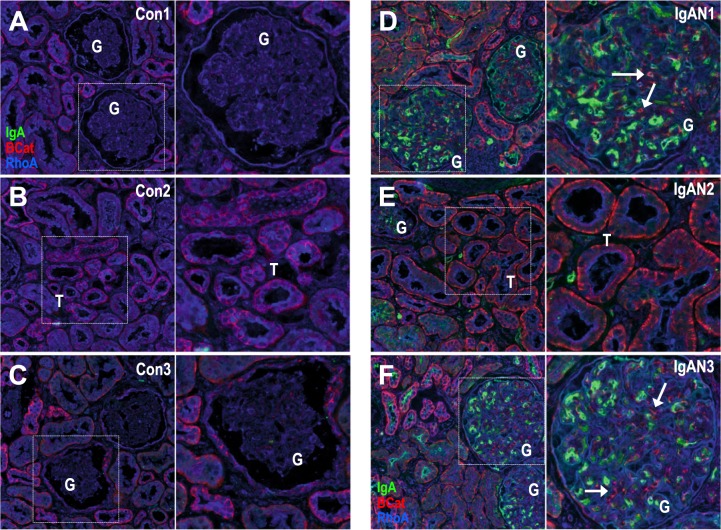
While gene expression profiling is commonly used to gain an overview of cellular processes, the identification of upstream processes that drive expression changes remains a challenge. To address this issue, we introduce CARNIVAL, a causal network contextualization tool which derives network architectures from gene expression footprints. CARNIVAL (CAusal Reasoning pipeline for Network identification using Integer VALue programming) integrates different sources of prior knowledge including signed and directed protein–protein interactions, transcription factor targets, and pathway signatures. The use of prior knowledge in CARNIVAL enables capturing a broad set of upstream cellular processes and regulators, leading to a higher accuracy when benchmarked against related tools. Implementation as an integer linear programming (ILP) problem guarantees efficient computation. As a case study, we applied CARNIVAL to contextualize signaling networks from gene expression data in IgA nephropathy (IgAN), a condition that can lead to chronic kidney disease. CARNIVAL identified specific signaling pathways and associated mediators dysregulated in IgAN including Wnt and TGF-β, which we subsequently validated experimentally. These results demonstrated how CARNIVAL generates hypotheses on potential upstream alterations that propagate through signaling networks, providing insights into diseases.
Overview
The claims and statistics of this paper haven’t been checked yet.
Free: it reads the open-access text and checks the first 5 claims that cite a source we can check. Create a free account to check every claim.
Integrity signals
Registry
Cites
Statistics
Figures


Verification
Claims the paper makes
The claims and statistics of this paper haven’t been checked yet.
Free: it reads the open-access text and checks the first 5 claims that cite a source we can check. Create a free account to check every claim.
Claims other papers make about this one
Each is checked against this paper’s own text: does it say what the citing paper says it does?
The source backs part of the claim, not all of it — or backs it for a different population, condition or comparison.
In the citing paper
“To infer signaling processes, the CARNIVAL algorithm combines upstream perturbation information (i.e., drug targets) with downstream measurements (i.e., transcription factor (TF) activities) and a causal prior knowledge network (PKN) (Liu et al, 2019).”
From Network integration of thermal proteome profiling with multi-omics data decodes PARP inhibition (2024) · cites this paper as Liu et al, 2019
Experimental — accuracy not yet measured
Self-check
Percentages, sums and reported differences re-computed from the paper’s own numbers.
The self-check needs the paper’s full text.
Citations
Cites
Subramanian, A., Tamayo, P., Mootha, V. K., Mukherjee, S., Ebert, B. L., Gillette, M. A., Paulovich, A., Pomeroy, S. L., Golub, T. R., Lander, E. S., et al. (2005) · Proceedings of the National Academy of Sciences · doi:10.1073/pnas.0506580102 · Cited by 53,625
Cytoscape: A software Environment for integrated models of biomolecular interaction networks
Shannon, P., Markiel, A., Ozier, O., Baliga, N. S., Wang, J. T., Ramage, D., Amin, N., Schwikowski, B., & Ideker, T. (2003) · Genome Research · doi:10.1101/gr.1239303 · Cited by 51,888
limma powers differential expression analyses for RNA-sequencing and microarray studies
Ritchie, M. E., Phipson, B., Wu, D., Hu, Y., Law, C. W., Shi, W., & Smyth, G. K. (2015) · Nucleic Acids Research · doi:10.1093/nar/gkv007 · Cited by 40,458
The igraph software package for complex network research
Csárdi, G., & Nepusz, T. (2006) · Medical Entomology and Zoology · Cited by 13,507
KEGG: new perspectives on genomes, pathways, diseases and drugs
Kanehisa, M., Furumichi, M., Tanabe, M., Sato, Y., & Morishima, K. (2017) · Nucleic Acids Research · doi:10.1093/nar/gkw1092 · Cited by 8,865
Leek, J. T., Johnson, W. E., Parker, H. S., Jaffe, A. E., & Storey, J. D. (2012) · Bioinformatics · doi:10.1093/bioinformatics/bts034 · Cited by 6,231 · cited 1×
“Batch effects were removed using the combat function of the sva R-package.(39) Differential gene expression compared to vehicle control in the same dataset was then computed with the limma R package.”
MethodInsights into the regulation of protein abundance from proteomic and transcriptomic analyses
Vogel, C., & Marcotte, E. M. (2012) · Nature Reviews Genetics · doi:10.1038/nrg3185 · Cited by 4,195
PhosphoSitePlus, 2014: mutations, PTMs and recalibrations
Hornbeck, P. V., Zhang, B., Murray, B., Kornhauser, J. M., Latham, V., & Skrzypek, E. (2015) · Nucleic Acids Research · doi:10.1093/nar/gku1267 · Cited by 3,411
Oncogenic pathway signatures in human cancers as a guide to targeted therapies
Bild, A. H., Yao, G., Chang, J. T., Wang, Q., Potti, A., Chasse, D., Joshi, M.-B., Harpole, D., Lancaster, J. M., Berchuck, A., et al. (2006) · Nature · doi:10.1038/nature04296 · Cited by 2,032
Wyatt, R. J., & Julian, B. A. (2013) · New England Journal of Medicine · doi:10.1056/nejmra1206793 · Cited by 1,222
Cited by
Bernardes, J. P., Mishra, N., Tran, F., Bahmer, T., Best, L., Blase, J. I., Bordoni, D., Franzenburg, J., Geisen, U., Josephs-Spaulding, J., et al. (2020) · Immunity · doi:10.1016/j.immuni.2020.11.017 · Cited by 369
Integrated intra‐ and intercellular signaling knowledge for multicellular omics analysis
Türei, D., Valdeolivas, A., Gul, L., Palacio‐Escat, N., Klein, M., Ivanova, O., Ölbei, M., Gábor, A., Theis, F., Módos, D., et al. (2021) · Molecular Systems Biology · doi:10.15252/msb.20209923 · Cited by 369
Transcription factors: Bridge between cell signaling and gene regulation
Weidemüller, P., Kholmatov, M., Petsalaki, E., & Zaugg, J. B. (2021) · PROTEOMICS · doi:10.1002/pmic.202000034 · Cited by 285
LIANA+ Provides an All-in-One Framework for Cell–Cell Communication Inference
Dimitrov, D., Schäfer, P. S. L., Farr, E., Rodriguez-Mier, P., Lobentanzer, S., Badia-i-Mompel, P., Dugourd, A., Tanevski, J., Ramirez Flores, R. O., & Saez-Rodriguez, J. (2024) · Nature Cell Biology · doi:10.1038/s41556-024-01469-w · Cited by 263
“…pathways, disease or location ( c ). d , Similarly, it uses this prior knowledge to infer putative causal (sign-coherent) signalling networks 49,79 , emanating from ligand–receptor interactions down to active TFs. e , The TF activities can be estimated by making use of generalistic regulon…”
A guide to multi-omics data collection and integration for translational medicine
Athieniti, E., & Spyrou, G. M. (2023) · Computational and Structural Biotechnology Journal · doi:10.1016/j.csbj.2022.11.050 · Cited by 174
Metadata
- Authors
- Liu, A., Trairatphisan, P., Gjerga, E., Didangelos, A., Barratt, J., & Saez-Rodriguez, J.
- Affiliations
- Heidelberg University (DE)
- University of Leicester (GB)
- ORCID
- Venue
- npj Systems Biology and Applications
- Published
- 2019-11-11
- Volume
- 5
- Issue
- 1
- Pages
- 40-40
- ISSN
- 2056-7189 (ISSN-L)
- PMC
- PMC6848167
- OpenAlex
- W2986455832
- Cited by
- 151
- References
- 50
- Citations by year
- 2026: 16 · 2025: 24 · 2024: 21 · 2023: 20 · 2022: 32 · 2021: 25 · 2020: 11 · 2019: 2
- FWCI
- 5.87
- Type
- journal article
- Language
- en
- Open access
- gold
- doi.org
- Licence
- cc-by
- creativecommons.org/licenses/by/4.0 (tdm)
- creativecommons.org/licenses/by/4.0 (vor)
- Locations
- npj Systems Biology and Applications (publishedVersion, cc-by)
- PubMed Central (publishedVersion, cc-by)
- PubMed (publishedVersion)
- DOAJ (DOAJ: Directory of Open Access Journals) (submittedVersion)
- Funders
- Innovative Medicines Initiative 2 Joint Undertaking "TransQST"
- European Union's Horizon 2020 program "Marie-Curie ITN"
- Topics
- Life Sciences › Biochemistry, Genetics and Molecular Biology › Molecular Biology › Bioinformatics and Genomic Networks
- Life Sciences › Biochemistry, Genetics and Molecular Biology › Molecular Biology › Gene Regulatory Network Analysis
- Health Sciences › Medicine › Health Informatics › Biomedical Text Mining and Ontologies
- Keywords
- carnival, causal network inference, signaling networks, integer linear programming, prior knowledge incorporation, protein-protein interaction, transcription factor targets, pathway signatures, IgA nephropathy, Wnt signaling, TGF-beta signaling, upstream regulators, chronic kidney disease
- MeSH terms
- Algorithms, Gene Expression Regulation, Humans, Programming, Linear, Software, Transcription Factors, Signal Transduction, Computational Biology, Gene Expression Profiling, Microarray Analysis, Gene Regulatory Networks
About these checks
Registry, retraction, Cites and statistics results are computed, not judged, with one exception: a printed reference that no index lists is read once by a model before it counts as a citation error. Claims are extracted by a model and kept only when their quote appears verbatim in the text; each cited source is then checked, with a model’s help, for whether it says what the claim relies on. Those verdicts can be wrong — read the claim’s quote and the cited source before relying on one.
Statistics and arithmetic are recomputed, not judged.
Confidence bands are shown only for fields calibrated on our annotated test set. None is calibrated yet, so no band is shown.
What counts as a claim ›How we measure confidence ›How we check this ›
Are you an author, or do you see a problem with this page? Request a review
How to cite
Cite CoChat for the checks on this page, and the paper for its own findings.
- This page
- CoChat. (2026). Citation check: From expression footprints to causal pathways: contextualizing large signaling networks with CARNIVAL. https://app.cochat.ai/papers/10.1038/s41540-019-0118-z
- The paper
- Liu, A., Trairatphisan, P., Gjerga, E., Didangelos, A., Barratt, J., & Saez-Rodriguez, J. (2019). From expression footprints to causal pathways: contextualizing large signaling networks with CARNIVAL. npj Systems Biology and Applications. https://doi.org/10.1038/s41540-019-0118-z
Data sources
Bibliographic data: Semantic Scholar, OpenAlex, Crossref.
Contains information from the Semantic Scholar Academic Graph Datasets, made available under the ODC Attribution License (ODC-BY 1.0).
Semantic Scholar’s data is described in: Kinney, R., et al. (2023). The Semantic Scholar Open Data Platform. arXiv:2301.10140.
