Cited by 32

The DOI matches its Crossref record; 6 of the 6 references it cites were found in a registry or an index.

Haematopoietic stem and progenitor cell heterogeneity is inherited from the embryonic endothelium

Ghersi, Joey J., Baldissera, Gabriel, Hintzen, Jared, Luff, Stephanie A., Cheng, Siyuan, Xia, Ivan Fan, Sturgeon, Christopher M., Nicoli, Stefania·2023·Nature Cell Biology

Abstract

Definitive haematopoietic stem and progenitor cells (HSPCs) generate erythroid, lymphoid and myeloid lineages. HSPCs are produced in the embryo via transdifferentiation of haemogenic endothelial cells in the aorta–gonad–mesonephros (AGM). HSPCs in the AGM are heterogeneous in differentiation and proliferative output, but how these intrinsic differences are acquired remains unanswered. Here we discovered that loss of microRNA (miR)-128 in zebrafish leads to an expansion of HSPCs in the AGM with different cell cycle states and a skew towards erythroid and lymphoid progenitors. Manipulating miR-128 in differentiating haemogenic endothelial cells, before their transition to HSPCs, recapitulated the lineage skewing in both zebrafish and human pluripotent stem cells. miR-128 promotes Wnt and Notch signalling in the AGM via post-transcriptional repression of the Wnt inhibitor csnk1a1 and the Notch ligand jag1b . De-repression of cskn1a1 resulted in replicative and erythroid-biased HSPCs, whereas de-repression of jag1b resulted in G2/M and lymphoid-biased HSPCs with long-term consequence on the respective blood lineages. We propose that HSPC heterogeneity arises in the AGM endothelium and is programmed in part by Wnt and Notch signalling.

Overview

The claims and statistics of this paper haven’t been checked yet.

Run the check — free, no account needed. It reads the open-access text and checks the sources it cites.

A few free checks a day · papers already verified open instantly · results are public

Integrity signals

Registry

Crossref · 10.1038/s41556-023-01187-9

Cites

6 of 6 references verified0 citation errors · 0 not checkable

Statistics

Figures

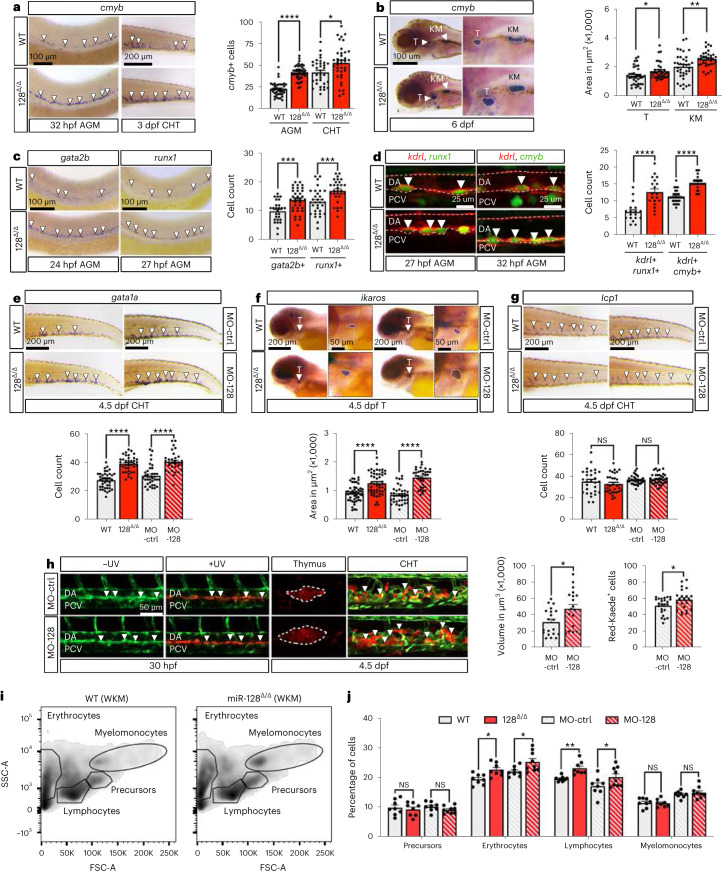
Fig. 1 nHSPC development and blood lineages are altered in miR-128Δ/Δ. a, WISH against cmyb at 32 hpf and 3 dpf in WT or miR-128Δ/Δ (128Δ/Δ) AGM (n = 39 (WT) and 42 (128Δ/Δ) embryos; P < 0.0001) and CHT (n = 33 (WT) and 48 (128Δ/Δ) embryos; P = 0.0151) (3 independent experiments, two-tailed Mann–Whitney test). b, WISH against cmyb at 6 dpf in WT (thymus n = 36 and KM n = 36 embryos; P = 0.0133) and 128Δ/Δ (thymus n = 35 and KM n = 36 embryos; P = 0.0033; 3 independent experiments; two-tailed Mann–Whitney test). c, WISH against gata2b (n = 27 (WT) and 35 (128Δ/Δ) embryos; P = 0.0005) and runx1 (n = 32 (WT) and 30 (128Δ/Δ) embryos; P = 0.0009; 3 independent experiments; two-tailed Mann–Whitney test). d, Confocal images of Tg(kdrl:mCherrys896,cmyb:GFPzf169) (n = 18 (WT) and 19 (128Δ/Δ) embryos; P < 0.0001) and Tg(kdrl:mCherrys896,runx1:GFPy509) (n = 29 (WT) and 31 (128Δ/Δ) embryos; P < 0.0001) AGM at 27 and 32 hpf, respectively. Quantification represents runx1+, kdrl+ (hemECs) and cmyb+, kdrl+ (nHSPCs) cells (3 independent experiments; two-tailed Mann–Whitney test). e–g, WISH of gata1a (n = 40 (WT), 37 (128Δ/Δ), 34 (MO-ctrl) and 31 (Mo-128) embryos; P < 0.0001) (e), ikaros (n = 48 (WT); 48 (128Δ/Δ), 37 (MO-ctrl) and 34 (Mo-128) embryos; P < 0.0001) (f) and lcp1 (n = 29 (WT), 32 (128Δ/Δ), 36 (MO-ctrl), 38 (Mo-128) embryos; P = 0.0511 and 0.4257) (g) at 4.5 dpf with their quantification (3 independent experiments; two-tailed Mann–Whitney test). h, Confocal live imaging of Tg(fli1a:Gal4ubs4,UAS:Kaederk8), ± UV (photoconversion) in the AGM. Quantification represents the red thymus area (MO-ctrl, 20; Mo-128, 19 embryos; P = 0.0151) and the number of red cells in the CHT (MO-ctrl, 19; Mo-128, 22 embryos; P = 0.0462; 3 independent experiments; two-tailed Mann–Whitney test). i, Flow cytometry analysis of 1-month-old dissected whole (W)KM WT, 128Δ/Δ. j, Quantification of cell population identified by flow cytometry (n = 8 (WT), 8 (128Δ/Δ), 8 (MO-ctrl) and 9 (MO-128) zebrafish; two-way ANOVA with multiple comparisons). All quantifications are represented with mean ± s.e.m. NS, not significant: P > 0.05, *P ≤ 0.05, **P ≤ 0.01, ***P ≤ 0.001, ****P ≤ 0.0001. Arrowheads indicate cells stained by WISH and IF and cells photoconverted in h. T, thymus; DA, dorsal aorta; PCV, posterior cardinal vein; SSC-A, side scatter A; FSC-A, forward scatter A. Source data
Fig. 1 nHSPC development and blood lineages are altered in miR-128Δ/Δ. a, WISH against cmyb at 32 hpf and 3 dpf in WT or miR-128Δ/Δ (128Δ/Δ) AGM (n = 39 (WT) and 42 (128Δ/Δ) embryos; P < 0.0001) and CHT (n = 33 (WT) and 48 (128Δ/Δ) embryos; P = 0.0151) (3 independent experiments, two-tailed Mann–Whitney test). b, WISH against cmyb at 6 dpf in WT (thymus n = 36 and KM n = 36 embryos; P = 0.0133) and 128Δ/Δ (thymus n = 35 and KM n = 36 embryos; P = 0.0033; 3 independent experiments; two-tailed Mann–Whitney test). c, WISH against gata2b (n = 27 (WT) and 35 (128Δ/Δ) embryos; P = 0.0005) and runx1 (n = 32 (WT) and 30 (128Δ/Δ) embryos; P = 0.0009; 3 independent experiments; two-tailed Mann–Whitney test). d, Confocal images of Tg(kdrl:mCherrys896,cmyb:GFPzf169) (n = 18 (WT) and 19 (128Δ/Δ) embryos; P < 0.0001) and Tg(kdrl:mCherrys896,runx1:GFPy509) (n = 29 (WT) and 31 (128Δ/Δ) embryos; P < 0.0001) AGM at 27 and 32 hpf, respectively. Quantification represents runx1+, kdrl+ (hemECs) and cmyb+, kdrl+ (nHSPCs) cells (3 independent experiments; two-tailed Mann–Whitney test). e–g, WISH of gata1a (n = 40 (WT), 37 (128Δ/Δ), 34 (MO-ctrl) and 31 (Mo-128) embryos; P < 0.0001) (e), ikaros (n = 48 (WT); 48 (128Δ/Δ), 37 (MO-ctrl) and 34 (Mo-128) embryos; P < 0.0001) (f) and lcp1 (n = 29 (WT), 32 (128Δ/Δ), 36 (MO-ctrl), 38 (Mo-128) embryos; P = 0.0511 and 0.4257) (g) at 4.5 dpf with their quantification (3 independent experiments; two-tailed Mann–Whitney test). h, Confocal live imaging of Tg(fli1a:Gal4ubs4,UAS:Kaederk8), ± UV (photoconversion) in the AGM. Quantification represents the red thymus area (MO-ctrl, 20; Mo-128, 19 embryos; P = 0.0151) and the number of red cells in the CHT (MO-ctrl, 19; Mo-128, 22 embryos; P = 0.0462; 3 independent experiments; two-tailed Mann–Whitney test). i, Flow cytometry analysis of 1-month-old dissected whole (W)KM WT, 128Δ/Δ. j, Quantification of cell population identified by flow cytometry (n = 8 (WT), 8 (128Δ/Δ), 8 (MO-ctrl) and 9 (MO-128) zebrafish; two-way ANOVA with multiple comparisons). All quantifications are represented with mean ± s.e.m. NS, not significant: P > 0.05, *P ≤ 0.05, **P ≤ 0.01, ***P ≤ 0.001, ****P ≤ 0.0001. Arrowheads indicate cells stained by WISH and IF and cells photoconverted in h. T, thymus; DA, dorsal aorta; PCV, posterior cardinal vein; SSC-A, side scatter A; FSC-A, forward scatter A. Source dataCC BY · PubMed Central
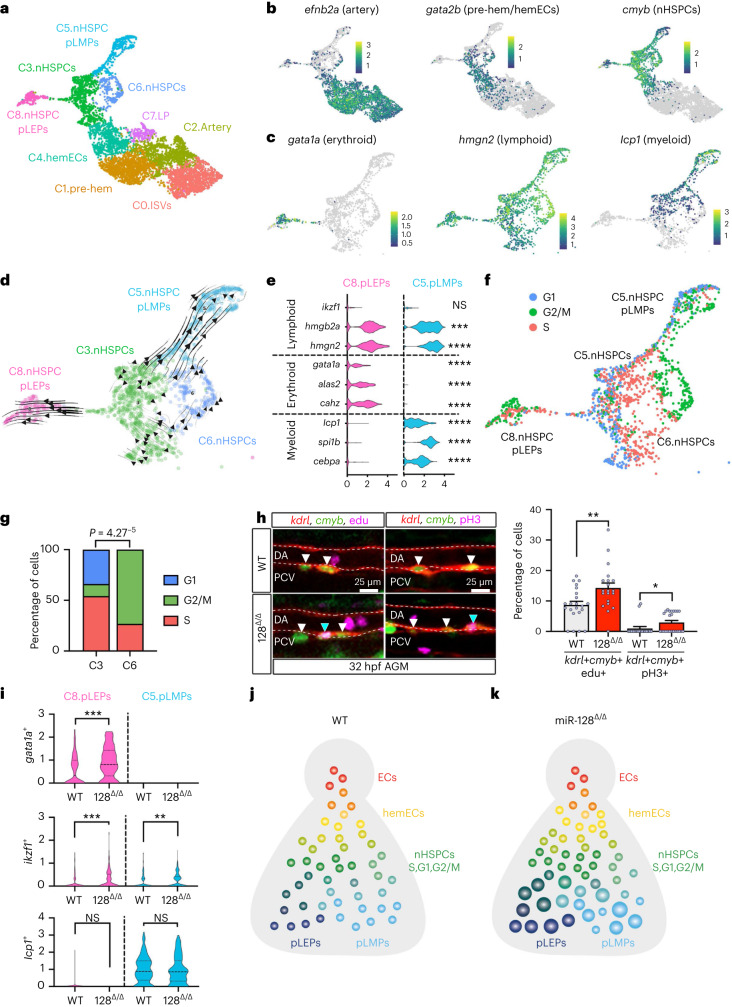
Fig. 2 nHSPC heterogeneity is defined by cell cycle and lineage bias phenotypes and regulated by miR-128. a, UMAP of defined EHT cluster cells from kdr+ ECs in the tail of WT and 128Δ/Δ at 26 hpf. b, UMAP representing efnb2a, gata2b and cmyb expression normalized with Z-score. c, UMAP of gata1a, hmgn2 and lcp1 expression normalized with Z-score, in nHSPC cmyb+ clusters (C3, C6, C8 and C5). d, RNA velocity trajectories in nHSPC clusters showing that C8.nHSPC pLEPs and C5.nHSPC pLMPs are terminal states of C3.nHSPCs and C6.nHSPCs. e, Violin plot of lymphoid (ikzf1, P > 0.9999; hmgb2a, P = 0.0001; hmgn2, P < 0.0001), erythroid (gata1a, P < 0.0001; alas2, P < 0.0001; cahz, P < 0.0001) and myeloid (lcp1, P < 0.0001; spi1b, P < 0.0001; cebpa, P < 0.0001) markers in WT cells of C8.nHPSC pLEPs and C5.nHSPC pLMPs. Statistics represent the comparison between C8.nHSPC pLEPs and C5.nHSPC pLMPs for each gene (ordinary one-way ANOVA). f, UMAP cell cycle analysis on nHSPC clusters. g, Quantification of S, G2/M and G1 phase in C3. and C6.nHSPCs. C3.nHSPCs cells are mainly in S phase and G1, while C6. nHSPCs in G2/M (two-tailed Student’s t-test with Bonferroni post-hoc correction). h, Confocal images of IF using anti-RFP, anti-GFP and EdU staining (n = 22 (WT) and 20 (128Δ/Δ) embryos; P = 0.0032) or anti-pH3 (n = 18 (WT) and 24 (128Δ/Δ) embryos; P = 0.0208) in Tg(kdrl:mCherrys896,cmyb:GFPzf169) AGM at 32 hpf. S phase and G2/M nHSPCs are increased (kdrl+, cmyb+, EdU+ or pH3+ blue arrowheads and kdrl+, cmyb+, EdU− or pH3− white arrowheads) in miR-128Δ/Δ (three independent experiments; two-tailed Mann–Whitney test). i, Violin plot of gata1a (P = 0.0004), ikzf1 (P = 0.0006 and 0.0015) and lcp1 (P = 0.4505 and 0.5383) expression in clusters C8.nHPSC pLEPs and C5.nHSPC pLMPs per genotype (Mann–Whitney test). j,k, Model of nHSPC heterogeneity acquired during EHT in the AGM at 26 hpf WT (j) and 128Δ/Δ (k). 128Δ/Δ nHSPC heterogeneity is biased towards S and G2/M nHSPCs (green circles), and erythroid and lymphoid primed nHSPCs (blue circles, bigger size represents increase gene expression but not number). Not signifcant (NS): P > 0.05. **P ≤ 0.01, ***P ≤ 0.001. LP, lymphatic progenitor; ISVs, intersegmental vessels; DA, dorsal aorta; PCV, posterior cardinal vein.
Fig. 2 nHSPC heterogeneity is defined by cell cycle and lineage bias phenotypes and regulated by miR-128. a, UMAP of defined EHT cluster cells from kdr+ ECs in the tail of WT and 128Δ/Δ at 26 hpf. b, UMAP representing efnb2a, gata2b and cmyb expression normalized with Z-score. c, UMAP of gata1a, hmgn2 and lcp1 expression normalized with Z-score, in nHSPC cmyb+ clusters (C3, C6, C8 and C5). d, RNA velocity trajectories in nHSPC clusters showing that C8.nHSPC pLEPs and C5.nHSPC pLMPs are terminal states of C3.nHSPCs and C6.nHSPCs. e, Violin plot of lymphoid (ikzf1, P > 0.9999; hmgb2a, P = 0.0001; hmgn2, P < 0.0001), erythroid (gata1a, P < 0.0001; alas2, P < 0.0001; cahz, P < 0.0001) and myeloid (lcp1, P < 0.0001; spi1b, P < 0.0001; cebpa, P < 0.0001) markers in WT cells of C8.nHPSC pLEPs and C5.nHSPC pLMPs. Statistics represent the comparison between C8.nHSPC pLEPs and C5.nHSPC pLMPs for each gene (ordinary one-way ANOVA). f, UMAP cell cycle analysis on nHSPC clusters. g, Quantification of S, G2/M and G1 phase in C3. and C6.nHSPCs. C3.nHSPCs cells are mainly in S phase and G1, while C6. nHSPCs in G2/M (two-tailed Student’s t-test with Bonferroni post-hoc correction). h, Confocal images of IF using anti-RFP, anti-GFP and EdU staining (n = 22 (WT) and 20 (128Δ/Δ) embryos; P = 0.0032) or anti-pH3 (n = 18 (WT) and 24 (128Δ/Δ) embryos; P = 0.0208) in Tg(kdrl:mCherrys896,cmyb:GFPzf169) AGM at 32 hpf. S phase and G2/M nHSPCs are increased (kdrl+, cmyb+, EdU+ or pH3+ blue arrowheads and kdrl+, cmyb+, EdU− or pH3− white arrowheads) in miR-128Δ/Δ (three independent experiments; two-tailed Mann–Whitney test). i, Violin plot of gata1a (P = 0.0004), ikzf1 (P = 0.0006 and 0.0015) and lcp1 (P = 0.4505 and 0.5383) expression in clusters C8.nHPSC pLEPs and C5.nHSPC pLMPs per genotype (Mann–Whitney test). j,k, Model of nHSPC heterogeneity acquired during EHT in the AGM at 26 hpf WT (j) and 128Δ/Δ (k). 128Δ/Δ nHSPC heterogeneity is biased towards S and G2/M nHSPCs (green circles), and erythroid and lymphoid primed nHSPCs (blue circles, bigger size represents increase gene expression but not number). Not signifcant (NS): P > 0.05. **P ≤ 0.01, ***P ≤ 0.001. LP, lymphatic progenitor; ISVs, intersegmental vessels; DA, dorsal aorta; PCV, posterior cardinal vein.CC BY · PubMed Central
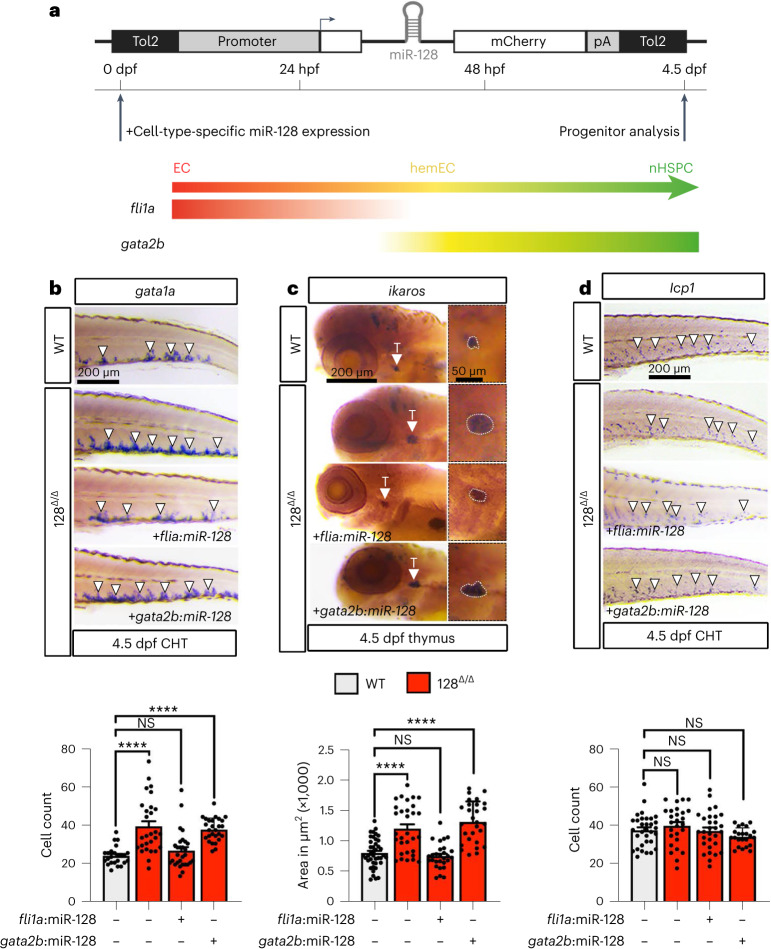
Fig. 3 miR-128 function in ECs to regulate HSPC heterogeneity before EHT. a, Schematic representation of the transgene used to express WT miR-128 gene in zebrafish ECs (via flia1) or hemECs (via gata2b). For gata2b expression, we used the Tg(gata2b:Gal4sd32) line and created the UAS:miR-128 plasmid, while for fli1a expression we created fli1a:miR-128 plasmid. One-cell-state embryo was injected with tol2 mRNA and the indicated plasmids, and WISH was performed against gata1a, ikzf1 and lcp1 at 4.5 dpf, respectively. b–d, WISH of gata1a (n = 27 (WT), 28 (128Δ/Δ), 27 (128Δ/Δ + fli1a), 29 (128Δ/Δ + gata2b) embryos) (b) and ikaros (n = 41 (WT); 31 (128Δ/Δ), 28 (128Δ/Δ + fli1a), 28 (128Δ/Δ + gata2b) embryos) (c) and lcp1 (n = 32 (WT), 27 (128Δ/Δ), 30 (128Δ/Δ + fli1a), 23 (128Δ/Δ + gata2b) embryos) (d) at 4.5 dpf and relative cells quantification as indicated. fli1a endothelial expression of miR-128 WT gene rescues to WT level the increase of erythroid and lymphoid progenitors of miR-128Δ/Δ, while gata2b hemEC expression of miR-128 does not rescue the increase of erythroid and lymphoid progenitors (3 independent experiments, ordinary one-way ANOVA with Tukey’s multiple comparison). All quantifications are represented with mean ± s.e.m. NS, not significant; P > 0.05, ****P ≤ 0.0001.
Fig. 3 miR-128 function in ECs to regulate HSPC heterogeneity before EHT. a, Schematic representation of the transgene used to express WT miR-128 gene in zebrafish ECs (via flia1) or hemECs (via gata2b). For gata2b expression, we used the Tg(gata2b:Gal4sd32) line and created the UAS:miR-128 plasmid, while for fli1a expression we created fli1a:miR-128 plasmid. One-cell-state embryo was injected with tol2 mRNA and the indicated plasmids, and WISH was performed against gata1a, ikzf1 and lcp1 at 4.5 dpf, respectively. b–d, WISH of gata1a (n = 27 (WT), 28 (128Δ/Δ), 27 (128Δ/Δ + fli1a), 29 (128Δ/Δ + gata2b) embryos) (b) and ikaros (n = 41 (WT); 31 (128Δ/Δ), 28 (128Δ/Δ + fli1a), 28 (128Δ/Δ + gata2b) embryos) (c) and lcp1 (n = 32 (WT), 27 (128Δ/Δ), 30 (128Δ/Δ + fli1a), 23 (128Δ/Δ + gata2b) embryos) (d) at 4.5 dpf and relative cells quantification as indicated. fli1a endothelial expression of miR-128 WT gene rescues to WT level the increase of erythroid and lymphoid progenitors of miR-128Δ/Δ, while gata2b hemEC expression of miR-128 does not rescue the increase of erythroid and lymphoid progenitors (3 independent experiments, ordinary one-way ANOVA with Tukey’s multiple comparison). All quantifications are represented with mean ± s.e.m. NS, not significant; P > 0.05, ****P ≤ 0.0001.CC BY · PubMed Central
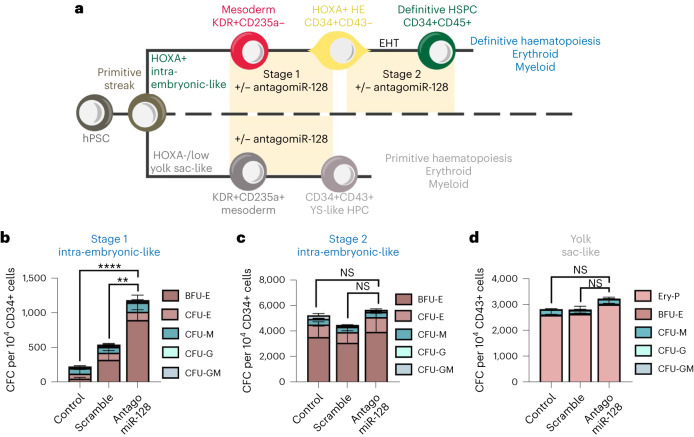
Fig. 4 miR-128 function before EHT is conserved in hPSCs. a, Schematic of HSPC development in vitro using hPSCs and treated as indicated with antagomiR-128 or scramble miR as control at different cell stages. b,c, Colony-forming cell assay quantification of erythroid (BFU-E, CFU-E) and myeloid (CFU-M, CFU-G, CFU-GM) of HOXA+ programme (definitive haematopoiesis) during stage 1 (b) or stage 2 (c). d, Colony-forming cell quantification of erythroid (Ery-P, BFU-E) and myeloid (CFU-M, CFU-G, CFU-GM) of HOXA/low− programme (primitive haematopoiesis) (three independent experiments). All Quantification are represented with mean ± s.e.m. NS, not significant; P > 0.05, **P ≤ 0.01, ****P ≤ 0.0001. HE, haemogenic endothelium; CFC, colony-forming cell; BFU-E, burst-forming units erythroid; CFU-E, colony-forming units of erythroid; CFU-G, colony-forming units of granulocyte; CFU-M, colony-forming units of myeloid; CFU-GM, colony-forming units of mixed granulocyte/myeloid.
Fig. 4 miR-128 function before EHT is conserved in hPSCs. a, Schematic of HSPC development in vitro using hPSCs and treated as indicated with antagomiR-128 or scramble miR as control at different cell stages. b,c, Colony-forming cell assay quantification of erythroid (BFU-E, CFU-E) and myeloid (CFU-M, CFU-G, CFU-GM) of HOXA+ programme (definitive haematopoiesis) during stage 1 (b) or stage 2 (c). d, Colony-forming cell quantification of erythroid (Ery-P, BFU-E) and myeloid (CFU-M, CFU-G, CFU-GM) of HOXA/low− programme (primitive haematopoiesis) (three independent experiments). All Quantification are represented with mean ± s.e.m. NS, not significant; P > 0.05, **P ≤ 0.01, ****P ≤ 0.0001. HE, haemogenic endothelium; CFC, colony-forming cell; BFU-E, burst-forming units erythroid; CFU-E, colony-forming units of erythroid; CFU-G, colony-forming units of granulocyte; CFU-M, colony-forming units of myeloid; CFU-GM, colony-forming units of mixed granulocyte/myeloid.CC BY · PubMed Central
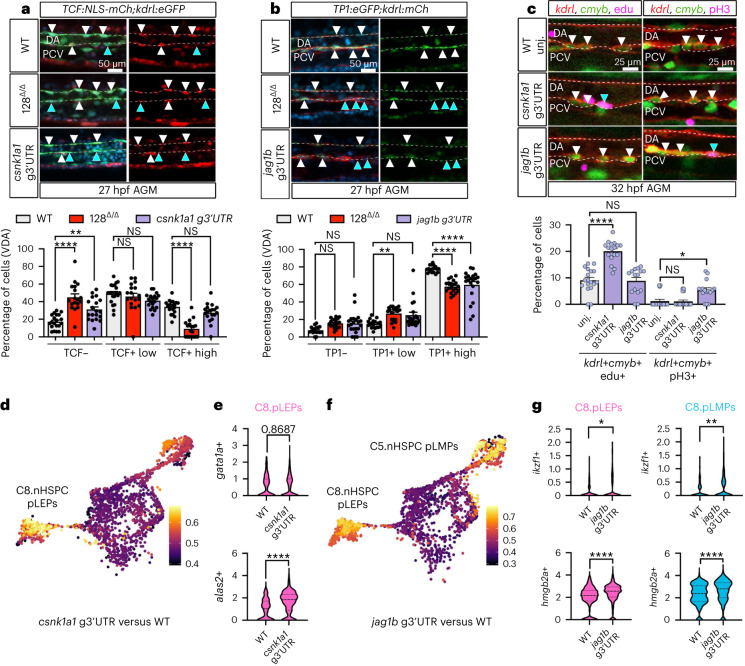
Fig. 5 miR-128 regulation of Notch (via jag1b) and Wnt (via csnk1a1) signalling in the EHT control nHSPC heterogeneity. a,b, Confocal lateral view of IF zebrafish tail at 27 hpf of Tg(TCF:NLS-mCherryia5,kdrl:eGFPzn1) (n = 20 (WT), 18 (128Δ/Δ) and 19 (csnk1a1 g3′UTR) embryos) (a) and Tg(TP1:eGFPum14,kdrl:mCherrys896) (n = 18 (WT), 20 (128Δ/Δ) and 21 (jag1b g3′UTR) embryos) (b), Wnt and Notch reported lines, respectively. Quantification of Wnt and Notch kdrl+ cells based on reporter intensity. Arrowheads represent kdrl+, TCF+ or TP1+ high (white) or low/negative (blue) cells. Cell quantification is reported in the ventral floor of the dorsal aorta (VDA) (three independent experiments; ordinary one-way ANOVA with Tukey’s multiple comparison). c, Confocal images of Tg(kdrl:mCherrys896,cmyb:GFPzf169) WT and g3′UTR mutants AGM at 32 hpf. Replicative nHSPCs are increased (kdrl+, cmyb+, EdU+, blue arrowhead) (n = 19 (WT), 17 (csnk1a1 g3′UTR) and 15 (jag1b g3′UTR) embryos) in the csnk1a1 g3′UTR while unchanged in jag1b g3′UTR. G2/M nHSPCs (kdrl+, cmyb+, pH3+, blue arrowhead) (n = 17 (WT), 19 (csnk1a1 g3′UTR), 16 (jag1b g3′UTR) embryos) are increased in the jag1b g3′UTR while unchanged in csnk1a1 g3′UTR (3 independent experiments; ordinary one-way ANOVA with Tukey’s multiple comparison). d, scRNA-seq analysis of kdrl+ cells experimental perturbation among genotype using MELD (Methods) assessed by the comparison between csnk1a1 g3′UTR versus WT, showing C8 as the most perturbed cluster. e, Violin plot of erythroid markers (gata1a and alas2, P < 0.0001) within C8.nHSPC pLEPs (Mann–Whitney test). f, MELD assessed by the comparison between jag1b g3′UTR versus WT, showing C8 and C5 as the most perturbed clusters (Methods). g, Violin plot of lymphoid markers (ikzf1, P = 0.0315 (C8) and 0.0099 (C5) and hmgb2a, P < 0.0001) within C8.nHSPC pLEPs and C5.nHSPC pLMPs (two-tailed Mann–Whitney test). All quantifications are represented with mean ± s.e.m. NS, not significant; P > 0.05, *P ≤ 0.05, **P ≤ 0.01, ****P ≤ 0.0001. DA, dorsal aorta; PCV, posterior cardinal vein.
Fig. 5 miR-128 regulation of Notch (via jag1b) and Wnt (via csnk1a1) signalling in the EHT control nHSPC heterogeneity. a,b, Confocal lateral view of IF zebrafish tail at 27 hpf of Tg(TCF:NLS-mCherryia5,kdrl:eGFPzn1) (n = 20 (WT), 18 (128Δ/Δ) and 19 (csnk1a1 g3′UTR) embryos) (a) and Tg(TP1:eGFPum14,kdrl:mCherrys896) (n = 18 (WT), 20 (128Δ/Δ) and 21 (jag1b g3′UTR) embryos) (b), Wnt and Notch reported lines, respectively. Quantification of Wnt and Notch kdrl+ cells based on reporter intensity. Arrowheads represent kdrl+, TCF+ or TP1+ high (white) or low/negative (blue) cells. Cell quantification is reported in the ventral floor of the dorsal aorta (VDA) (three independent experiments; ordinary one-way ANOVA with Tukey’s multiple comparison). c, Confocal images of Tg(kdrl:mCherrys896,cmyb:GFPzf169) WT and g3′UTR mutants AGM at 32 hpf. Replicative nHSPCs are increased (kdrl+, cmyb+, EdU+, blue arrowhead) (n = 19 (WT), 17 (csnk1a1 g3′UTR) and 15 (jag1b g3′UTR) embryos) in the csnk1a1 g3′UTR while unchanged in jag1b g3′UTR. G2/M nHSPCs (kdrl+, cmyb+, pH3+, blue arrowhead) (n = 17 (WT), 19 (csnk1a1 g3′UTR), 16 (jag1b g3′UTR) embryos) are increased in the jag1b g3′UTR while unchanged in csnk1a1 g3′UTR (3 independent experiments; ordinary one-way ANOVA with Tukey’s multiple comparison). d, scRNA-seq analysis of kdrl+ cells experimental perturbation among genotype using MELD (Methods) assessed by the comparison between csnk1a1 g3′UTR versus WT, showing C8 as the most perturbed cluster. e, Violin plot of erythroid markers (gata1a and alas2, P < 0.0001) within C8.nHSPC pLEPs (Mann–Whitney test). f, MELD assessed by the comparison between jag1b g3′UTR versus WT, showing C8 and C5 as the most perturbed clusters (Methods). g, Violin plot of lymphoid markers (ikzf1, P = 0.0315 (C8) and 0.0099 (C5) and hmgb2a, P < 0.0001) within C8.nHSPC pLEPs and C5.nHSPC pLMPs (two-tailed Mann–Whitney test). All quantifications are represented with mean ± s.e.m. NS, not significant; P > 0.05, *P ≤ 0.05, **P ≤ 0.01, ****P ≤ 0.0001. DA, dorsal aorta; PCV, posterior cardinal vein.CC BY · PubMed Central
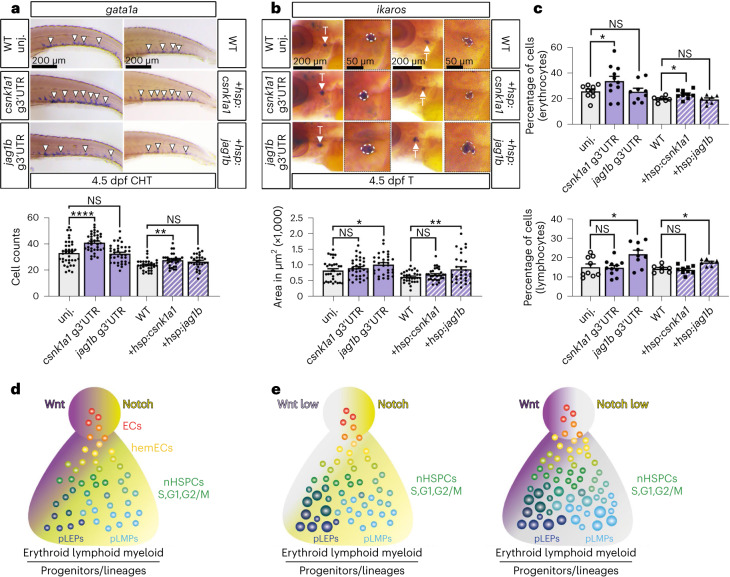
Fig. 6 miR-128 regulation of jag1b and csnk1a1 in the embryonic EHT control long-term blood lineages. a,b, Quantification of erythroid (a) and lymphoid (b) progenitors by WISH against gata1a (n = 37 (WT), 37 (csnk1a1 g3′UTR), 37 (jag1b g3′UTR), 31 (WT), 30 (hsp:csnk1a1) and 28 (hsp:jag1b) embryos) and ikaros (n = 32 (WT), 34 (csnk1a1 g3′UTR), 32 (jag1b g3′UTR), 31 (WT), 31 (hsp:csnk1a1) and 30 (hsp:jag1b) embryos), respectively, at 4.5 dpf CHT or thymus. WT and hsp:csnk1a1 and hsp:jag1b were heat shocked at 24 hpf. csnk1a1 de-repression or transient gain-of-function regulate erythroid progenitor formation, while jag1b manipulations regulate lymphoid progenitors (three independent experiments; ordinary one-way ANOVA with Tukey’s multiple comparison). c, Quantification of blood cell population identified by flow cytometry of ~2-month-old WKM dissected from samples treated as in h and i. Erythrocyte fraction is increased in csnk1a1 g3′UTR and hsp:csnk1a1, while lymphoid cells fraction is increased in jag1b g3′UTR and hsp:jag1b after heat shock at 24 hpf (n = 9 (WT), 11 (csnk1a1 g3′UTR), 9 (jag1b g3′UTR), 7 (WT), 9 (hsp:csnk1a1) and 7 (hsp:jag1b) zebrafish; two-way ANOVA with multiple comparisons). d, Proposed model of nHSPC heterogeneity regulated by miR-128 regulation on Wnt and Notch signalling in vascular endothelia cells before EHT. Vascular signalling, like Wnt (purple) and Notch (yellow), limits the production of a heterogeneous pool of nHSPCs in the AGM. e, Diminishment of Wnt (light grey), like after de-repression or gain of function of csnk1a1 in the EHT, results in an increase of replicative (S), and erythroid-biased nHSPCs in the AGM and relative erythroid progenitors and mature lineages. Diminishment of Notch (light grey), like after de-repression or gain of function of jag1b in the EHT, increases G2/M nHSPCs and lymphoid-biased nHSPCs in the AGM and relative lymphoid progenitors and mature cells. All quantifications are represented with mean ± s.e.m. NS, not significant; P > 0.05, *P ≤ 0.05, **P ≤ 0.01, ****P ≤ 0.0001. T, thymus.
Fig. 6 miR-128 regulation of jag1b and csnk1a1 in the embryonic EHT control long-term blood lineages. a,b, Quantification of erythroid (a) and lymphoid (b) progenitors by WISH against gata1a (n = 37 (WT), 37 (csnk1a1 g3′UTR), 37 (jag1b g3′UTR), 31 (WT), 30 (hsp:csnk1a1) and 28 (hsp:jag1b) embryos) and ikaros (n = 32 (WT), 34 (csnk1a1 g3′UTR), 32 (jag1b g3′UTR), 31 (WT), 31 (hsp:csnk1a1) and 30 (hsp:jag1b) embryos), respectively, at 4.5 dpf CHT or thymus. WT and hsp:csnk1a1 and hsp:jag1b were heat shocked at 24 hpf. csnk1a1 de-repression or transient gain-of-function regulate erythroid progenitor formation, while jag1b manipulations regulate lymphoid progenitors (three independent experiments; ordinary one-way ANOVA with Tukey’s multiple comparison). c, Quantification of blood cell population identified by flow cytometry of ~2-month-old WKM dissected from samples treated as in h and i. Erythrocyte fraction is increased in csnk1a1 g3′UTR and hsp:csnk1a1, while lymphoid cells fraction is increased in jag1b g3′UTR and hsp:jag1b after heat shock at 24 hpf (n = 9 (WT), 11 (csnk1a1 g3′UTR), 9 (jag1b g3′UTR), 7 (WT), 9 (hsp:csnk1a1) and 7 (hsp:jag1b) zebrafish; two-way ANOVA with multiple comparisons). d, Proposed model of nHSPC heterogeneity regulated by miR-128 regulation on Wnt and Notch signalling in vascular endothelia cells before EHT. Vascular signalling, like Wnt (purple) and Notch (yellow), limits the production of a heterogeneous pool of nHSPCs in the AGM. e, Diminishment of Wnt (light grey), like after de-repression or gain of function of csnk1a1 in the EHT, results in an increase of replicative (S), and erythroid-biased nHSPCs in the AGM and relative erythroid progenitors and mature lineages. Diminishment of Notch (light grey), like after de-repression or gain of function of jag1b in the EHT, increases G2/M nHSPCs and lymphoid-biased nHSPCs in the AGM and relative lymphoid progenitors and mature cells. All quantifications are represented with mean ± s.e.m. NS, not significant; P > 0.05, *P ≤ 0.05, **P ≤ 0.01, ****P ≤ 0.0001. T, thymus.CC BY · PubMed Central
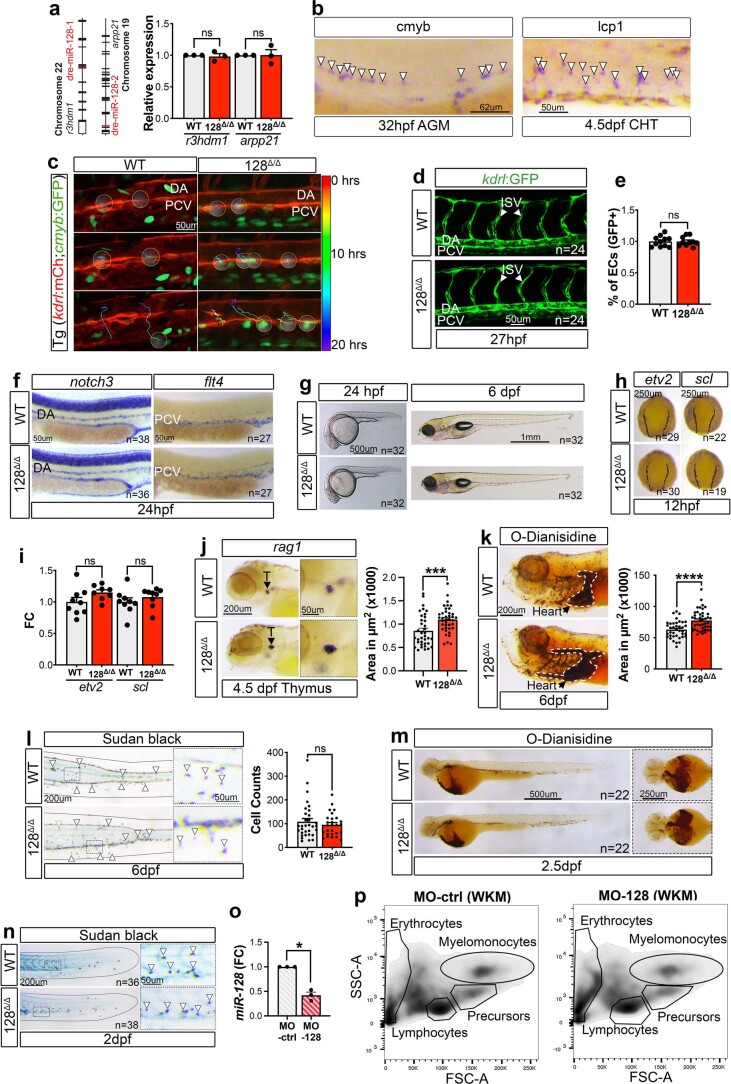
Extended Data Fig. 1 miR-128Δ/Δphenotype in vascular and hematopoietic development. (a) Genomic location of miR-128-1 and miR-128-2 and qRT-PCR analysis of r3hdm1 and arpp21 (3 independent pools of ~10 embryos; Two-tailed Mann-Whitney test). (b) Representative images showing cmyb and lcp1 cells. (c) Time-lapse with dragon-tail analysis of WT and 128Δ/Δ Tg(kdrl:mCherrys896,cmyb:GFPzf169) from ~24 to 50 hpf. The color scale represents the time a cell to delaminate. (d) Confocal imaging of WT and 128Δ/Δ embryos at 27 hpf. (e) Percentage of ECs over total number of cells in WT (n = 11 embryos) and 128Δ/Δ (n = 10 embryos) at 26 hpf by flow cytometry (3 individual experiments, Two-tailed Mann-Whitney test). (f) WISH of WT and 128Δ/Δ with notch3 and flt4. (g) Images of WT and 128Δ/Δ embryos. (h) WISH of etv2 and scl at 12 hpf. (i) qRT-PCR analysis of etv2 and scl (8 to 9 independent pools of ~10 embryos) at 12 hpf (Two-tailed Mann-Whitney test). (j) WISH of rag1+ cells at 4.5 dpf (n = WT, 36, 128Δ/Δ, 39 embryos; p-value = 0.001; 3 independent experiments, Mann-Whitney test). (k) O-dianisidine staining at 6 dpf (n = WT, 38, 128Δ/Δ, 44 embryos; p-value < 0.0001; 3 independent experiments, Mann-Whitney test). (l) Sudan black staining at 6 dpf (n = WT, 32, 128Δ/Δ, 27 embryos; 3 independent experiments, Two-tailed Mann-Whitney test). (m) O-dianisidine staining of WT and 128Δ/Δ at ~2.5 dpf. (n) Sudan black staining of WT and 128Δ/Δ at ~2 dpf. (o) qRT-PCR analysis of miR-128 normalized with U6 (n = MO-ctrl, 3, MO-128; p-value = 0.0224; 3 independent pools of ~10 embryos, Two-tailed one sample t and Wilcoxon test). (p) Flow cytometry population analysis of ~1-month-old dissected whole KM zebrafish injected with MO-control or MO-128. All quantifications are represented with mean ± SEM. ns: p > 0.05, *p ≤ 0.05. Abbreviations: aorta gonad mesonephros (AGM), dorsal aorta (DA), posterior cardinal vein (PCV), caudal hematopoietic tissue (CHT), thymus (T), intersegmental vessel (ISV) and (kidney marrow (KM).
Extended Data Fig. 1 miR-128Δ/Δphenotype in vascular and hematopoietic development. (a) Genomic location of miR-128-1 and miR-128-2 and qRT-PCR analysis of r3hdm1 and arpp21 (3 independent pools of ~10 embryos; Two-tailed Mann-Whitney test). (b) Representative images showing cmyb and lcp1 cells. (c) Time-lapse with dragon-tail analysis of WT and 128Δ/Δ Tg(kdrl:mCherrys896,cmyb:GFPzf169) from ~24 to 50 hpf. The color scale represents the time a cell to delaminate. (d) Confocal imaging of WT and 128Δ/Δ embryos at 27 hpf. (e) Percentage of ECs over total number of cells in WT (n = 11 embryos) and 128Δ/Δ (n = 10 embryos) at 26 hpf by flow cytometry (3 individual experiments, Two-tailed Mann-Whitney test). (f) WISH of WT and 128Δ/Δ with notch3 and flt4. (g) Images of WT and 128Δ/Δ embryos. (h) WISH of etv2 and scl at 12 hpf. (i) qRT-PCR analysis of etv2 and scl (8 to 9 independent pools of ~10 embryos) at 12 hpf (Two-tailed Mann-Whitney test). (j) WISH of rag1+ cells at 4.5 dpf (n = WT, 36, 128Δ/Δ, 39 embryos; p-value = 0.001; 3 independent experiments, Mann-Whitney test). (k) O-dianisidine staining at 6 dpf (n = WT, 38, 128Δ/Δ, 44 embryos; p-value < 0.0001; 3 independent experiments, Mann-Whitney test). (l) Sudan black staining at 6 dpf (n = WT, 32, 128Δ/Δ, 27 embryos; 3 independent experiments, Two-tailed Mann-Whitney test). (m) O-dianisidine staining of WT and 128Δ/Δ at ~2.5 dpf. (n) Sudan black staining of WT and 128Δ/Δ at ~2 dpf. (o) qRT-PCR analysis of miR-128 normalized with U6 (n = MO-ctrl, 3, MO-128; p-value = 0.0224; 3 independent pools of ~10 embryos, Two-tailed one sample t and Wilcoxon test). (p) Flow cytometry population analysis of ~1-month-old dissected whole KM zebrafish injected with MO-control or MO-128. All quantifications are represented with mean ± SEM. ns: p > 0.05, *p ≤ 0.05. Abbreviations: aorta gonad mesonephros (AGM), dorsal aorta (DA), posterior cardinal vein (PCV), caudal hematopoietic tissue (CHT), thymus (T), intersegmental vessel (ISV) and (kidney marrow (KM).CC BY · PubMed Central
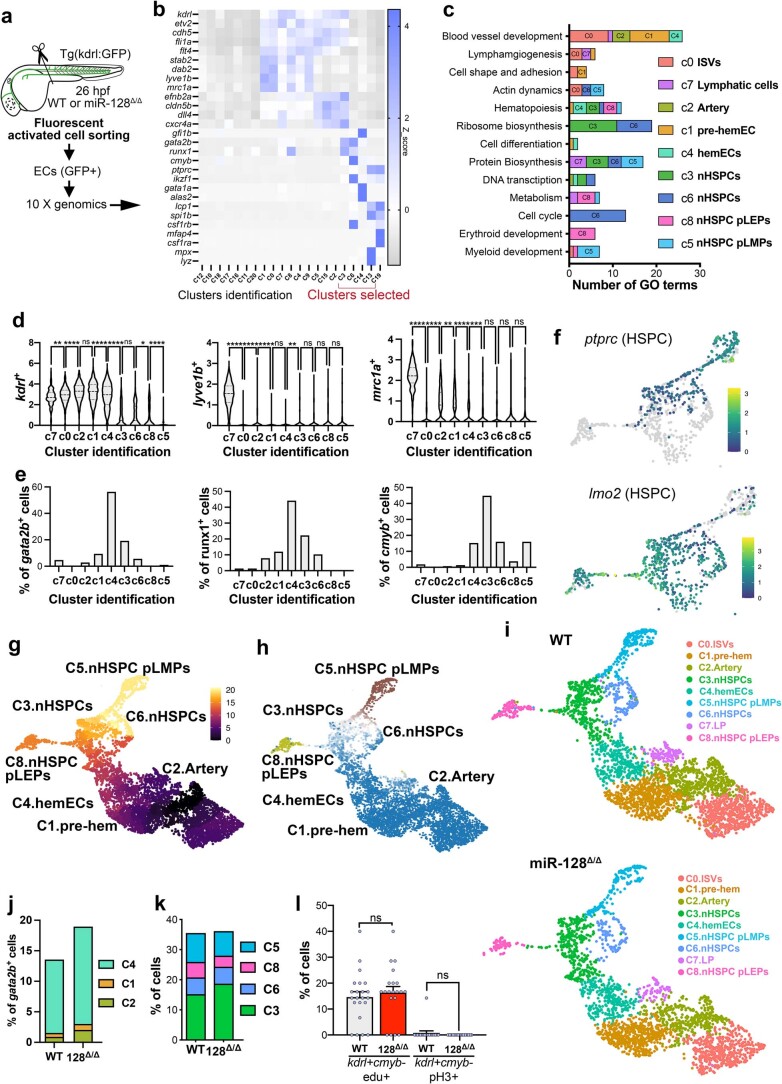
Extended Data Fig. 2 Single cell RNA sequencing analysis of miR-128Δ/ΔEHT. (a) Schematic representation of single cell RNA-sequencing (scRNAseq) strategy of kdrl+ tail endothelial cells (ECs) of WT and miR-128Δ/Δ (128Δ/Δ) at 26 hpf isolated by FACS from Tg(kdrl:GFPzn1). (b) Heatmap showing the average gene expression of canonical vascular, hemogenic, blood stem cells and lineage gene markers in scRNAseq of 22,230 kdrl+ cells (WT + 128Δ/Δ). Clusters selected in red correspond to the ones used for the re-analysis of specific EHT cells. (c) Gene Ontology (GO) analysis of reanalyzed 6096 kdrl + EHT cells. (d) Violin plots of kdrl, lyve1b and mrc1a expression in each cluster of WT cells (ordinary one-way ANOVA with Tukey’s multiple comparison). (e) Percentage of cells expressing gata2b, runx1 and cmyb in each cluster of WT cells. (f) UMAP of nHSPC clusters showing expression of defining HSPC markers, ptprc and lmo2. (g,h) Pseudotime analysis (g) and CellRank analysis (h) showing C8.nHSPC pLEPs and C5.nHSPC pLMPs are both terminal states of EHT cell clusters (Methods). (i) UMAP of WT and 128Δ/Δ of EHT cluster kdrl+ cells with assigned identification. (j) Percentage of cells expressing gata2b in pre-EHT (C2 and C1) and hemEC (C4) clusters in WT and 128Δ/Δ kdrl+ cells. (k) Percentage of cells in nHSPC clusters per genotype, showing the tendency of C3.nHSPCs to increase in 128Δ/Δ compared to WT. (l) Quantification of ECs (kdrl+, cmyb−) edu+ (n = WT, 22; 128Δ/Δ, 20 embryos) or pH3+ (n = WT, 18; 128Δ/Δ, 24 embryos) counted in the same images as Fig. 2h (3 independent experiments, Two-tailed Mann-Whitney test). All Quantification are represented with mean ± SEM. ns: p > 0.05, *p ≤ 0.05, **p ≤ 0.01, *** p ≤ 0.001, **** p ≤ 0.0001. Abbreviations: primed lympho-erythroid progenitors (pLEPs), primed lympho-myeloid progenitors (pLMPs), lymphatic progenitor (LP) and intersegmental vessels (ISV).
Extended Data Fig. 2 Single cell RNA sequencing analysis of miR-128Δ/ΔEHT. (a) Schematic representation of single cell RNA-sequencing (scRNAseq) strategy of kdrl+ tail endothelial cells (ECs) of WT and miR-128Δ/Δ (128Δ/Δ) at 26 hpf isolated by FACS from Tg(kdrl:GFPzn1). (b) Heatmap showing the average gene expression of canonical vascular, hemogenic, blood stem cells and lineage gene markers in scRNAseq of 22,230 kdrl+ cells (WT + 128Δ/Δ). Clusters selected in red correspond to the ones used for the re-analysis of specific EHT cells. (c) Gene Ontology (GO) analysis of reanalyzed 6096 kdrl + EHT cells. (d) Violin plots of kdrl, lyve1b and mrc1a expression in each cluster of WT cells (ordinary one-way ANOVA with Tukey’s multiple comparison). (e) Percentage of cells expressing gata2b, runx1 and cmyb in each cluster of WT cells. (f) UMAP of nHSPC clusters showing expression of defining HSPC markers, ptprc and lmo2. (g,h) Pseudotime analysis (g) and CellRank analysis (h) showing C8.nHSPC pLEPs and C5.nHSPC pLMPs are both terminal states of EHT cell clusters (Methods). (i) UMAP of WT and 128Δ/Δ of EHT cluster kdrl+ cells with assigned identification. (j) Percentage of cells expressing gata2b in pre-EHT (C2 and C1) and hemEC (C4) clusters in WT and 128Δ/Δ kdrl+ cells. (k) Percentage of cells in nHSPC clusters per genotype, showing the tendency of C3.nHSPCs to increase in 128Δ/Δ compared to WT. (l) Quantification of ECs (kdrl+, cmyb−) edu+ (n = WT, 22; 128Δ/Δ, 20 embryos) or pH3+ (n = WT, 18; 128Δ/Δ, 24 embryos) counted in the same images as Fig. 2h (3 independent experiments, Two-tailed Mann-Whitney test). All Quantification are represented with mean ± SEM. ns: p > 0.05, *p ≤ 0.05, **p ≤ 0.01, *** p ≤ 0.001, **** p ≤ 0.0001. Abbreviations: primed lympho-erythroid progenitors (pLEPs), primed lympho-myeloid progenitors (pLMPs), lymphatic progenitor (LP) and intersegmental vessels (ISV).CC BY · PubMed Central
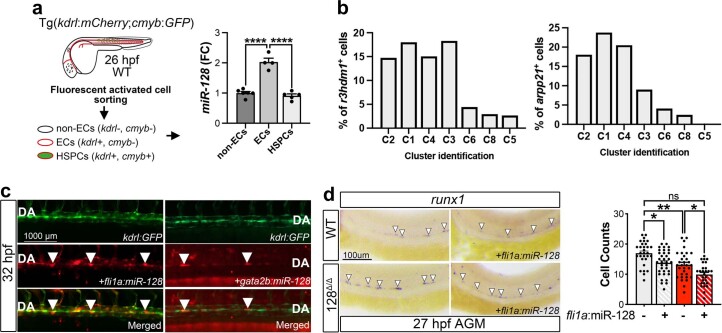
Extended Data Fig. 3 miR-128 regulates nHSPC heterogeneity prior EHT in zebrafish. (a) Schematic representation of FACS isolation of zebrafish cells from 26 hpf Tg(kdrl:mCherrys896;cmyb:GFPzf169) nHSPCs (cmyb+, kdrl+), endothelia cells (ECs) (cmyb-,kdrl+) and non-ECs (cmyb-,kdrl-). RT-qPCR analysis of miR-128 (non-ECs, 5; ECs, 4; HSPCs, 5 independent pools of ~10 embryos) showing mature miR-128 expression enriched in ECs vs HSPCs or non-ECs (ordinary one-way ANOVA with Tukey’s multiple comparison). (b) Percentage of cells in scRNA-seq clusters expressing r3hdm1 and arpp21 in which the intronic miR-128 genes 1 and 2 are hosted, respectively. (c) Confocal images of zebrafish tail at 32 hpf in WT Tg(kdrl:GFPzn1) injected at one cell stage with Tol2 fli1a:miR-128-mCherry and gata2b:gal4 with Tol2 UAS:miR-128-mCherry (labeled as gata2b:miiR-128) (3 independent experiments). mCherry indicates successful miR-128 expression in the respective cells (arrowheads). (d) WISH analysis of runx1 (n = WT, 32; WT + fli1a, 27; 128Δ/Δ, 30; 128Δ/Δ + fli1a, 35; embryos) at 27 hpf with and without Tol2 fli1a:miR-128-mCherry injection at one cell stage (3 independent experiments; ordinary one-way ANOVA with Tukey’s multiple comparison). All quantification are represented with mean ± SEM. ns: p > 0.05, *p ≤ 0.05, **p ≤ 0.01,**** p ≤ 0.0001. Abbreviations: aorta gonad mesonephros (AGM).
Extended Data Fig. 3 miR-128 regulates nHSPC heterogeneity prior EHT in zebrafish. (a) Schematic representation of FACS isolation of zebrafish cells from 26 hpf Tg(kdrl:mCherrys896;cmyb:GFPzf169) nHSPCs (cmyb+, kdrl+), endothelia cells (ECs) (cmyb-,kdrl+) and non-ECs (cmyb-,kdrl-). RT-qPCR analysis of miR-128 (non-ECs, 5; ECs, 4; HSPCs, 5 independent pools of ~10 embryos) showing mature miR-128 expression enriched in ECs vs HSPCs or non-ECs (ordinary one-way ANOVA with Tukey’s multiple comparison). (b) Percentage of cells in scRNA-seq clusters expressing r3hdm1 and arpp21 in which the intronic miR-128 genes 1 and 2 are hosted, respectively. (c) Confocal images of zebrafish tail at 32 hpf in WT Tg(kdrl:GFPzn1) injected at one cell stage with Tol2 fli1a:miR-128-mCherry and gata2b:gal4 with Tol2 UAS:miR-128-mCherry (labeled as gata2b:miiR-128) (3 independent experiments). mCherry indicates successful miR-128 expression in the respective cells (arrowheads). (d) WISH analysis of runx1 (n = WT, 32; WT + fli1a, 27; 128Δ/Δ, 30; 128Δ/Δ + fli1a, 35; embryos) at 27 hpf with and without Tol2 fli1a:miR-128-mCherry injection at one cell stage (3 independent experiments; ordinary one-way ANOVA with Tukey’s multiple comparison). All quantification are represented with mean ± SEM. ns: p > 0.05, *p ≤ 0.05, **p ≤ 0.01,**** p ≤ 0.0001. Abbreviations: aorta gonad mesonephros (AGM).CC BY · PubMed Central
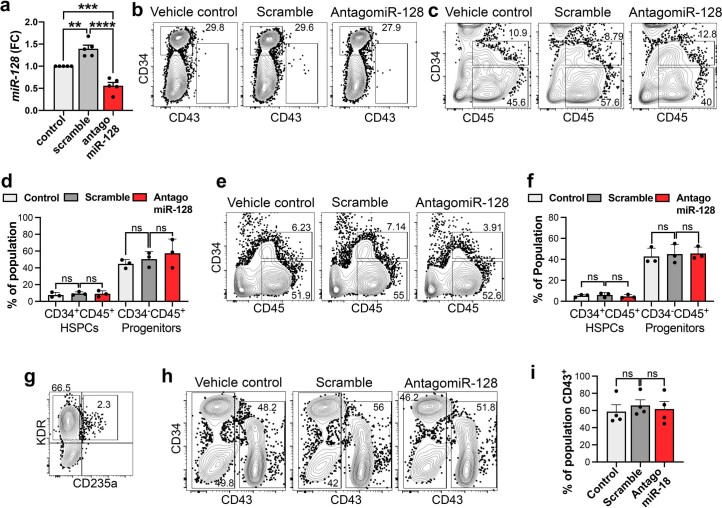
Extended Data Fig. 4 miR-128 regulates nHSPC heterogeneity prior EHT in human pluripotent stem cells. a) qRT-PCR analysis of mature miR-128 in hemogenic endothelial cells from human pluripotent stem cell (hPSC) treated with scramble or antagomiR-128 at stage 1 (n = Control, 5; scramble, 5; antagomir-128, 5 independent experiments; ordinary one-way ANOVA with Tukey’s multiple comparison). (b) Representative flow cytometry analysis of CD34 and CD43 expression during differentiation of cells treated with vehicle control or scramble or antagomir-128 (Stage 1). (c) Representative flow cytometry analysis of cells expressing CD34 and CD45 during differentiation of hPSCs treated with vehicle control or scramble or antagomir-128 (Stage 1). (d) Quantification of cells CD34+CD45+ (HSPCs) (n = Control, 3; scramble, 3; antagomir-128, 3 independent experiments) and CD34–CD45+ (progenitors) (n = Control, 3; scramble, 3; antagomir-128, 3 independent experiments) (Ordinary one-way ANOVA with Tukey’s multiple comparison). (e) Representative flow cytometry analysis of cells expressing CD34 and CD45 during differentiation of hPSCs treated with vehicle control or scramble or antagomir-128 (Stage 2). (f) Quantification of cells CD34+CD45+ (HSPCs) (n = Control, 3; scramble, 3; antagomir-128, 3 independent experiments) and CD34–CD45+ (blood progenitors) (n = Control, 3; scramble, 3; antagomir-128, 3 independent experiments, ordinary one-way ANOVA with Tukey’s multiple comparison). (g) Representative flow cytometry analysis of cells expressing KDR and CD235a during hPSC differentiation. (h) Representative flow cytometry analysis of cells expressing CD34 and CD43 during hPSC differentiation treated with vehicle control or scramble or antagomiR-128. (i) Quantification of CD43+ cells (n = Control, 4; scramble, 4; antagomir-128, 4 independent experiments; ordinary one-way ANOVA with Tukey’s multiple comparison). All quantification are represented with mean ± SEM. ns: p > 0.05, **p ≤ 0.01, *** p ≤ 0.001,**** p ≤ 0.0001. Abbreviations: fold change (FC) and hemogenic endothelium (HE).
Extended Data Fig. 4 miR-128 regulates nHSPC heterogeneity prior EHT in human pluripotent stem cells. a) qRT-PCR analysis of mature miR-128 in hemogenic endothelial cells from human pluripotent stem cell (hPSC) treated with scramble or antagomiR-128 at stage 1 (n = Control, 5; scramble, 5; antagomir-128, 5 independent experiments; ordinary one-way ANOVA with Tukey’s multiple comparison). (b) Representative flow cytometry analysis of CD34 and CD43 expression during differentiation of cells treated with vehicle control or scramble or antagomir-128 (Stage 1). (c) Representative flow cytometry analysis of cells expressing CD34 and CD45 during differentiation of hPSCs treated with vehicle control or scramble or antagomir-128 (Stage 1). (d) Quantification of cells CD34+CD45+ (HSPCs) (n = Control, 3; scramble, 3; antagomir-128, 3 independent experiments) and CD34–CD45+ (progenitors) (n = Control, 3; scramble, 3; antagomir-128, 3 independent experiments) (Ordinary one-way ANOVA with Tukey’s multiple comparison). (e) Representative flow cytometry analysis of cells expressing CD34 and CD45 during differentiation of hPSCs treated with vehicle control or scramble or antagomir-128 (Stage 2). (f) Quantification of cells CD34+CD45+ (HSPCs) (n = Control, 3; scramble, 3; antagomir-128, 3 independent experiments) and CD34–CD45+ (blood progenitors) (n = Control, 3; scramble, 3; antagomir-128, 3 independent experiments, ordinary one-way ANOVA with Tukey’s multiple comparison). (g) Representative flow cytometry analysis of cells expressing KDR and CD235a during hPSC differentiation. (h) Representative flow cytometry analysis of cells expressing CD34 and CD43 during hPSC differentiation treated with vehicle control or scramble or antagomiR-128. (i) Quantification of CD43+ cells (n = Control, 4; scramble, 4; antagomir-128, 4 independent experiments; ordinary one-way ANOVA with Tukey’s multiple comparison). All quantification are represented with mean ± SEM. ns: p > 0.05, **p ≤ 0.01, *** p ≤ 0.001,**** p ≤ 0.0001. Abbreviations: fold change (FC) and hemogenic endothelium (HE).CC BY · PubMed Central
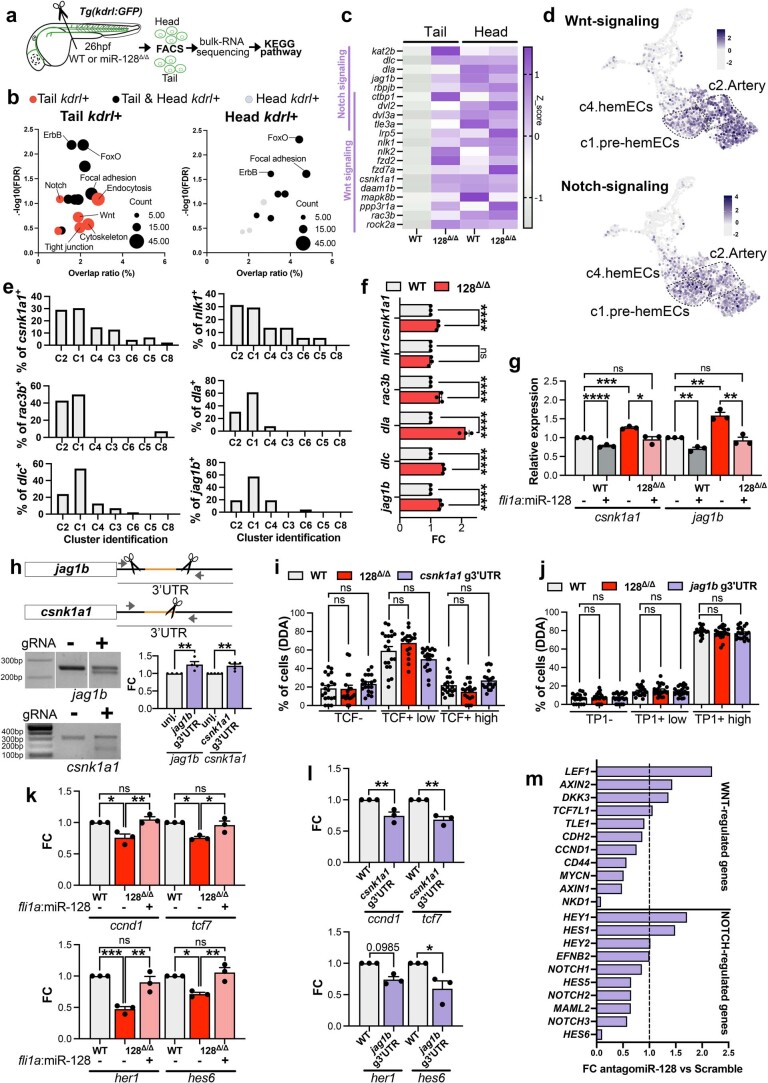
Extended Data Fig. 5 miR-128 targets csnk1a and jag1b prior EHT to regulate Wnt and Notch signaling respectively. (a) Bulk RNA sequencing strategy. (b) KEGG analysis on miR-128 target genes. (c) Heatmap of bulk RNA sequencing in WT and 128Δ/Δ. (d) UMAP of Wnt- and Notch-signaling signature in WT cells. (e) Percentage of cells expressing csnk1a1, nlk1, rac3b, dla, dlc and jag1b in scRNA-seq WT EHT clusters. (f) qRT-PCR at 26 hpf (n = 3 independent experiments for all genes and conditions, two-way ANOVA). (g) qRT-PCR of csnk1a1 and jag1b at 26 hpf (3 independent pools of ~10 embryos, Ordinary one-way ANOVA with Tukey’s multiple comparison). (h) CRISPR/Cas9 design in miR-128 binding site (orange). Agarose gel of csnk1a1 and jag1b 3′UTR region. qRT-PCR of csnk1a1 and jag1b at 24 hpf (jag1b expression, n = WT, 3; jag1b g3′UTR, 3; csnk1a1 expression; WT, 4; csnk1a1 g3′UTR, 4 independent pools of ~5 embryos; Two-tailed Mann-Whitney test). (i,j) (i) Tg(TCF:NLS-mCherryia5,kdrl:eGFPzn1) (n = WT, 20; 128Δ/Δ, 18; csnk1a1 g3′UTR, 19 embryos) and (j) Tg(TP1:eGFPum14,kdrl:mCherrys896) (n = WT, 18; 128Δ/Δ, 20; jag1b g3′UTR, 21 embryos; 3 independent experiments; ordinary one-way ANOVA with Tukey’s multiple comparison). (k) qRT-PCR analysis of Wnt (ccnd1 and tcf7) or Notch (her1 and hes6) responsive genes in 24hpf WT and 128Δ/Δ (For all conditions, n = 3 independent pools of ~10 embryos for all genes; ordinary one-way ANOVA). (l) qRT-PCR analysis of Wnt (ccnd1 and tcf7) or Notch (her1 and hes6) responsive genes in 24 hpf WT, csnk1a1 g3′UTR and jag1b g3′UTR (For all conditions, n = 3 independent pools of ~10 embryos for all genes; ordinary one-way ANOVA). (m) Bar graph representing WNT- and NOTCH-regulated genes by bulk RNA-sequencing of HOXA + CD34 + CD43- cells following scramble or antagomiR-128 treatment during stage 1. All quantification are represented with mean ± SEM. ns: p > 0.05, *p ≤ 0.05, **p ≤ 0.01, *** p ≤ 0.001, **** p ≤ 0.0001. Abbreviations: T7 endonuclease (T7EI), KEGG (Kyoto Encyclopedia of Genes and Genomes).
Extended Data Fig. 5 miR-128 targets csnk1a and jag1b prior EHT to regulate Wnt and Notch signaling respectively. (a) Bulk RNA sequencing strategy. (b) KEGG analysis on miR-128 target genes. (c) Heatmap of bulk RNA sequencing in WT and 128Δ/Δ. (d) UMAP of Wnt- and Notch-signaling signature in WT cells. (e) Percentage of cells expressing csnk1a1, nlk1, rac3b, dla, dlc and jag1b in scRNA-seq WT EHT clusters. (f) qRT-PCR at 26 hpf (n = 3 independent experiments for all genes and conditions, two-way ANOVA). (g) qRT-PCR of csnk1a1 and jag1b at 26 hpf (3 independent pools of ~10 embryos, Ordinary one-way ANOVA with Tukey’s multiple comparison). (h) CRISPR/Cas9 design in miR-128 binding site (orange). Agarose gel of csnk1a1 and jag1b 3′UTR region. qRT-PCR of csnk1a1 and jag1b at 24 hpf (jag1b expression, n = WT, 3; jag1b g3′UTR, 3; csnk1a1 expression; WT, 4; csnk1a1 g3′UTR, 4 independent pools of ~5 embryos; Two-tailed Mann-Whitney test). (i,j) (i) Tg(TCF:NLS-mCherryia5,kdrl:eGFPzn1) (n = WT, 20; 128Δ/Δ, 18; csnk1a1 g3′UTR, 19 embryos) and (j) Tg(TP1:eGFPum14,kdrl:mCherrys896) (n = WT, 18; 128Δ/Δ, 20; jag1b g3′UTR, 21 embryos; 3 independent experiments; ordinary one-way ANOVA with Tukey’s multiple comparison). (k) qRT-PCR analysis of Wnt (ccnd1 and tcf7) or Notch (her1 and hes6) responsive genes in 24hpf WT and 128Δ/Δ (For all conditions, n = 3 independent pools of ~10 embryos for all genes; ordinary one-way ANOVA). (l) qRT-PCR analysis of Wnt (ccnd1 and tcf7) or Notch (her1 and hes6) responsive genes in 24 hpf WT, csnk1a1 g3′UTR and jag1b g3′UTR (For all conditions, n = 3 independent pools of ~10 embryos for all genes; ordinary one-way ANOVA). (m) Bar graph representing WNT- and NOTCH-regulated genes by bulk RNA-sequencing of HOXA + CD34 + CD43- cells following scramble or antagomiR-128 treatment during stage 1. All quantification are represented with mean ± SEM. ns: p > 0.05, *p ≤ 0.05, **p ≤ 0.01, *** p ≤ 0.001, **** p ≤ 0.0001. Abbreviations: T7 endonuclease (T7EI), KEGG (Kyoto Encyclopedia of Genes and Genomes).CC BY · PubMed Central
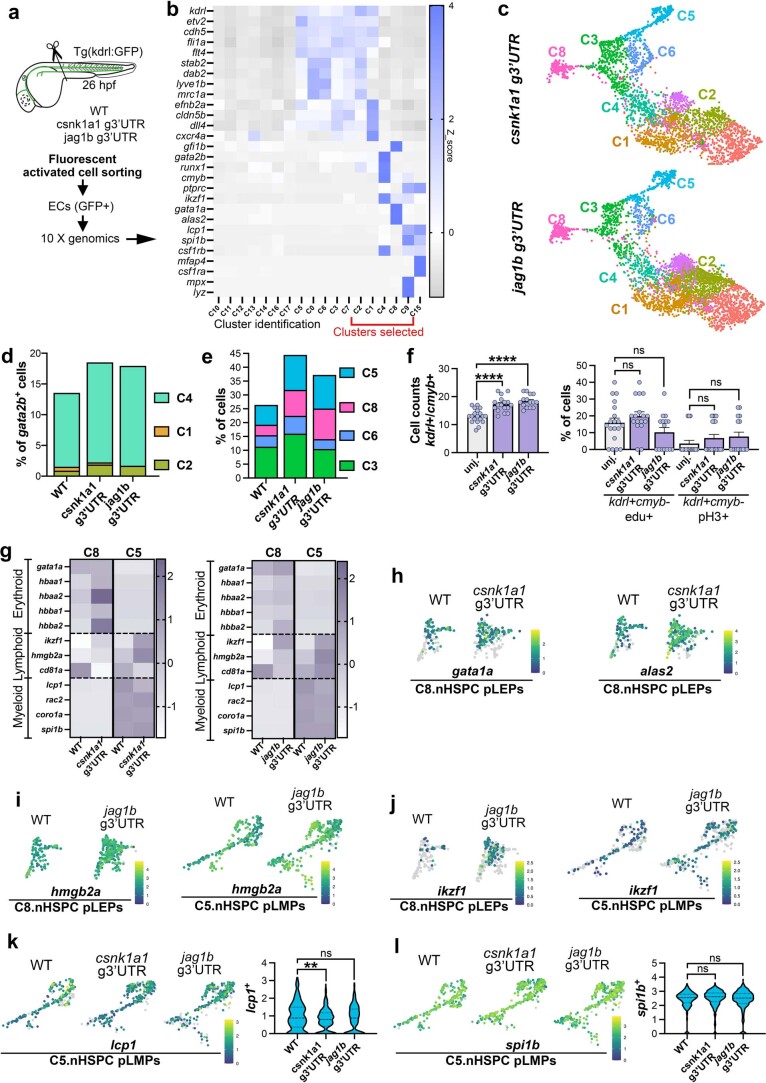
Extended Data Fig. 6 miR-128 regulation of csnk1a1 and jag1b differentially guide nHSPC heterogeneity. (a) scRNA seq strategy of WT, csnk1a1 and jag1b g3′UTR Tg(kdrl:GFPzn1). (b) Heatmap of defining markers (20,600 kdrl+ cells). (c) UMAP of 5597 kdrl+ cells part of the clusters reanalyzed from EHT clusters in b. (d) Percentage of gata2b+ cells in pre-EHT clusters (C2, C1 and C4). (e) Percentage of cells in nHSPC clusters in all genotypes. (f) Quantification of nHSPCs (cmyb+, kdrl+) (n = WT, 19, csnk1a1 g3′UTR, 17; jag1b g3′UTR, 16 embryos) at 32 hpf WT, csnk1a1 and jag1b g3′UTR mutants shown as Fig. 5c (3 independent experiments; ordinary one-way ANOVA). Percentage of ECs (kdrl+,cmyb-) in S phase (edu+) (n = WT, 19, csnk1a1 g3′UTR, 17; jag1b g3′UTR, 15 embryos) and G2/M (pH3+) (n = WT, 17, csnk1a1 g3′UTR, 19; jag1b g3′UTR, 16 embryos) at 32hpf as shown in Fig. 4c (3 independent experiments; ordinary one-way ANOVA with Tukey’s multiple comparison). (g) Heatmap of erythroid (gata1a, hbaa1, hbaa2, hbba1 and hbba2), lymphoid (ikzf1, hmgb2a and cd81a) and myeloid (lcp1, rac2, coro1a and spi1b) defining markers in C8 and C5 WT, csnk1a1 and jag1b g3′UTR mutants. (h-j) UMAP showing expression of erythroid markers (gata1a and alas2) (h) within C8.nHSPC pLEPs and lymphoid markers (hmgb2a (i) and ikzf1 (j)) within C8.nHSPC pLEPs and C5.nHSPC pLMPs. (k,l) UMAP and violin plot showing expression of myeloid marker lcp1 (k) and spi1b (l) in C8.nHSPC pLEPs and C5.nHSPC pLMPs (Mann-Whitney test). Erythroid markers are enriched in C8 of csnk1a1 g3′UTR, lymphoid markers are enriched in both C8 and C5 of jag1b g3′UTR, while myeloid markers are unchanged in both g3′UTR mutants. All quantification are represented with mean ± SEM. ns: p > 0.05, **p ≤ 0.01, **** p ≤ 0.0001. Abbreviations: primed lympho-erythroid progenitors (pLEPs) and primed lympho-myeloid progenitors (pLMPs).
Extended Data Fig. 6 miR-128 regulation of csnk1a1 and jag1b differentially guide nHSPC heterogeneity. (a) scRNA seq strategy of WT, csnk1a1 and jag1b g3′UTR Tg(kdrl:GFPzn1). (b) Heatmap of defining markers (20,600 kdrl+ cells). (c) UMAP of 5597 kdrl+ cells part of the clusters reanalyzed from EHT clusters in b. (d) Percentage of gata2b+ cells in pre-EHT clusters (C2, C1 and C4). (e) Percentage of cells in nHSPC clusters in all genotypes. (f) Quantification of nHSPCs (cmyb+, kdrl+) (n = WT, 19, csnk1a1 g3′UTR, 17; jag1b g3′UTR, 16 embryos) at 32 hpf WT, csnk1a1 and jag1b g3′UTR mutants shown as Fig. 5c (3 independent experiments; ordinary one-way ANOVA). Percentage of ECs (kdrl+,cmyb-) in S phase (edu+) (n = WT, 19, csnk1a1 g3′UTR, 17; jag1b g3′UTR, 15 embryos) and G2/M (pH3+) (n = WT, 17, csnk1a1 g3′UTR, 19; jag1b g3′UTR, 16 embryos) at 32hpf as shown in Fig. 4c (3 independent experiments; ordinary one-way ANOVA with Tukey’s multiple comparison). (g) Heatmap of erythroid (gata1a, hbaa1, hbaa2, hbba1 and hbba2), lymphoid (ikzf1, hmgb2a and cd81a) and myeloid (lcp1, rac2, coro1a and spi1b) defining markers in C8 and C5 WT, csnk1a1 and jag1b g3′UTR mutants. (h-j) UMAP showing expression of erythroid markers (gata1a and alas2) (h) within C8.nHSPC pLEPs and lymphoid markers (hmgb2a (i) and ikzf1 (j)) within C8.nHSPC pLEPs and C5.nHSPC pLMPs. (k,l) UMAP and violin plot showing expression of myeloid marker lcp1 (k) and spi1b (l) in C8.nHSPC pLEPs and C5.nHSPC pLMPs (Mann-Whitney test). Erythroid markers are enriched in C8 of csnk1a1 g3′UTR, lymphoid markers are enriched in both C8 and C5 of jag1b g3′UTR, while myeloid markers are unchanged in both g3′UTR mutants. All quantification are represented with mean ± SEM. ns: p > 0.05, **p ≤ 0.01, **** p ≤ 0.0001. Abbreviations: primed lympho-erythroid progenitors (pLEPs) and primed lympho-myeloid progenitors (pLMPs).CC BY · PubMed Central
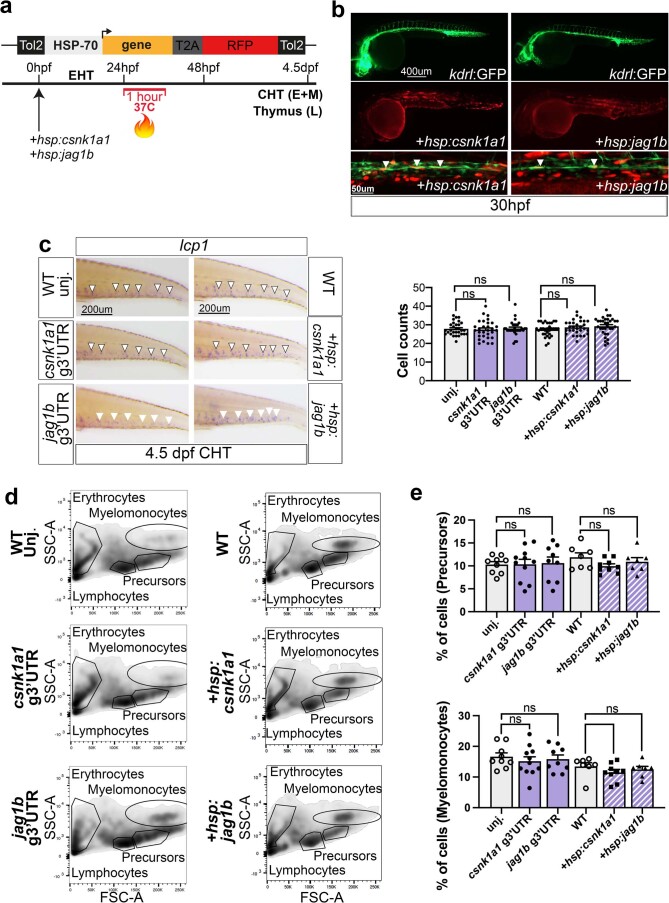
Extended Data Fig. 7 miR-128 regulation of csnk1a1 and jag1b differentially drive erythroid and lymphoid blood lineages. (a) Schematic representation of heat-shock strategy to temporally and transiently express csnk1a1 or jag1b in EHT (24-30hpf). WT Tg(kdrl:GFPzn1) embryos were injected at one cell state with transposase and Tol2 hsp:jag1b-T2A-RFP or Tol2 hsp:csnk1a-T2A-RFP. Heat-shock (Methods) were performed at 24 hpf and blood progenitors analyzed on RFP+ embryos at 4.5 dpf. (b) Fluorescence stereoscope and confocal representative images of embryos treated as in a, at 30hpf (3 independent experiments). (c) Quantification of the myeloid progenitors by lcp1 WISH (n = WT, 30; csnk1a1 g3′UTR, 30; jag1b g3′UTR, 30; WT, 31; hsp:csnk1a1, 30; hsp:jag1b, 32 embryos) at 4.5dpf of WT (3 independent experiments; ordinary one-way ANOVA). (d) Flow cytometry population analysis defined by SSC-A and FSC-A of ~2-month-old dissected whole KM WT, csnk1a1, jag1b g3′UTR mutants and WT, hsp:csnk1a1 and hsp:jag1b after heat-shock at 24-30 hpf. (e) Quantification of adult blood cell population in (d) and Fig. 4j. Immature precursors and myelomonocytes are unchanged in any condition compared to their respective controls (n = WT, 9; csnk1a1 g3′UTR, 11; jag1b g3′UTR, 9; WT, 7; hsp:csnk1a1, 9; hsp:jag1b, 7 embryos; two-way ANOVA with Tukey’s multiple comparisons). All quantification are represented with mean ± SEM. ns: p > 0.05. Abbreviations: CHT: Caudal hematopoietic tissue, FSC: Forward scatter and SSC: side scatter.
Extended Data Fig. 7 miR-128 regulation of csnk1a1 and jag1b differentially drive erythroid and lymphoid blood lineages. (a) Schematic representation of heat-shock strategy to temporally and transiently express csnk1a1 or jag1b in EHT (24-30hpf). WT Tg(kdrl:GFPzn1) embryos were injected at one cell state with transposase and Tol2 hsp:jag1b-T2A-RFP or Tol2 hsp:csnk1a-T2A-RFP. Heat-shock (Methods) were performed at 24 hpf and blood progenitors analyzed on RFP+ embryos at 4.5 dpf. (b) Fluorescence stereoscope and confocal representative images of embryos treated as in a, at 30hpf (3 independent experiments). (c) Quantification of the myeloid progenitors by lcp1 WISH (n = WT, 30; csnk1a1 g3′UTR, 30; jag1b g3′UTR, 30; WT, 31; hsp:csnk1a1, 30; hsp:jag1b, 32 embryos) at 4.5dpf of WT (3 independent experiments; ordinary one-way ANOVA). (d) Flow cytometry population analysis defined by SSC-A and FSC-A of ~2-month-old dissected whole KM WT, csnk1a1, jag1b g3′UTR mutants and WT, hsp:csnk1a1 and hsp:jag1b after heat-shock at 24-30 hpf. (e) Quantification of adult blood cell population in (d) and Fig. 4j. Immature precursors and myelomonocytes are unchanged in any condition compared to their respective controls (n = WT, 9; csnk1a1 g3′UTR, 11; jag1b g3′UTR, 9; WT, 7; hsp:csnk1a1, 9; hsp:jag1b, 7 embryos; two-way ANOVA with Tukey’s multiple comparisons). All quantification are represented with mean ± SEM. ns: p > 0.05. Abbreviations: CHT: Caudal hematopoietic tissue, FSC: Forward scatter and SSC: side scatter.CC BY · PubMed Central

Verification

Claims the paper makes

The claims and statistics of this paper haven’t been checked yet.

Run the check — free, no account needed. It reads the open-access text and checks the sources it cites.

A few free checks a day · papers already verified open instantly · results are public

Claims other papers make about this one

Each is checked against this paper’s own text: does it say what the citing paper says it does?

Self-check

Percentages, sums and reported differences re-computed from the paper’s own numbers.

The self-check needs the paper’s full text.

Citations

Cites

Research works printed but not linked: 99

  1. Zhang, Y., Gao, S., Xia, J. & Liu, F. Hematopoietic hierarchy—an updated roadmap. Trends Cell Biol. 28, 976–986 (2018). · DOI
  2. Tian, Y. et al. The first wave of T lymphopoiesis in zebrafish arises from aorta endothelium independent of hematopoietic stem cells. J. Exp. Med. 214, 3347–3360 (2017). · DOI
  3. Rodriguez-Fraticelli, A. E. et al. Single-cell lineage tracing unveils a role for TCF15 in haematopoiesis. Nature 583, 585–589 (2020). · DOI
  4. Patel, S. H. et al. Lifelong multilineage contribution by embryonic-born blood progenitors. Nature 606, 747–753 (2022). · DOI
  5. Henninger, J. et al. Clonal fate mapping quantifies the number of haematopoietic stem cells that arise during development. Nat. Cell Biol. 19, 17–27 (2017). · DOI
  6. Tak, T. et al. HSPCs display within-family homogeneity in differentiation and proliferation despite population heterogeneity. eLife 10, e60624 (2021). · DOI
  7. Mende, N. et al. CCND1-CDK4-mediated cell cycle progression provides a competitive advantage for human hematopoietic stem cells in vivo. J. Exp. Med. 212, 1171–1183 (2015). · DOI
  8. Laurenti, E. et al. CDK6 levels regulate quiescence exit in human hematopoietic stem cells. Cell Stem Cell 16, 302–313 (2015). · DOI
  9. Grinenko, T. et al. Hematopoietic stem cells can differentiate into restricted myeloid progenitors before cell division in mice. Nat. Commun. 9, 1898 (2018). · DOI
  10. Haas, S., Trumpp, A. & Milsom, M. D. Causes and consequences of hematopoietic stem cell heterogeneity. Cell Stem Cell 22, 627–638 (2018). · DOI
  11. Velten, L. et al. Human haematopoietic stem cell lineage commitment is a continuous process. Nat. Cell Biol. 19, 271–281 (2017). · DOI · Paper page
  12. Rowe, R. G., Mandelbaum, J., Zon, L. I. & Daley, G. Q. Engineering hematopoietic stem cells: lessons from development. Cell Stem Cell 18, 707–720 (2016). · DOI
  13. Epah, J. & Schafer, R. Implications of hematopoietic stem cells heterogeneity for gene therapies. Gene Ther. 28, 528–541 (2021). · DOI
  14. Ulloa, B. A. et al. Definitive hematopoietic stem cells minimally contribute to embryonic hematopoiesis. Cell Rep. 36, 109703 (2021). · DOI
  15. Xia, J. et al. Activation of lineage competence in hemogenic endothelium precedes the formation of hematopoietic stem cell heterogeneity. Cell Res. 33, 448–463 (2023). · DOI
  16. Vink, C. S. et al. Iterative single-cell analyses define the transcriptome of the first functional hematopoietic stem cells. Cell Rep. 31, 107627 (2020). · DOI
  17. Zhou, F. et al. Tracing haematopoietic stem cell formation at single-cell resolution. Nature 533, 487–492 (2016). · DOI
  18. Kasper, D. M. et al. The N-glycome regulates the endothelial-to-hematopoietic transition. Science 370, 1186–1191 (2020). · DOI
  19. Zhu, Q. et al. Developmental trajectory of prehematopoietic stem cell formation from endothelium. Blood 136, 845–856 (2020). · DOI
  20. Kasper, D. M. et al. MicroRNAs Establish uniform traits during the architecture of vertebrate embryos. Dev. Cell 40, 552–565 e555 (2017). · DOI
  21. Narayanan, A. et al. In vivo mutagenesis of miRNA gene families using a scalable multiplexed CRISPR/Cas9 nuclease system. Sci. Rep. 6, 32386 (2016). · DOI
  22. Yang, Y. et al. MiR-128-2 inhibits common lymphoid progenitors from developing into progenitor B cells. Oncotarget 7, 17520–17531 (2016). · DOI
  23. De Luca, L. et al. Knockdown of miR-128a induces Lin28a expression and reverts myeloid differentiation blockage in acute myeloid leukemia. Cell Death Dis. 8, e2849 (2017). · DOI
  24. Malouf, C. et al. miR-130b and miR-128a are essential lineage-specific codrivers of t(4;11) MLL-AF4 acute leukemia. Blood 138, 2066–2092 (2021). · DOI
  25. Tamplin, O. J. et al. Hematopoietic stem cell arrival triggers dynamic remodeling of the perivascular niche. Cell 160, 241–252 (2015). · DOI
  26. Belele, C. L. et al. Differential requirement for Gata1 DNA binding and transactivation between primitive and definitive stages of hematopoiesis in zebrafish. Blood 114, 5162–5172 (2009). · DOI
  27. Willett, C. E., Kawasaki, H., Amemiya, C. T., Lin, S. & Steiner, L. A. Ikaros expression as a marker for lymphoid progenitors during zebrafish development. Dev. Dyn. 222, 694–698 (2001). · DOI
  28. Qian, F. et al. Distinct functions for different scl isoforms in zebrafish primitive and definitive hematopoiesis. PLoS Biol. 5, e132 (2007). · DOI
  29. Willett, C. E., Zapata, A. G., Hopkins, N. & Steiner, L. A. Expression of zebrafish rag genes during early development identifies the thymus. Dev. Biol. 182, 331–341 (1997). · DOI
  30. Galloway, J. L., Wingert, R. A., Thisse, C., Thisse, B. & Zon, L. I. Loss of gata1 but not gata2 converts erythropoiesis to myelopoiesis in zebrafish embryos. Dev. Cell 8, 109–116 (2005). · DOI · Paper page
  31. Le Guyader, D. et al. Origins and unconventional behavior of neutrophils in developing zebrafish. Blood 111, 132–141 (2008). · DOI
  32. Hatta, K., Tsujii, H. & Omura, T. Cell tracking using a photoconvertible fluorescent protein. Nat. Protoc. 1, 960–967 (2006). · DOI
  33. Cao, J. et al. The single-cell transcriptional landscape of mammalian organogenesis. Nature 566, 496–502 (2019). · DOI · Paper page
  34. Lange, M. et al. CellRank for directed single-cell fate mapping. Nat. Methods 19, 159–170 (2022). · DOI
  35. Lawson, N. D. & Weinstein, B. M. In vivo imaging of embryonic vascular development using transgenic zebrafish. Dev. Biol. 248, 307–318 (2002). · DOI
  36. Butko, E. et al. Gata2b is a restricted early regulator of hemogenic endothelium in the zebrafish embryo. Development 142, 1050–1061 (2015). · DOI
  37. Ng, E. S. et al. Differentiation of human embryonic stem cells to HOXA+ hemogenic vasculature that resembles the aorta–gonad–mesonephros. Nat. Biotechnol. 34, 1168–1179 (2016). · DOI
  38. Dege, C. et al. Potently cytotoxic natural killer cells initially emerge from erythro-myeloid progenitors during mammalian development. Dev. Cell 53, 229–239 e227 (2020). · DOI
  39. Kennedy, M. et al. T lymphocyte potential marks the emergence of definitive hematopoietic progenitors in human pluripotent stem cell differentiation cultures. Cell Rep. 2, 1722–1735 (2012). · DOI
  40. Sturgeon, C. M., Ditadi, A., Awong, G., Kennedy, M. & Keller, G. Wnt signaling controls the specification of definitive and primitive hematopoiesis from human pluripotent stem cells. Nat. Biotechnol. 32, 554–561 (2014). · DOI · Paper page
  41. Ditadi, A. et al. Human definitive haemogenic endothelium and arterial vascular endothelium represent distinct lineages. Nat. Cell Biol. 17, 580–591 (2015). · DOI
  42. Krutzfeldt, J. et al. Silencing of microRNAs in vivo with ‘antagomirs’. Nature 438, 685–689 (2005). · DOI · Paper page
  43. Grainger, S. et al. Wnt9a is required for the aortic amplification of nascent hematopoietic stem cells. Cell Rep. 17, 1595–1606 (2016). · DOI
  44. Bray, S. J. Notch signalling in context. Nat. Rev. Mol. Cell Biol. 17, 722–735 (2016). · DOI · Paper page
  45. Uenishi, G. I. et al. NOTCH signaling specifies arterial-type definitive hemogenic endothelium from human pluripotent stem cells. Nat. Commun. 9, 1828 (2018). · DOI
  46. Carreras Puigvert, J. et al. Systems biology approach identifies the kinase Csnk1a1 as a regulator of the DNA damage response in embryonic stem cells. Sci. Signal 6, ra5 (2013). · DOI
  47. Robert-Moreno, A. et al. Impaired embryonic haematopoiesis yet normal arterial development in the absence of the Notch ligand Jagged1. EMBO J. 27, 1886–1895 (2008). · DOI
  48. Gama-Norton, L. et al. Corrigendum: Notch signal strength controls cell fate in the haemogenic endothelium. Nat. Commun. 7, 10978 (2016). · DOI
  49. Gama-Norton, L. et al. Notch signal strength controls cell fate in the haemogenic endothelium. Nat. Commun. 6, 8510 (2015). · DOI
  50. Benedito, R. et al. The notch ligands Dll4 and Jagged1 have opposing effects on angiogenesis. Cell 137, 1124–1135 (2009). · DOI
  51. Ceredig, R., Rolink, A. G. & Brown, G. Models of haematopoiesis: seeing the wood for the trees. Nat. Rev. Immunol. 9, 293–300 (2009). · DOI
  52. Morrison, S. J., Uchida, N. & Weissman, I. L. The biology of hematopoietic stem cells. Annu. Rev. Cell Dev. Biol. 11, 35–71 (1995). · DOI
  53. Buenrostro, J. D. et al. Integrated single-cell analysis maps the continuous regulatory landscape of human hematopoietic differentiation. Cell 173, 1535–1548 e1516 (2018). · DOI · Paper page
  54. Hirschi, K. K., Nicoli, S. & Walsh, K. Hematopoiesis lineage tree uprooted: every cell is a rainbow. Dev. Cell 41, 7–9 (2017). · DOI
  55. Tang, Q. et al. Dissecting hematopoietic and renal cell heterogeneity in adult zebrafish at single-cell resolution using RNA sequencing. J. Exp. Med. 214, 2875–2887 (2017). · DOI
  56. Sun, J. et al. Clonal dynamics of native haematopoiesis. Nature 514, 322–327 (2014). · DOI
  57. Sieburg, H. B. et al. The hematopoietic stem compartment consists of a limited number of discrete stem cell subsets. Blood 107, 2311–2316 (2006). · DOI
  58. Muller-Sieburg, C. E., Cho, R. H., Thoman, M., Adkins, B. & Sieburg, H. B. Deterministic regulation of hematopoietic stem cell self-renewal and differentiation. Blood 100, 1302–1309 (2002). · DOI
  59. Muller-Sieburg, C. E., Cho, R. H., Karlsson, L., Huang, J. F. & Sieburg, H. B. Myeloid-biased hematopoietic stem cells have extensive self-renewal capacity but generate diminished lymphoid progeny with impaired IL-7 responsiveness. Blood 103, 4111–4118 (2004). · DOI
  60. Crisan, M. & Dzierzak, E. The many faces of hematopoietic stem cell heterogeneity. Development 143, 4571–4581 (2016). · DOI
  61. Ema, H., Morita, Y. & Suda, T. Heterogeneity and hierarchy of hematopoietic stem cells. Exp. Hematol. 42, 74–82 e72 (2014). · DOI
  62. Jurecic, R. Hematopoietic stem cell heterogeneity. Adv. Exp. Med Biol. 1169, 195–211 (2019). · DOI
  63. Dignum, T. et al. Multipotent progenitors and hematopoietic stem cells arise independently from hemogenic endothelium in the mouse embryo. Cell Rep. 36, 109675 (2021). · DOI
  64. Agarwalla, P. et al. Bioinstructive implantable scaffolds for rapid in vivo manufacture and release of CAR-T cells. Nat. Biotechnol. 40, 1250–1258 (2022). · DOI
  65. Lis, R. et al. Conversion of adult endothelium to immunocompetent haematopoietic stem cells. Nature 545, 439–445 (2017). · DOI
  66. Sandler, V. M. et al. Reprogramming human endothelial cells to haematopoietic cells requires vascular induction. Nature 511, 312–318 (2014). · DOI
  67. Ditadi, A. & Sturgeon, C. M. Directed differentiation of definitive hemogenic endothelium and hematopoietic progenitors from human pluripotent stem cells. Methods 101, 65–72 (2016). · DOI
  68. Kasper, D. M. et al. MicroRNAs establish uniform traits during the architecture of vertebrate embryos. Dev. Cell 40, 552–565 e555 (2017). · DOI
  69. Ristori, E. & Nicoli, S. miRNAs expression profile in zebrafish developing vessels. Methods Mol. Biol. 1214, 129–150 (2015). · DOI
  70. Babu, S., Takeuchi, Y. & Masai, I. Banp regulates DNA damage response and chromosome segregation during the cell cycle in zebrafish retina. eLife 11, e74611 (2022). · DOI
  71. Fukuhara, S. et al. Visualizing the cell-cycle progression of endothelial cells in zebrafish. Dev. Biol. 393, 10–23 (2014). · DOI
  72. Bertrand, J. Y. et al. Haematopoietic stem cells derive directly from aortic endothelium during development. Nature 464, 108–111 (2010). · DOI · Paper page
  73. Traver, D. et al. Transplantation and in vivo imaging of multilineage engraftment in zebrafish bloodless mutants. Nat. Immunol. 4, 1238–1246 (2003). · DOI · Paper page
  74. Kasper, D. M. et al. The N-glycome regulates the endothelial-to-hematopoietic transition. Science 370, 1186–1191 (2020). · DOI
  75. Goecks, J., Nekrutenko, A., Taylor, J. & Galaxy Team. Galaxy: a comprehensive approach for supporting accessible, reproducible, and transparent computational research in the life sciences. Genome Biol. 11, R86 (2010). · DOI
  76. Dobin, A. et al. STAR: ultrafast universal RNA-seq aligner. Bioinformatics 29, 15–21 (2013). · DOI · Paper page
  77. Dobin, A. & Gingeras, T. R. Mapping RNA-seq reads with STAR. Curr. Protoc. Bioinforma. 51, 11 14 11–11 14 19 (2015). · DOI
  78. Li, H. et al. The Sequence Alignment/Map format and SAMtools. Bioinformatics 25, 2078–2079 (2009). · DOI · Paper page
  79. Anders, S., Pyl, P. T. & Huber, W. HTSeq—a Python framework to work with high-throughput sequencing data. Bioinformatics 31, 166–169 (2015). · DOI · Paper page
  80. Putri, G. H., Anders, S., Pyl, P. T., Pimanda, J. E. & Zanini, F. Analysing high-throughput sequencing data in Python with HTSeq 2.0. Bioinformatics 38, 2943–2945 (2022). · DOI
  81. Love, M. I., Huber, W. & Anders, S. Moderated estimation of fold change and dispersion for RNA-seq data with DESeq2. Genome Biol. 15, 550 (2014). · DOI · Paper page
  82. Ulitsky, I. et al. Extensive alternative polyadenylation during zebrafish development. Genome Res 22, 2054–2066 (2012). · DOI
  83. Dennis, G. Jr. et al. DAVID: Database for Annotation, Visualization, and Integrated Discovery. Genome Biol. 4, P3 (2003). · DOI · Paper page
  84. Sherman, B. T. et al. DAVID: a web server for functional enrichment analysis and functional annotation of gene lists (2021 update). Nucleic Acids Res. 50, W216–W221 (2022). · DOI
  85. Lawson, N. D. et al. An improved zebrafish transcriptome annotation for sensitive and comprehensive detection of cell type-specific genes. eLife 9, e55792 (2020). · DOI
  86. Stuart, T. et al. Comprehensive integration of single-cell data. Cell 177, 1888–1902 e1821 (2019). · DOI · Paper page
  87. Cao, J. et al. The single-cell transcriptional landscape of mammalian organogenesis. Nature 566, 496–502 (2019). · DOI · Paper page
  88. Bergen, V., Lange, M., Peidli, S., Wolf, F. A. & Theis, F. J. Generalizing RNA velocity to transient cell states through dynamical modeling. Nat. Biotechnol. 38, 1408–1414 (2020). · DOI · Paper page
  89. La Manno, G. et al. RNA velocity of single cells. Nature 560, 494–498 (2018). · DOI · Paper page
  90. Lange, M. et al. CellRank for directed single-cell fate mapping. Nat. Methods 19, 159–170 (2022). · DOI
  91. Tirosh, I. et al. Dissecting the multicellular ecosystem of metastatic melanoma by single-cell RNA-seq. Science 352, 189–196 (2016). · DOI · Paper page
  92. Burkhardt, D. B. et al. Quantifying the effect of experimental perturbations at single-cell resolution. Nat. Biotechnol. 39, 619–629 (2021). · DOI · Paper page
  93. Kennedy, M., D’Souza, S. L., Lynch-Kattman, M., Schwantz, S. & Keller, G. Development of the hemangioblast defines the onset of hematopoiesis in human ES cell differentiation cultures. Blood 109, 2679–2687 (2007). · DOI · Paper page
  94. Sturgeon, C. M., Ditadi, A., Awong, G., Kennedy, M. & Keller, G. Wnt signaling controls the specification of definitive and primitive hematopoiesis from human pluripotent stem cells. Nat. Biotechnol. 32, 554–561 (2014). · DOI · Paper page
  95. Kennedy, M. et al. T lymphocyte potential marks the emergence of definitive hematopoietic progenitors in human pluripotent stem cell differentiation cultures. Cell Rep. 2, 1722–1735 (2012). · DOI
  96. Dege, C. & Sturgeon, C. M. Directed differentiation of primitive and definitive hematopoietic progenitors from human pluripotent stem cells. J. Vis. Exp. 1, 55196 (2017).
  97. Ditadi, A. & Sturgeon, C. M. Directed differentiation of definitive hemogenic endothelium and hematopoietic progenitors from human pluripotent stem cells. Methods 101, 65–72 (2016). · DOI
  98. Sturgeon, C. M. et al. Primitive erythropoiesis is regulated by miR-126 via nonhematopoietic Vcam-1+ cells. Dev. Cell 23, 45–57 (2012). · DOI
  99. Ditadi, A. et al. Human definitive haemogenic endothelium and arterial vascular endothelium represent distinct lineages. Nat. Cell Biol. 17, 580–591 (2015). · DOI

Cited by

Sorted by citations

See all 32

Metadata

Authors
Ghersi, J. J., Baldissera, G., Hintzen, J., Luff, S. A., Cheng, S., Xia, I. F., Sturgeon, C. M., & Nicoli, S.
Venue
Nature Cell Biology
Published
2023-07-17
Volume
25
Issue
8
Pages
1135-1145
ISSN
  • 1465-7392
  • 1476-4679
Cited by
32
References
6
Language
en
Funders
  • U.S. Department of Health & Human Services | National Institutes of Health (R01DK118728)
  • American Heart Association (AHA973728)

About these checks

Registry, retraction, Cites and statistics results are computed, not judged, with one exception: a printed reference that no index lists is read once by a model before it counts as a citation error. Claims are extracted by a model and kept only when their quote appears verbatim in the text; each cited source is then checked, with a model’s help, for whether it says what the claim relies on. Those verdicts can be wrong — read the claim’s quote and the cited source before relying on one.

Statistics and arithmetic are recomputed, not judged.

Confidence bands are shown only for fields calibrated on our annotated test set. None is calibrated yet, so no band is shown.

What counts as a claim ›How we measure confidence ›How we check this ›

Are you an author, or do you see a problem with this page? Request a review