

The DOI matches its Crossref record; 118 of the 118 references it cites were found in a registry or an index.
Priority list of biodiversity metrics to observe from space
Abstract
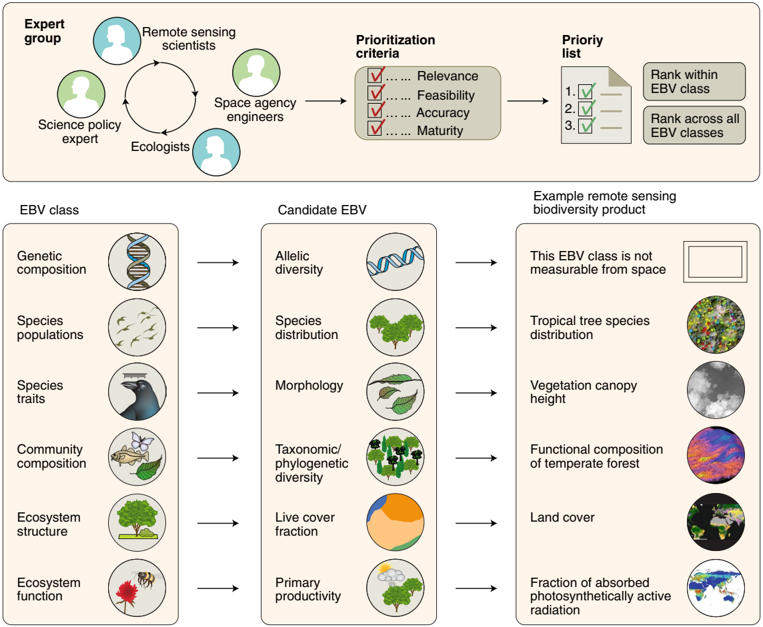
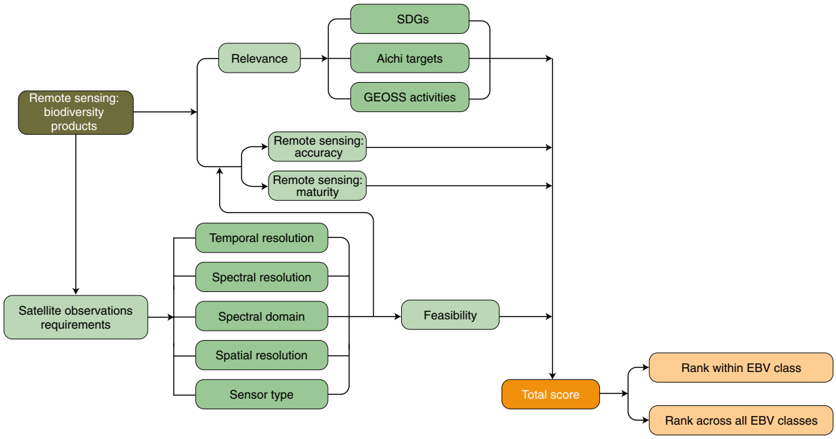
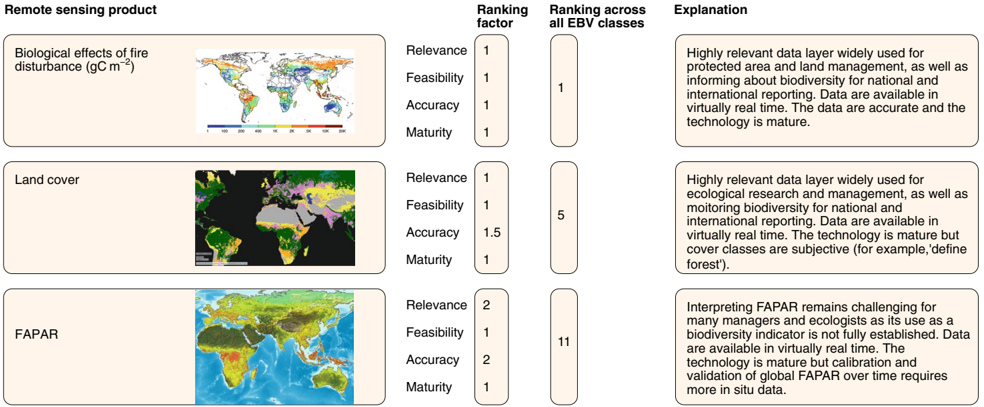
Monitoring global biodiversity from space through remotely sensing geospatial patterns has high potential to add to our knowledge acquired by field observation. Although a framework of essential biodiversity variables (EBVs) is emerging for monitoring biodiversity, its poor alignment with remote sensing products hinders interpolation between field observations. This study compiles a comprehensive, prioritized list of remote sensing biodiversity products that can further improve the monitoring of geospatial biodiversity patterns, enhancing the EBV framework and its applicability. The ecosystem structure and ecosystem function EBV classes, which capture the biological effects of disturbance as well as habitat structure, are shown by an expert review process to be the most relevant, feasible, accurate and mature for direct monitoring of biodiversity from satellites. Biodiversity products that require satellite remote sensing of a finer resolution that is still under development are given lower priority (for example, for the EBV class species traits). Some EBVs are not directly measurable by remote sensing from space, specifically the EBV class genetic composition. Linking remote sensing products to EBVs will accelerate product generation, improving reporting on the state of biodiversity from local to global scales.
Overview
The claims and statistics of this paper haven’t been checked yet.
Run the check — free, no account needed. It reads the open-access text and checks the sources it cites.
Integrity signals
Registry
Cites
Statistics
Figures
Verification
Claims the paper makes
The claims and statistics of this paper haven’t been checked yet.
Run the check — free, no account needed. It reads the open-access text and checks the sources it cites.
Claims other papers make about this one
Each is checked against this paper’s own text: does it say what the citing paper says it does?
In the citing paper
“At high spatial resolution, canopy height models (CHMs) directly characterize habitat heterogeneity9, which is why canopy height has been ranked as a high-priority biodiversity variable to be observed from space5.”
From A high-resolution canopy height model of the Earth (2023) · cites this paper as [5]
Self-check
Percentages, sums and reported differences re-computed from the paper’s own numbers.
The self-check needs the paper’s full text.
Citations
Cites
High-Resolution Global Maps of 21st-Century Forest Cover Change
Hansen, M. C., Potapov, P. V., Moore, R., Hancher, M., Turubanova, S. A., Tyukavina, A., Thau, D., Stehman, S. V., Goetz, S. J., Loveland, T. R., et al. (2013) · Science · doi:10.1126/science.1244693 · Cited by 11,704
Novel methods improve prediction of species’ distributions from occurrence data
Elith*, J., H. Graham*, C., P. Anderson, R., Dudík, M., Ferrier, S., Guisan, A., J. Hijmans, R., Huettmann, F., R. Leathwick, J., Lehmann, A., et al. (2006) · Ecography · doi:10.1111/j.2006.0906-7590.04596.x · Cited by 9,088
High-resolution mapping of global surface water and its long-term changes
Pekel, J.-F., Cottam, A., Gorelick, N., & Belward, A. S. (2016) · Nature · doi:10.1038/nature20584 · Cited by 5,513
Self-citationLavorel, S., & Garnier, E. (2002) · Functional Ecology · doi:10.1046/j.1365-2435.2002.00664.x · Cited by 3,452
The global spectrum of plant form and function
Díaz, S., Kattge, J., Cornelissen, J. H. C., Wright, I. J., Lavorel, S., Dray, S., Reu, B., Kleyer, M., Wirth, C., Colin Prentice, I., et al. (2016) · Nature · doi:10.1038/nature16489 · Cited by 3,365
Global products of vegetation leaf area and fraction absorbed PAR from year one of MODIS data
Myneni, R. B., Hoffman, S., Knyazikhin, Y. V., Privette, J. L., Glassy, J. M., Yuhong Tian, A., Wang, Y., Song, X., Zhang, Y., Smith, G. R., et al. (2002) · Remote Sensing of Environment · doi:10.1016/s0034-4257(02)00074-3 · Cited by 1,996
Improvements of the MODIS terrestrial gross and net primary production global data set
Zhao, M., Heinsch, F. A., Nemani, R., & Running, S. W. (2005) · Remote Sensing of Environment · doi:10.1016/j.rse.2004.12.011 · Cited by 1,693
Leaf Life‐Span in Relation to Leaf, Plant, and Stand Characteristics among Diverse Ecosystems
Reich, P. B., Walters, M. B., & Ellsworth, D. S. (1992) · Ecological Monographs · doi:10.2307/2937116 · Cited by 1,646
Terrestrial animal tracking as an eye on life and planet
Kays, R., Crofoot, M. C., Jetz, W., & Wikelski, M. (2015) · Science · doi:10.1126/science.aaa2478 · Cited by 1,638
Essential Biodiversity Variables
Pereira, H. M., Ferrier, S., Walters, M., Geller, G. N., Jongman, R. H. G., Scholes, R. J., Bruford, M. W., Brummitt, N., Butchart, S. H. M., Cardoso, A. C., et al. (2013) · Science · doi:10.1126/science.1229931 · Cited by 1,637
Self-citationDisturbance, patchiness, and diversity in streams
Lake, P. S. (2000) · Journal of the North American Benthological Society · doi:10.2307/1468118 · Cited by 1,230
Remote sensing of impervious surfaces in the urban areas: Requirements, methods, and trends
Weng, Q. (2012) · Remote Sensing of Environment · doi:10.1016/j.rse.2011.02.030 · Cited by 1,205
Effects of changing scale on landscape pattern analysis: scaling relations
Wu, J. (2004) · Landscape Ecology · doi:10.1023/b:land.0000021711.40074.ae · Cited by 1,144
Review of studies on tree species classification from remotely sensed data
Fassnacht, F. E., Latifi, H., Stereńczak, K., Modzelewska, A., Lefsky, M., Waser, L. T., Straub, C., & Ghosh, A. (2016) · Remote Sensing of Environment · doi:10.1016/j.rse.2016.08.013 · Cited by 1,068
Walker, B., Kinzig, A., & Langridge, J. (1999) · Ecosystems · doi:10.1007/s100219900062 · Cited by 1,062
The Concept of Essential Climate Variables in Support of Climate Research, Applications, and Policy
Bojinski, S., Verstraete, M. M., Peterson, T. C., Richter, C., Simmons, A. J., & Zemp, M. (2014) · Bulletin of the American Meteorological Society · doi:10.1175/bams-d-13-00047.1 · Cited by 1,029
Phenological sensitivity to climate across taxa and trophic levels
Thackeray, S. J., Henrys, P. A., Hemming, D., Bell, J. R., Botham, M. S., Burthe, S., Helaouet, P., Johns, D. G., Jones, I. D., Leech, D. I., et al. (2016) · Nature · doi:10.1038/nature18608 · Cited by 1,020
Quantification of global gross forest cover loss
Hansen, M. C., Stehman, S. V., & Potapov, P. V. (2010) · Proceedings of the National Academy of Sciences · doi:10.1073/pnas.0912668107 · Cited by 892
Copernicus Global Land Cover Layers—Collection 2
Buchhorn, M., Lesiv, M., Tsendbazar, N.-E., Herold, M., Bertels, L., & Smets, B. (2020) · Remote Sensing · doi:10.3390/rs12061044 · Cited by 884
Bongaarts, J. (2019) · Population and Development Review · doi:10.1111/padr.12283 · Cited by 859
The EnMAP Spaceborne Imaging Spectroscopy Mission for Earth Observation
Guanter, L., Kaufmann, H., Segl, K., et al. (2015) · Remote Sensing · doi:10.3390/rs70708830 · Cited by 840
Roy, D. P., Boschetti, L., Justice, C. O., & Ju, J. (2008) · Remote Sensing of Environment · doi:10.1016/j.rse.2008.05.013 · Cited by 722
Analysis of monotonic greening and browning trends from global NDVI time-series
de Jong, R., de Bruin, S., de Wit, A., Schaepman, M. E., & Dent, D. L. (2011) · Remote Sensing of Environment · doi:10.1016/j.rse.2010.10.011 · Cited by 675
Self-citationPrivate Global Business Regulation
Vogel, D. J. (2008) · Annual Review of Political Science · doi:10.1146/annurev.polisci.11.053106.141706 · Cited by 656
Functional traits, the phylogeny of function, and ecosystem service vulnerability
Díaz, S., Purvis, A., Cornelissen, J. H. C., Mace, G. M., Donoghue, M. J., Ewers, R. M., Jordano, P., & Pearse, W. D. (2013) · Ecology and Evolution · doi:10.1002/ece3.601 · Cited by 644
Hyyppä, J., Hyyppä, H., Leckie, D., Gougeon, F., Yu, X., & Maltamo, M. (2008) · International Journal of Remote Sensing · doi:10.1080/01431160701736489 · Cited by 636
Saura, S., Bodin, Ö., & Fortin, M. (2014) · Journal of Applied Ecology · doi:10.1111/1365-2664.12179 · Cited by 632
A global 1‐km consensus land‐cover product for biodiversity and ecosystem modelling
Tuanmu, M., & Jetz, W. (2014) · Global Ecology and Biogeography · doi:10.1111/geb.12182 · Cited by 519
Biodiversity, Species Interactions and Ecological Networks in a Fragmented World
Hagen, M., Kissling, W. D., Rasmussen, C., de Aguiar, M. A. M., Brown, L. E., Carstensen, D., Alves‐dos‐Santos, I., Dupont, Y. L., Edwards, F., Genini, J., et al. (2012) · Advances in ecological research/Advances in Ecological Research · doi:10.1016/b978-0-12-396992-7.00002-2 · Cited by 474
Self-citationEstimating the foliar biochemical concentration of leaves with reflectance spectrometry
Curran, P. J., Dungan, J., & Peterson, D. L. (2001) · Remote Sensing of Environment · doi:10.1016/s0034-4257(01)00182-1 · Cited by 455
Belward, A. S., & Skøien, J. O. (2015) · ISPRS Journal of Photogrammetry and Remote Sensing · doi:10.1016/j.isprsjprs.2014.03.009 · Cited by 440
Review of optical-based remote sensing for plant trait mapping
Homolová, L., Malenovský, Z., Clevers, J. G. P. W., García-Santos, G., & Schaepman, M. E. (2013) · Ecological Complexity · doi:10.1016/j.ecocom.2013.06.003 · Cited by 437
Self-citationNorth American forest disturbance mapped from a decadal Landsat record
Masek, J. G., Huang, C., Wolfe, R., Cohen, W., Hall, F., Kutler, J., & Nelson, P. (2008) · Remote Sensing of Environment · doi:10.1016/j.rse.2008.02.010 · Cited by 428
Lausch, A., Blaschke, T., Haase, D., Herzog, F., Syrbe, R., Tischendorf, L., & Walz, U. (2014) · Ecological Modelling · doi:10.1016/j.ecolmodel.2014.08.018 · Cited by 426
Self-citationFree and open-access satellite data are key to biodiversity conservation
Turner, W., Rondinini, C., Pettorelli, N., Mora, B., Leidner, A. K., Szantoi, Z., Buchanan, G., Dech, S., Dwyer, J., Herold, M., et al. (2015) · Biological Conservation · doi:10.1016/j.biocon.2014.11.048 · Cited by 414
Self-citationEnvironmental science: Agree on biodiversity metrics to track from space
Skidmore, A. K., Pettorelli, N., Coops, N. C., Geller, G. N., Hansen, M., Lucas, R., Mücher, C. A., O'Connor, B., Paganini, M., Pereira, H. M., et al. (2015) · Nature · doi:10.1038/523403a · Cited by 413
Self-citationKitayama, K., & Aiba, S. (2002) · Journal of Ecology · doi:10.1046/j.0022-0477.2001.00634.x · Cited by 391
Bai, Y., Wu, J., Clark, C. M., Pan, Q., Zhang, L., Chen, S., Wang, Q., & Han, X. (2012) · Journal of Applied Ecology · doi:10.1111/j.1365-2664.2012.02205.x · Cited by 386
Monitoring plant functional diversity from space
Jetz, W., Cavender-Bares, J. M., Pavlick, R., SCHIMEL, D. S., Davis, F. W., Asner, G. P., Guralnick, R., Kattge, J., Latimer, A. M., Moorcroft, P. R., et al. (2016) · Nature Plants · doi:10.1038/nplants.2016.24 · Cited by 365
Self-citationCunliffe, A. M., Brazier, R. E., & Anderson, K. (2016) · Remote Sensing of Environment · doi:10.1016/j.rse.2016.05.019 · Cited by 365
Training Deep Convolutional Neural Networks for Land–Cover Classification of High-Resolution Imagery
Scott, G. J., England, M. R., Starms, W. A., Marcum, R. A., & Davis, C. H. (2017) · IEEE Geoscience and Remote Sensing Letters · doi:10.1109/lgrs.2017.2657778 · Cited by 353
The global distribution of net primary production: resolving the paradox
Huston, M. A., & Wolverton, S. (2009) · Ecological Monographs · doi:10.1890/08-0588.1 · Cited by 351
Remote sensing of forest biophysical variables using HyMap imaging spectrometer data
Schlerf, M., Atzberger, C., & Hill, J. (2005) · Remote Sensing of Environment · doi:10.1016/j.rse.2004.12.016 · Cited by 343
Survey of Hyperspectral Earth Observation Applications from Space in the Sentinel-2 Context
Transon, J., d’Andrimont, R., Maugnard, A., & Defourny, P. (2018) · Remote Sensing · doi:10.3390/rs10020157 · Cited by 322
Kissling, W. D., Ahumada, J. A., Bowser, A., Fernandez, M., Fernández, N., García, E. A., Guralnick, R. P., Isaac, N. J. B., Kelling, S., Los, W., et al. (2018) · Biological Reviews · doi:10.1111/brv.12359 · Cited by 314
Self-citationSalcedo-Sanz, S., Ghamisi, P., Piles, M., Werner, M., Cuadra, L., Moreno‐Martínez, Á., Izquierdo-Verdiguier, E., Muñoz-Marí, J., Mosavi, A. H., & Camps‐Valls, G. (2020) · Information Fusion · doi:10.1016/j.inffus.2020.07.004 · Cited by 306
Satellite passive microwave remote sensing for monitoring global land surface phenology
Jones, M. O., Jones, L. A., Kimball, J. S., & McDonald, K. C. (2011) · Remote Sensing of Environment · doi:10.1016/j.rse.2010.12.015 · Cited by 302
Pettorelli, N., Wegmann, M., Skidmore, A., Mücher, S., Dawson, T. P., Fernandez, M., Lucas, R., Schaepman, M. E., Wang, T., O'Connor, B., et al. (2016) · Remote Sensing in Ecology and Conservation · doi:10.1002/rse2.15 · Cited by 295
Self-citationSchweiger, A. K., Cavender-Bares, J., Townsend, P. A., Hobbie, S. E., Madritch, M. D., Wang, R., Tilman, D., & Gamon, J. A. (2018) · Nature Ecology & Evolution · doi:10.1038/s41559-018-0551-1 · Cited by 285
Airborne laser-guided imaging spectroscopy to map forest trait diversity and guide conservation
Asner, G. P., Martin, R. E., Knapp, D. E., Tupayachi, R., Anderson, C. B., Sinca, F., Vaughn, N. R., & Llactayo, W. (2017) · Science · doi:10.1126/science.aaj1987 · Cited by 265
Turner, W. (2014) · Science · doi:10.1126/science.1256014 · Cited by 258
Self-citation“Diminishing returns” in the scaling of functional leaf traits across and within species groups
Niklas, K. J., Cobb, E. D., Niinemets, Ü., Reich, P. B., Sellin, A., Shipley, B., & Wright, I. J. (2007) · Proceedings of the National Academy of Sciences · doi:10.1073/pnas.0701135104 · Cited by 252
Russell-Smith, J., Ryan, P. G., & Durieu, R. (1997) · The Journal of Applied Ecology · doi:10.2307/2404920 · Cited by 243
Connecting Earth observation to high-throughput biodiversity data
Bush, A., Sollmann, R., Wilting, A., Bohmann, K., Cole, B., Balzter, H., Martius, C., Zlinszky, A., Calvignac‐Spencer, S., Cobbold, C. A., et al. (2017) · Nature Ecology & Evolution · doi:10.1038/s41559-017-0176 · Cited by 232
Geijzendorffer, I. R., Regan, E., Pereira, H. M., Brotons, L., Brummitt, N. A., Gavish, Y., Haase, P., Martin, C. S., Mihoub, J., Secades, C., et al. (2015) · Journal of Applied Ecology · doi:10.1111/1365-2664.12417 · Cited by 230
Self-citationTowards global data products of Essential Biodiversity Variables on species traits
Kissling, W. D., Walls, R., Bowser, A., Jones, M., Kattge, J., Agosti, D., Amengual, J., Basset, A., van Bodegom, P. M., Cornelissen, J. H. C., et al. (2018) · Nature Ecology & Evolution · doi:10.1038/s41559-018-0667-3 · Cited by 229
Self-citationMonitoring biodiversity change through effective global coordination
Navarro, L. M., Fernández, N., Guerra, C. A., Guralnick, R., Kissling, W. D., Londoño, M. C., Muller-Karger, F. E., Turak, E., Balvanera, P., Costello, M. J., et al. (2017) · Current Opinion in Environmental Sustainability · doi:10.1016/j.cosust.2018.02.005 · Cited by 225
Self-citationLucas, R., Rowlands, A., Brown, A., Keyworth, S., & Bunting, P. (2007) · ISPRS Journal of Photogrammetry and Remote Sensing · doi:10.1016/j.isprsjprs.2007.03.003 · Cited by 224
Virtual constellations for global terrestrial monitoring
Wulder, M. A., Hilker, T., White, J. C., Coops, N. C., Masek, J. G., Dirk Pflugmacher, A., & Crevier, Y. (2015) · Remote Sensing of Environment · doi:10.1016/j.rse.2015.09.001 · Cited by 222
Self-citationScott, G. J., Marcum, R. A., Davis, C. H., & Nivin, T. W. (2017) · IEEE Geoscience and Remote Sensing Letters · doi:10.1109/lgrs.2017.2722988 · Cited by 218
Differences in fine root productivity between mixed‐ and single‐species stands
Brassard, B. W., Chen, H. Y. H., Bergeron, Y., & Paré, D. (2010) · Functional Ecology · doi:10.1111/j.1365-2435.2010.01769.x · Cited by 210
DeFries, R., Field, C. B., FUNG, I. Y., Justice, C. O., Los, S. O., Matson, P. A., Matthews, E., Mooney, H. A., Potter, C. S., Prentice, K. C., et al. (1995) · Journal of Geophysical Research Atmospheres · doi:10.1029/95jd01536 · Cited by 209
How Essential Biodiversity Variables and remote sensing can help national biodiversity monitoring
Vihervaara, P., Auvinen, A.-P., Mononen, L., Törmä, M., Ahlroth, P., Anttila, S., Böttcher, K., Forsius, M., Heino, J., Heliölä, J., et al. (2017) · Global Ecology and Conservation · doi:10.1016/j.gecco.2017.01.007 · Cited by 209
Self-citationBuilding capacity in biodiversity monitoring at the global scale
Schmeller, D. S., Böhm, M., Arvanitidis, C., Barber-Meyer, S. M., Brummitt, N. A., Chandler, M., Chatzinikolaou, E., Costello, M. J., Ding, H., García‐Moreno, J., et al. (2017) · Biodiversity and Conservation · doi:10.1007/s10531-017-1388-7 · Cited by 202
An explanation of enhanced radar backscattering from flooded forests
Richards, J. A., Woodgate, P., & Skidmore, A. K. (1987) · International Journal of Remote Sensing · doi:10.1080/01431168708954756 · Cited by 201
Self-citationGarrigues, S., Allard, D., Baret, F., & Weiss, M. (2006) · Remote Sensing of Environment · doi:10.1016/j.rse.2006.07.013 · Cited by 195
Arvor, D., Durieux, L., Andrés, S., & Laporte, M. (2013) · ISPRS Journal of Photogrammetry and Remote Sensing · doi:10.1016/j.isprsjprs.2013.05.003 · Cited by 189
Cavender-Bares, J. M., Meireles, J. E., Couture, J. J., Kaproth, M. A., Kingdon, C. C., SINGH, A. K., Serbin, S. P., Zuniga, E., Pilz, G. E., & Townsend, P. A. (2016) · Remote Sensing · doi:10.3390/rs8030221 · Cited by 185
Lausch, A., Bannehr, L., Beckmann, M., Boehm, C., Feilhauer, H., Hacker, J., Heurich, M., Jung, A., Klenke, R., Neumann, C., et al. (2016) · Ecological Indicators · doi:10.1016/j.ecolind.2016.06.022 · Cited by 184
Self-citationVariability and evolution of global land surface phenology over the past three decades (1982–2012)
Garonna, I., de Jong, R., & Schaepman, M. E. (2015) · Global Change Biology · doi:10.1111/gcb.13168 · Cited by 182
Self-citationSatellite sensor requirements for monitoring essential biodiversity variables of coastal ecosystems
Muller-Karger, F. E., Hestir, E. L., Ade, C., Turpie, K., Roberts, D. A., Siegel, D. A., Miller, R. J., Humm, D. C., Izenberg, N. R., Keller, M. R., et al. (2018) · Ecological Applications · doi:10.1002/eap.1682 · Cited by 164
Self-citationMarta Coll, M., Shannon, L. J., Kleisner, K. M., Juan‐Jordá, M. J., Bundy, A., Akoğlu, A. G., Bănaru, D., Boldt, J. L., Borges, M. F., Cook, A., et al. (2015) · Ecological Indicators · doi:10.1016/j.ecolind.2015.08.048 · Cited by 153
Skidmore, A. K. (1989) · University of Twente Research Information · Cited by 151
Self-citationImportant LiDAR metrics for discriminating forest tree species in Central Europe
Shi, Y., Wang, T., Skidmore, A. K., & Heurich, M. (2018) · ISPRS Journal of Photogrammetry and Remote Sensing · doi:10.1016/j.isprsjprs.2018.02.002 · Cited by 149
Self-citationCombining Tandem-X InSAR and simulated GEDI lidar observations for forest structure mapping
Qi, W., & Dubayah, R. (2016) · Remote Sensing of Environment · doi:10.1016/j.rse.2016.10.018 · Cited by 143
Wildlife tracking data management: a new vision
Urbano, F., Cagnacci, F., Calenge, C., et al. (2010) · Philosophical Transactions of the Royal Society B Biological Sciences · doi:10.1098/rstb.2010.0081 · Cited by 136
Leaf reflectance spectra capture the evolutionary history of seed plants
Meireles, J. E., Cavender-Bares, J. M., Townsend, P. A., Ustin, S. L., Gamon, J. A., Schweiger, A. K., Schaepman, M. E., Asner, G. P., Martin, R. E., SINGH, A. K., et al. (2020) · New Phytologist · doi:10.1111/nph.16771 · Cited by 135
Self-citationMonitoring global changes in biodiversity and climate essential as ecological crisis intensifies
O'Connor, B., Bojinski, S., Roeoesli, C., & Schaepman, M. E. (2019) · Ecological Informatics · doi:10.1016/j.ecoinf.2019.101033 · Cited by 134
Self-citationNeumann, W., Martinuzzi, S., Estes, A. B., Pidgeon, A. M., Dettki, H., Ericsson, G., & Radeloff, V. C. (2015) · Movement Ecology · doi:10.1186/s40462-015-0036-7 · Cited by 133
Performance of a neural network : mapping forests using GIS and remotely sensed data
Skidmore, A. K., Turner, B. J., Brinkhof, W., & Knowles, E. (1997) · University of Twente Research Information · Cited by 131
Self-citationMapping Coastal Vegetation Using an Expert System and Hyperspectral Imagery
Schmidt, K. S., Skidmore, A. K., Kloosterman, E. H., van Oosten, H., Kumar, L., & Janssen, J. A. M. (2004) · Photogrammetric Engineering & Remote Sensing · doi:10.14358/pers.70.6.703 · Cited by 130
Self-citationHealy, C., Gotelli, N. J., & Potvin, C. (2008) · Journal of Ecology · doi:10.1111/j.1365-2745.2008.01419.x · Cited by 125
Kissling, W. D., Ahumada, J., Bowser, A., Fernández, M., Fernández, N., García, E. A., Guralnick, R., Isaac, N. J. B., Kelling, S., Los, W., et al. (2017) · instname:Instituto de Investigación de Recursos Biológicos Alexander von Humboldt · doi:10.1111/brv.12359/epdf · Cited by 124
Self-citationRoom for rivers: An integrative search strategy for floodplain restoration
Rohde, S., Hostmann, M., Peter, A., & Ewald, K. C. (2005) · Landscape and Urban Planning · doi:10.1016/j.landurbplan.2005.05.006 · Cited by 122
Whales from space: Four mysticete species described using new VHR satellite imagery
Cubaynes, H. C., Fretwell, P. T., Bamford, C. C. G., Gerrish, L., & Jackson, J. A. (2018) · Marine Mammal Science · doi:10.1111/mms.12544 · Cited by 118
Earth observation as a tool for tracking progress towards the Aichi Biodiversity Targets
O'Connor, B., Secades, C., Penner, J., Sonnenschein, R., Skidmore, A. K., Burgess, N. D., & Hutton, J. M. (2015) · Remote Sensing in Ecology and Conservation · doi:10.1002/rse2.4 · Cited by 116
Self-citationMacroecological conclusions based on IUCN expert maps: A call for caution
Herkt, K. M. B., Skidmore, A. K., & Fahr, J. (2017) · Global Ecology and Biogeography · doi:10.1111/geb.12601 · Cited by 114
Self-citationLausch, A., Borg, E., Bumberger, J., Dietrich, P., Heurich, M., Huth, A., Jung, A., Klenke, R., Knapp, S., Mollenhauer, H., et al. (2018) · Remote Sensing · doi:10.3390/rs10071120 · Cited by 112
Self-citationPotential of Sentinel-2 spectral configuration to assess rangeland quality
Ramoelo, A., Cho, M. A., Mathieu, R., & Skidmore, A. K. (2015) · Journal of Applied Remote Sensing · doi:10.1117/1.jrs.9.094096 · Cited by 106
Self-citationEvaluating the ecological sustainability of Austrian agricultural landscapes—the SINUS approach
Peterseil, J., Wrbka, T., Plutzar, C., Schmitzberger, I., Kiss, A., Szerencsits, E., Reiter, K., Schneider, W., Suppan, F., & Beissmann, H. (2004) · Land Use Policy · doi:10.1016/j.landusepol.2003.10.011 · Cited by 105
Lack of conservation effort rapidly increases African great ape extinction risk
Tranquilli, S., Abedi‐Lartey, M., Amsini, F., Arranz, L., Asamoah, A., Babafemi, O., Barakabuye, N., Campbell, G., Chancellor, R. L., Davenport, T. R. B., et al. (2011) · Conservation Letters · doi:10.1111/j.1755-263x.2011.00211.x · Cited by 100
Wu, S., Wang, J., Yan, Z., Song, G., Chen, Y., Ma, Q., Deng, M., Wu, Y., Zhao, Y., Guo, Z., et al. (2020) · ISPRS Journal of Photogrammetry and Remote Sensing · doi:10.1016/j.isprsjprs.2020.10.017 · Cited by 99
Multi-phenology WorldView-2 imagery improves remote sensing of savannah tree species
Madonsela, S., Cho, M. A., Mathieu, R., Mutanga, O., Ramoelo, A., Kaszta, Z. M., Kerchove, R. V. D., & Eléonore Wolff, A. (2017) · International Journal of Applied Earth Observation and Geoinformation · doi:10.1016/j.jag.2017.01.018 · Cited by 97
Fast Automatic Airport Detection in Remote Sensing Images Using Convolutional Neural Networks
Fen, C., Ren, R., de Voorde, T. V., Xu, W., Zhou, G., & Zhou, Y. (2018) · Remote Sensing · doi:10.3390/rs10030443 · Cited by 95
Khosravipour, A., Skidmore, A. K., & Isenburg, M. (2016) · International Journal of Applied Earth Observation and Geoinformation · doi:10.1016/j.jag.2016.06.005 · Cited by 93
Self-citationGraves, S., Asner, G. P., Martin, R. E., Anderson, C. B., Colgan, M., Kalantari, L., & Bohlman, S. (2016) · Remote Sensing · doi:10.3390/rs8020161 · Cited by 88
Gratani, L., & Bombelli, A. (2000) · Environmental and Experimental Botany · doi:10.1016/s0098-8472(99)00052-0 · Cited by 85
Spotting East African Mammals in Open Savannah from Space
Yang, Z., Wang, T., Skidmore, A. K., de Leeuw, J., Said, M. Y., & Freer, J. E. (2014) · PLoS ONE · doi:10.1371/journal.pone.0115989 · Cited by 80
Self-citationAutomatic Counting of Large Mammals from Very High Resolution Panchromatic Satellite Imagery
Xue, Y., Wang, T., & Skidmore, A. K. (2017) · Remote Sensing · doi:10.3390/rs9090878 · Cited by 73
Self-citationMERIS: the re‐branding of an ocean sensor
Curran, P. J., & Steele, C. M. (2005) · International Journal of Remote Sensing · doi:10.1080/01431160412331330275 · Cited by 66
An operational definition of essential biodiversity variables
Schmeller, D. S., Mihoub, J., Bowser, A., Arvanitidis, C., Costello, M. J., Fernández, M., Geller, G. N., Hobern, D., Kissling, W. D., Regan, E., et al. (2017) · Biodiversity and Conservation · doi:10.1007/s10531-017-1386-9 · Cited by 59
Self-citationAsner, G. P., Wessman, C. A., & SCHIMEL, D. S. (1998) · Ecological Applications · doi:10.1890/1051-0761(1998)008[1022:hoscsa]2.0.co;2 · Cited by 57
Indirect remote sensing of a cryptic forest understorey invasive species
Joshi, C., de Leeuw, J., van Andel, J., Skidmore, A. K., Lekhak, H. D., van Duren, I. C., & Norbu, N. (2006) · Forest Ecology and Management · doi:10.1016/j.foreco.2006.01.013 · Cited by 56
Self-citationWilkes, P., Jones, S., Suárez, L., Haywood, A., Mellor, A., Woodgate, W., Soto‐Berelov, M., & Skidmore, A. K. (2015) · Methods in Ecology and Evolution · doi:10.1111/2041-210x.12510 · Cited by 56
Self-citationImproving Remote Species Identification through Efficient Training Data Collection
Baldeck, C. A., & Asner, G. P. (2014) · Remote Sensing · doi:10.3390/rs6042682 · Cited by 53
Phylogenetic Structure of Foliar Spectral Traits in Tropical Forest Canopies
McManus, K., Asner, G. P., Martin, R. E., Dexter, K. G., Kress, W. J., & Field, C. B. (2016) · Remote Sensing · doi:10.3390/rs8030196 · Cited by 53
Nagler, P. L., Glenn, E. P., & Hinojosa‐Huerta, O. (2009) · Remote Sensing of Environment · doi:10.1016/j.rse.2008.06.018 · Cited by 52
Potter, C. S., Tan, P., Kumar, V., Kucharik, C. J., Klooster, S. A., Genovese, V. B., Cohen, W. B., & Healey, S. P. (2005) · Ecosystems · doi:10.1007/s10021-005-0041-6 · Cited by 52
The Client and the Cloud: Democratizing Research Computing
Barga, R., Gannon, D. B., & Reed, D. A. (2010) · IEEE Internet Computing · doi:10.1109/mic.2011.20 · Cited by 47
Scaling-up Trait Variation from Individuals to Ecosystems
Gibert, J. P., Dell, A. I., DeLong, J. P., et al. (2015) · Advances in ecological research/Advances in Ecological Research · doi:10.1016/bs.aecr.2015.03.001 · Cited by 43
The role of space agencies in remotely sensed essential biodiversity variables
Paganini, M., Leidner, A. K., Geller, G. N., Turner, W., & Wegmann, M. (2016) · Remote Sensing in Ecology and Conservation · doi:10.1002/rse2.29 · Cited by 37
Self-citationCzyż, E. A., Guillén‐Escribà, C., Hendrik Wulf, A., Tedder, A., Schuman, M. C., Schneider, F., & Schaepman, M. E. (2020) · Ecology and Evolution · doi:10.1002/ece3.6469 · Cited by 37
Self-citationWeiss, J. R., Smythe, W. D., & Lu, W. (2005) · Proceedings - IEEE Aerospace Conference · doi:10.1109/aero.2005.1559323 · Cited by 24
Free satellite data key to conservation
Buchanan, G. M., Beresford, A. E., Hebblewhite, M., Escobedo, F. J., de Klerk, H. M., Donald, P. F., Escribano, P., Koh, L. P., Martínez‐López, J., Pettorelli, N., et al. (2018) · Science · doi:10.1126/science.aau2650 · Cited by 18
Self-citationVerstraete, M. M., Diner, D. J., & Bézy, J. (2015) · Environmental Science & Policy · doi:10.1016/j.envsci.2015.08.005 · Cited by 17
Ye, H., Huang, X., Luo, G., Wang, J., Zhang, M., & Wang, X.-X. (2019) · Journal of Mountain Science · doi:10.1007/s11629-018-5200-2 · Cited by 8
Enhancement of area‐specific land‐use objectives for land development
Nidumolu, U., de Bie, C. A. J. M., van Keulen, H., & Skidmore, A. K. (2004) · Land Degradation and Development · doi:10.1002/ldr.636 · Cited by 6
Self-citation
Research works printed but not linked: 2
- Morsdorf, F. et al. in Remote Sensing of Plant Biodiversity (eds Cavender-Bares, J. et al.) 83–104 (Springer International, 2020).
- National Academies of Sciences, Engineering, and Medicine Thriving on Our Changing Planet: A Decadal Strategy for Earth Observation from Space (National Academies Press, 2018).
Cited by
A high-resolution canopy height model of the Earth
Lang, N., Jetz, W., Schindler, K., & Wegner, J. D. (2023) · Nature Ecology & Evolution · doi:10.1038/s41559-023-02206-6 · Cited by 810
Moudrý, V., Gábor, L., Marselis, S., Pracná, P., Barták, V., Prošek, J., Navrátilová, B., Novotný, J., Potůčková, M., Gdulová, K., et al. (2024) · Ecosphere · doi:10.1002/ecs2.70026 · Cited by 43
Self-citation
Metadata
- Authors
- Skidmore, A. K., Coops, N. C., Neinavaz, E., Ali, A., Schaepman, M. E., Paganini, M., Kissling, W. D., Vihervaara, P., Darvishzadeh, R., Feilhauer, H., Fernandez, M., Fernández, N., Gorelick, N., Geijzendorffer, I., Heiden, U., Heurich, M., Hobern, D., Holzwarth, S., Muller-Karger, F. E., Van De Kerchove, R., Lausch, A., Leitão, P. J., Lock, M. C., Mücher, C. A., O’Connor, B., Rocchini, D., Roeoesli, C., Turner, W., Vis, J. K., Wang, T., Wegmann, M., & Wingate, V.
- ORCID
- Skidmore, Andrew K.
- Coops, Nicholas C.
- Neinavaz, Elnaz
- Schaepman, Michael E.
- Kissling, W. Daniel
- Vihervaara, Petteri
- Darvishzadeh, Roshanak
- Feilhauer, Hannes
- Fernandez, Miguel
- Fernández, Néstor
- Gorelick, Noel
- Heiden, Uta
- Heurich, Marco
- Holzwarth, Stefanie
- Muller-Karger, Frank E.
- Lausch, Angela
- Leitão, Pedro J.
- Lock, Marcelle C.
- Rocchini, Duccio
- Wang, Tiejun
- Wegmann, Martin
- Venue
- Nature Ecology & Evolution
- Published
- 2021-05-13
- Volume
- 5
- Issue
- 7
- Pages
- 896-906
- ISSN
- 2397-334X
- Cited by
- 278
- References
- 118
- Language
- en
- Licence
- www.springernature.com/gp/researchers/text-and-data-mining (tdm)
- www.springernature.com/gp/researchers/text-and-data-mining (vor)
About these checks
Registry, retraction, Cites and statistics results are computed, not judged, with one exception: a printed reference that no index lists is read once by a model before it counts as a citation error. Claims are extracted by a model and kept only when their quote appears verbatim in the text; each cited source is then checked, with a model’s help, for whether it says what the claim relies on. Those verdicts can be wrong — read the claim’s quote and the cited source before relying on one.
Statistics and arithmetic are recomputed, not judged.
Confidence bands are shown only for fields calibrated on our annotated test set. None is calibrated yet, so no band is shown.
What counts as a claim ›How we measure confidence ›How we check this ›
Are you an author, or do you see a problem with this page? Request a review
Data sources
Bibliographic data: Semantic Scholar, OpenAlex, Crossref.
Contains information from the Semantic Scholar Academic Graph Datasets, made available under the ODC Attribution License (ODC-BY 1.0).
Semantic Scholar’s data is described in: Kinney, R., et al. (2023). The Semantic Scholar Open Data Platform. arXiv:2301.10140.
