

The DOI matches its Crossref record; 51 of the 51 references it cites were found in a registry or an index.
Multi-kingdom microbiota analyses identify bacterial–fungal interactions and biomarkers of colorectal cancer across cohorts
Open accessAbstract
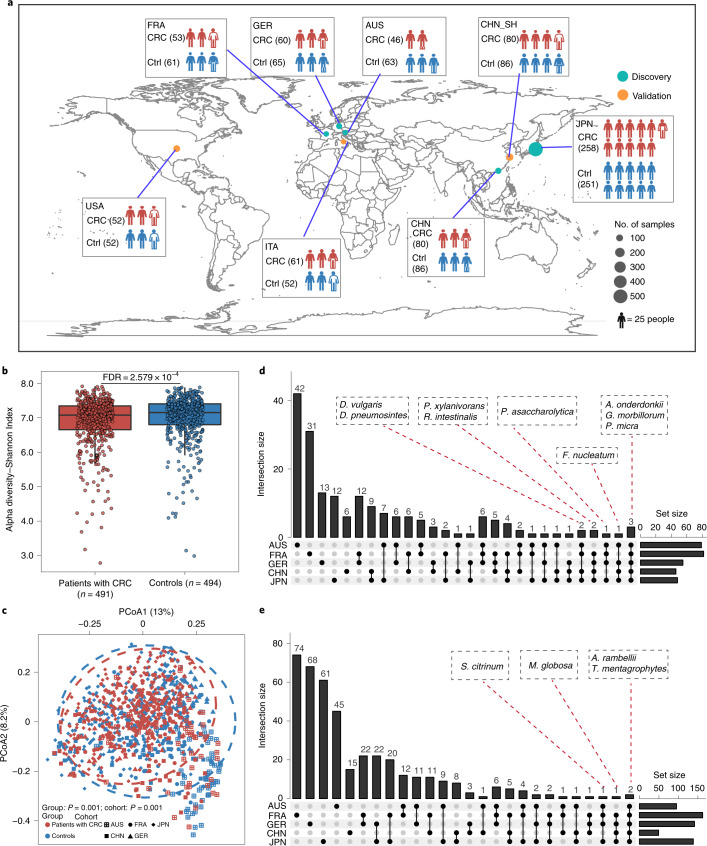
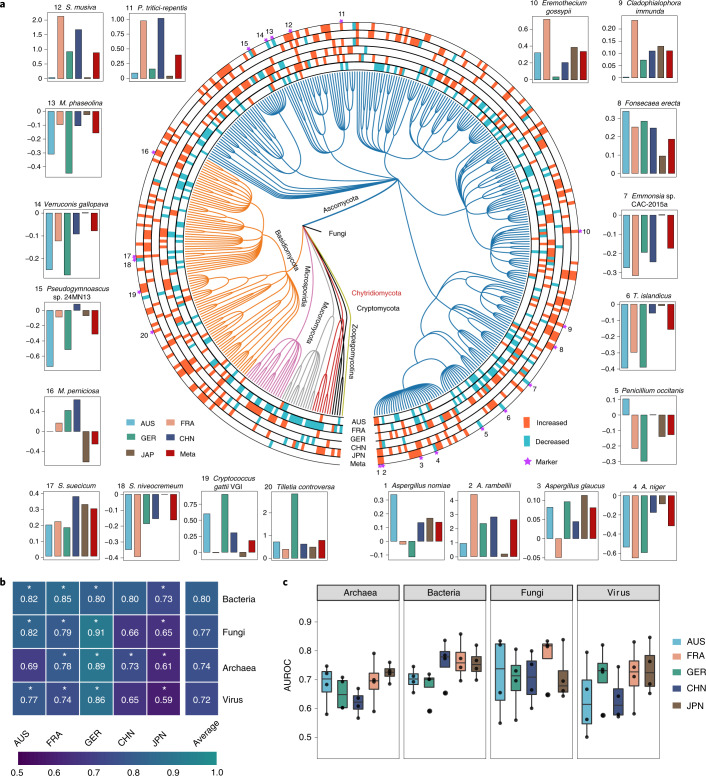
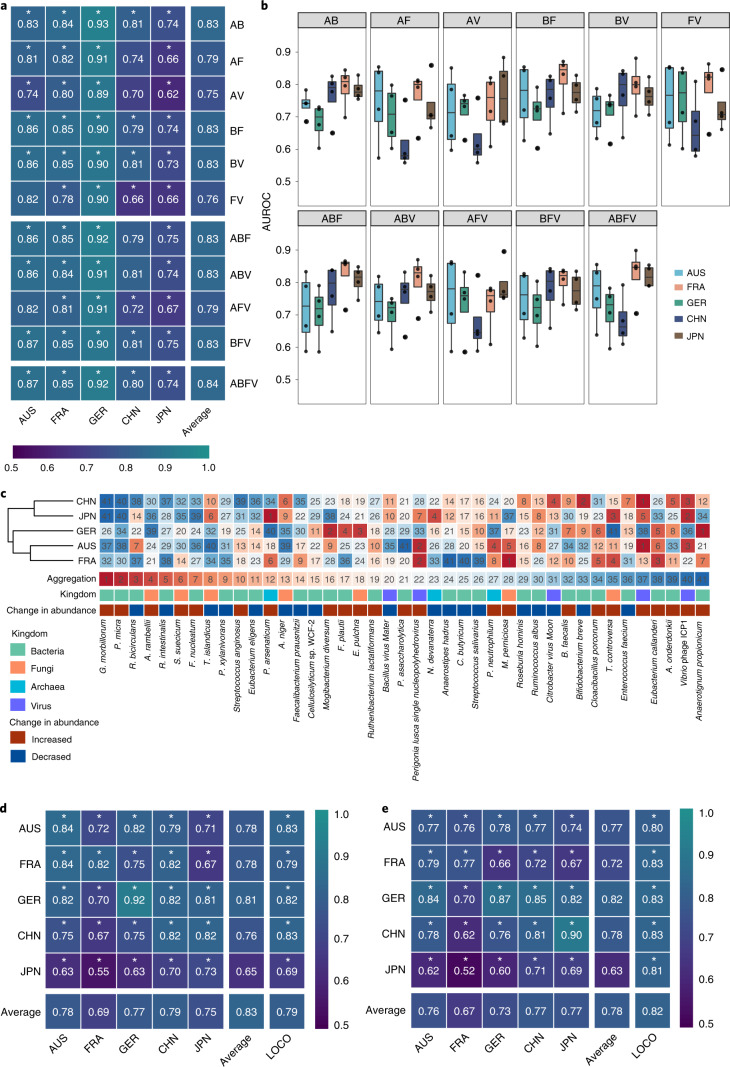
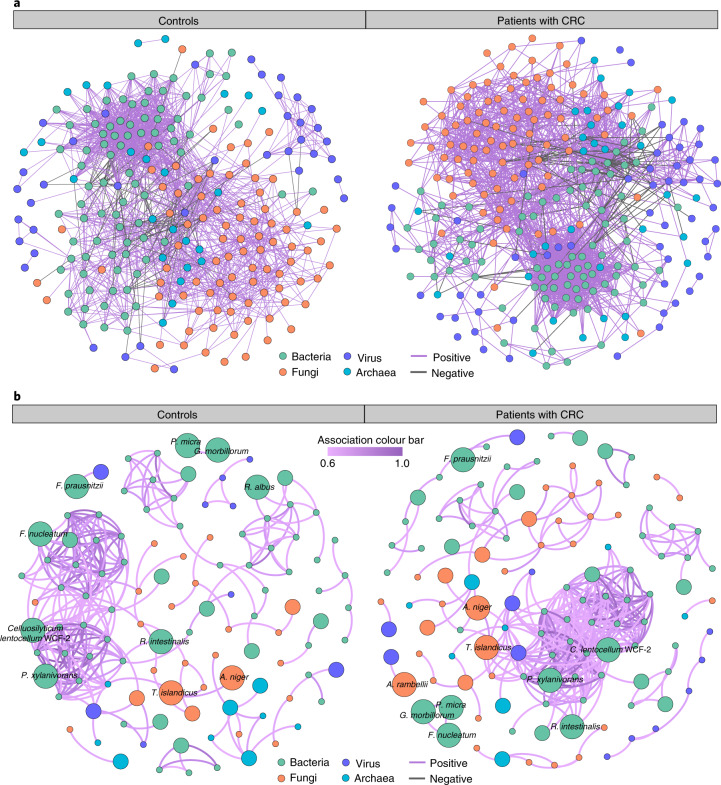
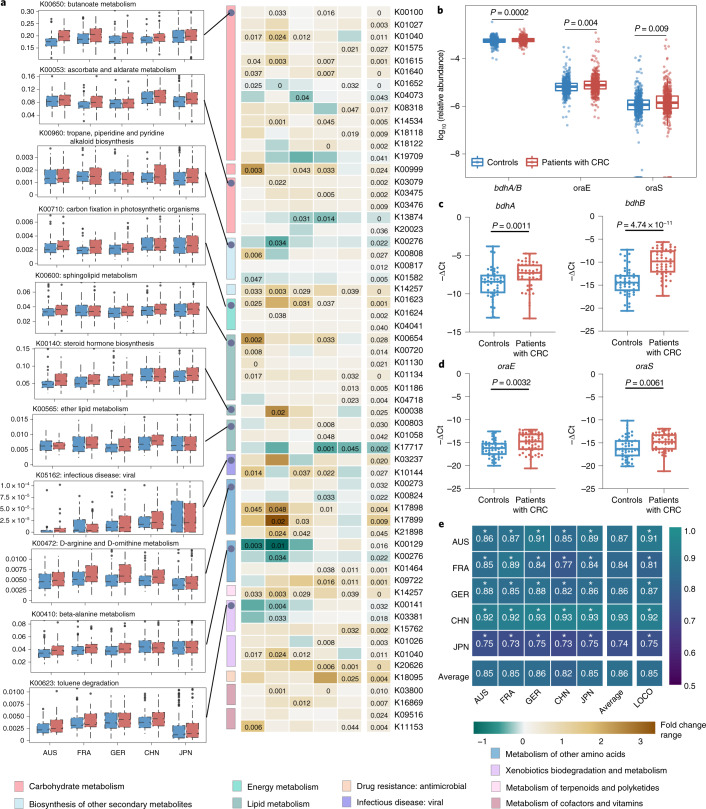
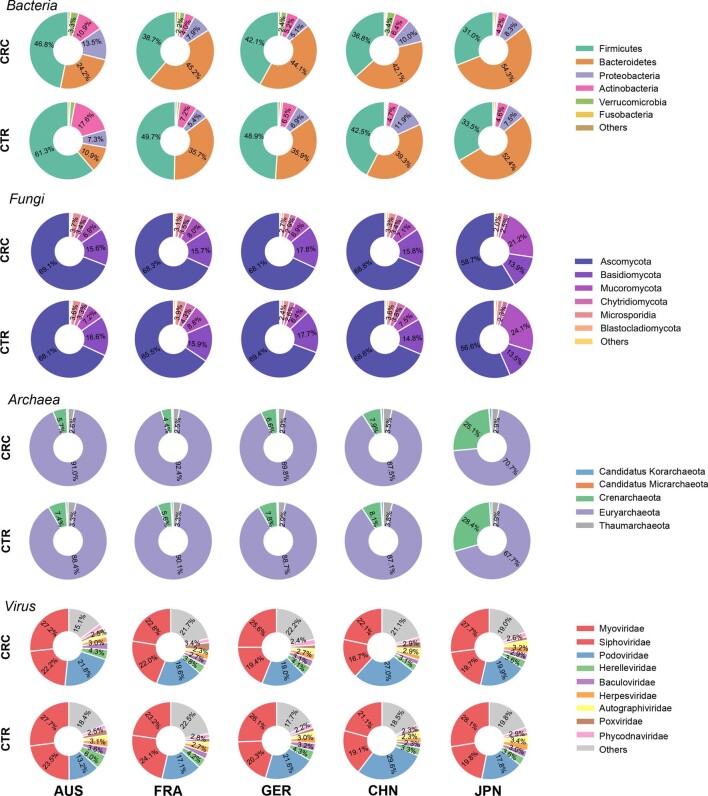
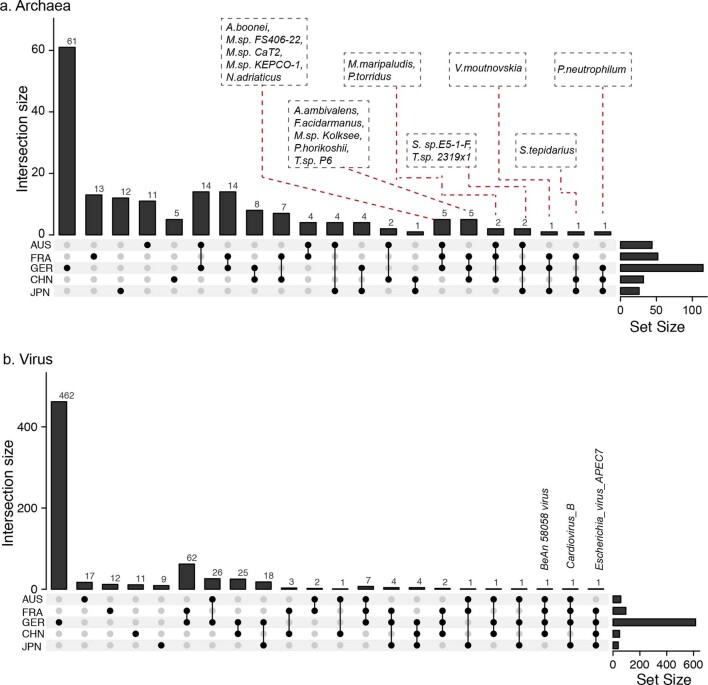
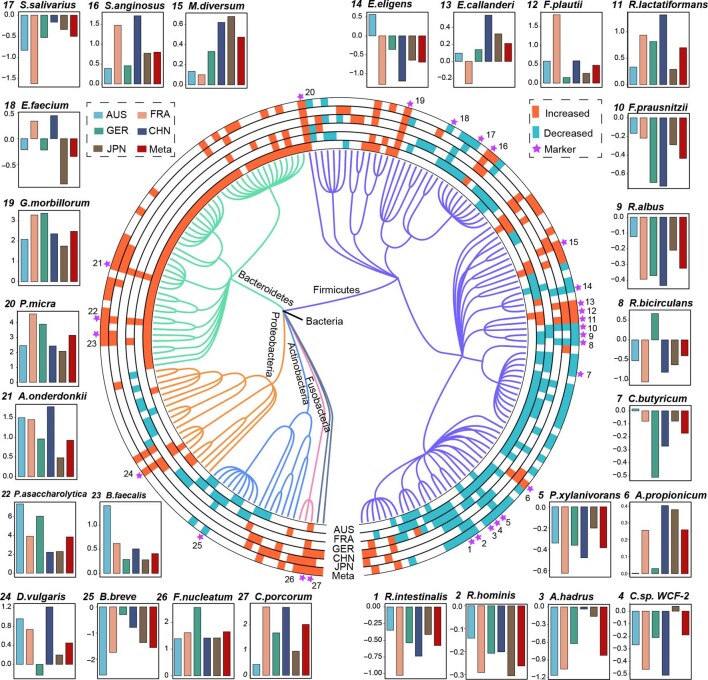
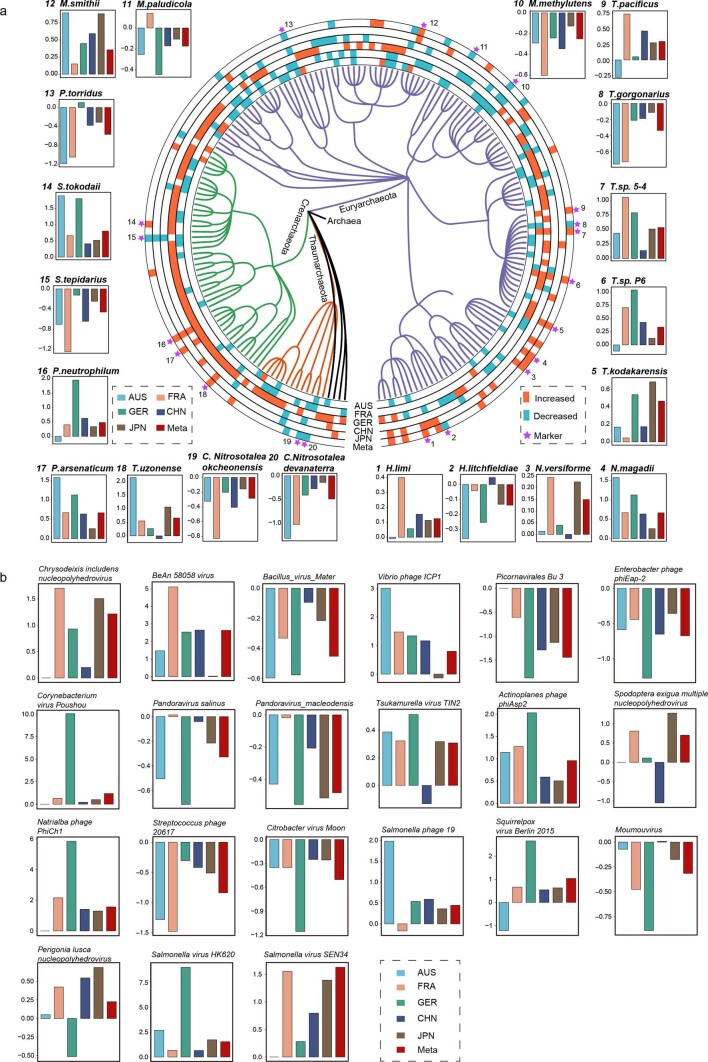
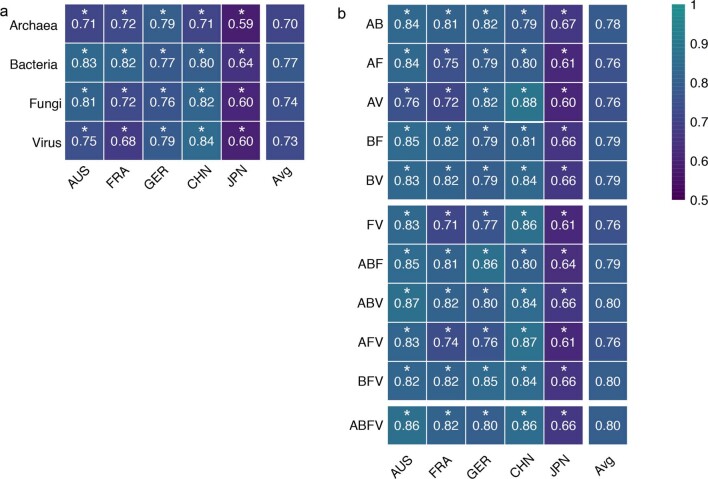
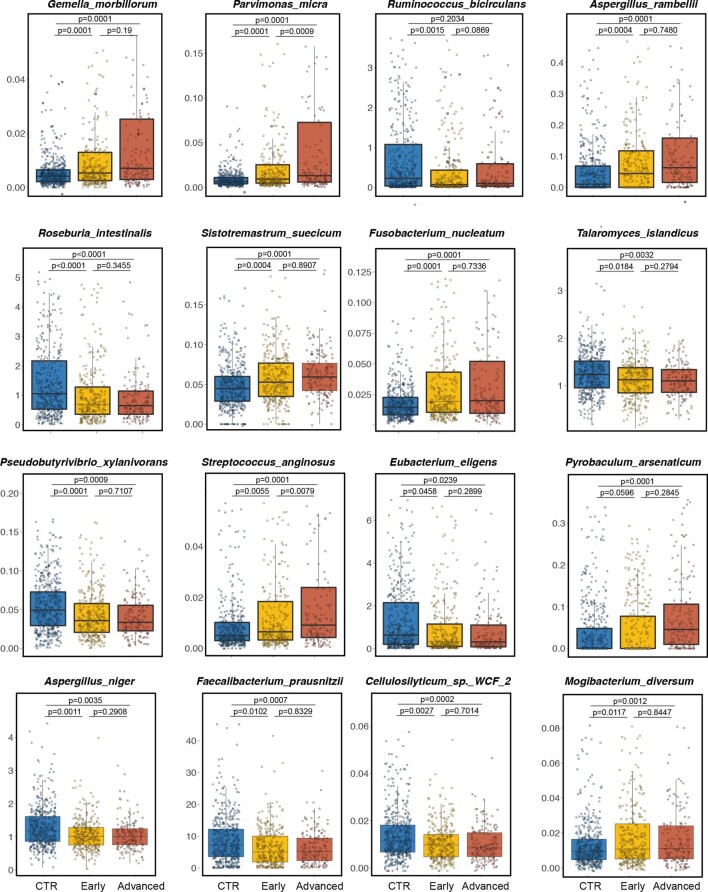
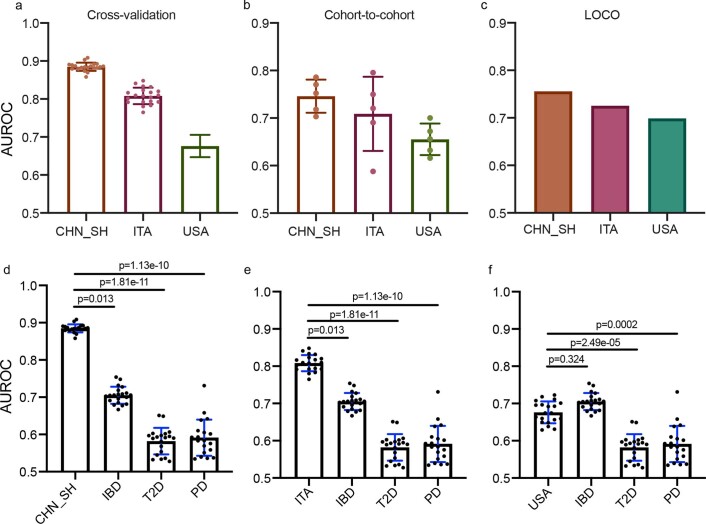
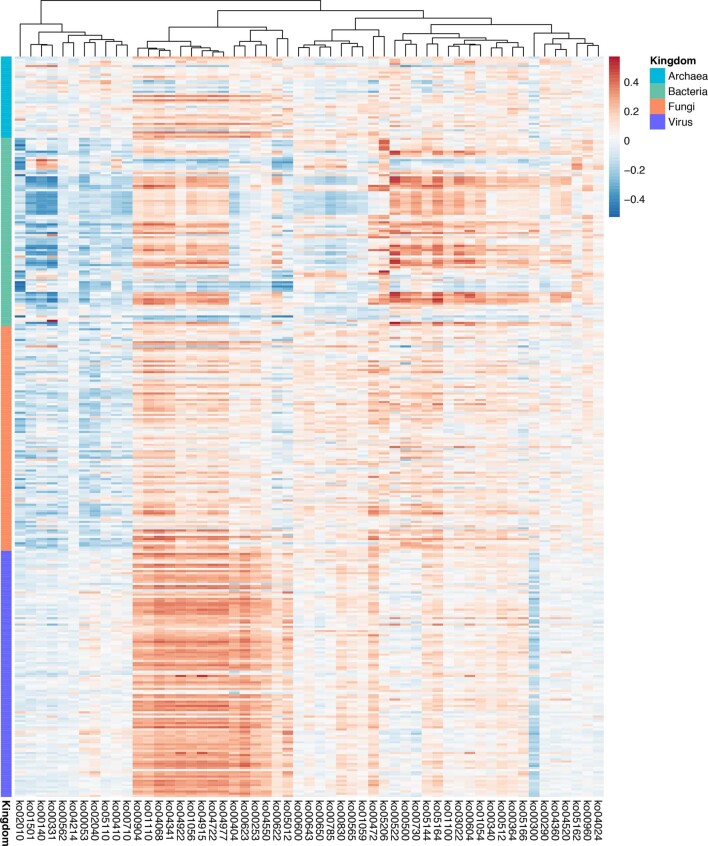
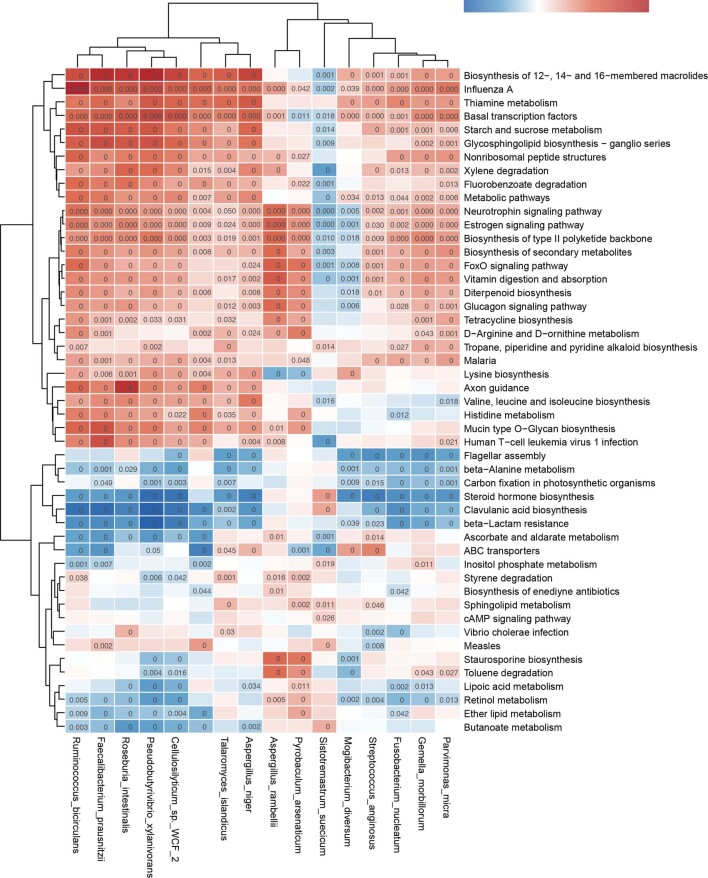
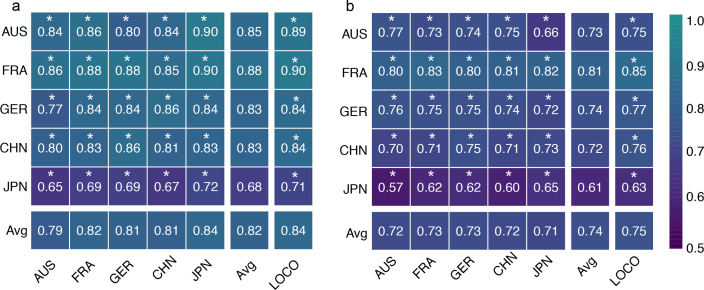
Despite recent progress in our understanding of the association between the gut microbiome and colorectal cancer (CRC), multi-kingdom gut microbiome dysbiosis in CRC across cohorts is unexplored. We investigated four-kingdom microbiota alterations using CRC metagenomic datasets of 1,368 samples from 8 distinct geographical cohorts. Integrated analysis identified 20 archaeal, 27 bacterial, 20 fungal and 21 viral species for each single-kingdom diagnostic model. However, our data revealed superior diagnostic accuracy for models constructed with multi-kingdom markers, in particular the addition of fungal species. Specifically, 16 multi-kingdom markers including 11 bacterial, 4 fungal and 1 archaeal feature, achieved good performance in diagnosing patients with CRC (area under the receiver operating characteristic curve (AUROC) = 0.83) and maintained accuracy across 3 independent cohorts. Coabundance analysis of the ecological network revealed associations between bacterial and fungal species, such as Talaromyces islandicus and Clostridium saccharobutylicum . Using metagenome shotgun sequencing data, the predictive power of the microbial functional potential was explored and elevated D-amino acid metabolism and butanoate metabolism were observed in CRC. Interestingly, the diagnostic model based on functional EggNOG genes achieved high accuracy (AUROC = 0.86). Collectively, our findings uncovered CRC-associated microbiota common across cohorts and demonstrate the applicability of multi-kingdom and functional markers as CRC diagnostic tools and, potentially, as therapeutic targets for the treatment of CRC.
Overview
The claims and statistics of this paper haven’t been checked yet.
Run the check — free, no account needed. It reads the open-access text and checks the sources it cites.
Integrity signals
Registry
Cites
Statistics
Figures
Verification
Claims the paper makes
The claims and statistics of this paper haven’t been checked yet.
Run the check — free, no account needed. It reads the open-access text and checks the sources it cites.
Claims other papers make about this one
Each is checked against this paper’s own text: does it say what the citing paper says it does?
In the citing paper
“Studies have discovered specific virome79 and mycobiome86,87 signatures for CRC GOMS, and included in vitro and in vivo experiments showing that the fungus Aspergillus rambellii can promote CRC cell growth86.”
From Gut OncoMicrobiome Signatures (GOMS) as next-generation biomarkers for cancer immunotherapy (2023) · cites this paper as [87]
Self-check
Percentages, sums and reported differences re-computed from the paper’s own numbers.
The self-check needs the paper’s full text.
Citations
Cites
Fast gapped-read alignment with Bowtie 2
Langmead, B., & Salzberg, S. L. (2012) · Nature Methods · doi:10.1038/nmeth.1923 · Cited by 56,400
Improved metagenomic analysis with Kraken 2
Wood, D. E., Lu, J., & Langmead, B. (2019) · Genome biology · doi:10.1186/s13059-019-1891-0 · Cited by 7,173
Dekker, E., Tanis, P. J., Vleugels, J. L. A., Kasi, P. M., & Wallace, M. B. (2019) · The Lancet · doi:10.1016/s0140-6736(19)32319-0 · Cited by 5,313
Multi-omics of the gut microbial ecosystem in inflammatory bowel diseases
Lloyd-Price, J., Arze, C., Ananthakrishnan, A. N., Schirmer, M., Avila-Pacheco, J., Poon, T. W., Andrews, E., Ajami, N. J., Bonham, K. S., Brislawn, C. J., et al. (2019) · Nature · doi:10.1038/s41586-019-1237-9 · Cited by 3,143
Global burden of colorectal cancer: emerging trends, risk factors and prevention strategies
Keum, N., & Giovannucci, E. L. (2019) · Nature Reviews Gastroenterology & Hepatology · doi:10.1038/s41575-019-0189-8 · Cited by 2,791
Inferring Correlation Networks from Genomic Survey Data
Friedman, J., & Alm, E. J. (2012) · PLoS Computational Biology · doi:10.1371/journal.pcbi.1002687 · Cited by 2,765
Projections of the cost of cancer care in the United States: 2010–2020
Mariotto, A. B., Robin Yabroff, K., Shao, Y., Feuer, E. J., & Brown, M. L. (2011) · JNCI Journal of the National Cancer Institute · doi:10.1093/jnci/djq495 · Cited by 2,657
Multivariable association discovery in population-scale meta-omics studies
Mallick, H., Rahnavard, A., McIver, L. J., Ma, S., Zhang, Y., Nguyen, L. H., Tickle, T. L., Weingart, G., Ren, B., Schwager, E. H., et al. (2021) · PLOS Computational Biology · doi:10.1371/journal.pcbi.1009442 · Cited by 2,596
Bracken: estimating species abundance in metagenomics data
(2016) · doi:10.7717/peerj-cs.104 · Cited by 2,333
Fusobacterium nucleatum Promotes Chemoresistance to Colorectal Cancer by Modulating Autophagy
Yu, T., Guo, F., Yu, Y., Sun, T., Ma, D., Han, J., Qian, Y., Kryczek, I., Sun, D., Nagarsheth, N., et al. (2017) · Cell · doi:10.1016/j.cell.2017.07.008 · Cited by 2,198
Research works printed but not linked: 1
- Janney, A., Powrie, F. & Mann, E. H. Host–microbiota maladaptation in colorectal cancer. Nature 585, 509–517 (2020). · DOI · Paper page
Cited by
Sorted by citations
Items 201–300 of 323
Li, H., Zhang, W., Yan, W., Wang, K., Chen, S., Li, Y., Sheng, A., Shang, A., & Zeng, B. (2026) · Frontiers in Immunology · doi:10.3389/fimmu.2026.1668737 · Cited by 2
Tao, L., Zhao, T., Xu, Y., Chen, W., Zhu, X., Hao, Y., Zhu, L., Jiao, N., Cao, M., Pu, X., et al. (2026) · BMC Microbiology · doi:10.1186/s12866-026-04829-8 · Cited by 3
Self-citationBiointelligent Reframing of Colorectal Cancer
Esawy, M. A., & Reyed, R. M. (2026) · Advances in computational intelligence and robotics book series · doi:10.4018/979-8-3373-3121-8.ch003 · Cited by 2
Cheng, H., & Wong, C. C. (2026) · Molecular Cancer · doi:10.1186/s12943-026-02698-3 · Cited by 2
Sun, B., & Wang, T. (2026) · Frontiers in Immunology · doi:10.3389/fimmu.2026.1768792 · Cited by 3
Zhang, Z. D., Lu, T., Dong, B., Liu, J. Q., Zhang, Y., Li, S., Liu, H., Xin, L., Guan, T., Guo, H., et al. (2026) · Journal of Translational Medicine · doi:10.1186/s12967-026-08403-8 · Cited by 2
Fatemi, N., Jahdkaran, M., Mirbahari, S. N., & Houri, H. (2024) · Expert Reviews in Molecular Medicine · doi:10.1017/erm.2024.31 · Cited by 2
Liu, L., Cao, S., Lin, W., Gao, Z., Yang, L., Zhu, L., Yang, B., Zhang, G., Zhu, R., & Wu, D. (2024) · Gut Microbes · doi:10.1080/19490976.2024.2434029 · Cited by 2
Self-citationBakır-Güngör, B., Temiz, M., Canakcimaksutoglu, B., & Yousef, M. (2025) · Computers in Biology and Medicine · doi:10.1016/j.compbiomed.2025.109813 · Cited by 2
Cancer-associated fungi: An emerging powerful player in cancer immunotherapy
Li, T., Wu, X., Li, X., & Chen, M. (2025) · Biochimica et Biophysica Acta (BBA) - Reviews on Cancer · doi:10.1016/j.bbcan.2025.189287 · Cited by 2
Huang, X., Gao, X., Fan, Y., Wang, D., Chen, X., Qi, X., Yang, Z., Wang, Y.-E., Meng, J., Zou, G., et al. (2025) · Virulence · doi:10.1080/21505594.2025.2530660 · Cited by 3
Self-citationWang, S., Tian, T., Zhao, H., Zhou, M., Zhang, L., Gao, X., & Wang, H. (2025) · Medicine · doi:10.1097/md.0000000000044102 · Cited by 2
Self-citationLiu, L., Lin, W., Cao, S., Yang, L., Gao, S., Jiao, N., Zhu, L., Zhu, R., & Wu, D. (2023) · medRxiv · doi:10.1101/2023.01.31.23285308 · Cited by 2
Self-citationGenos-m: a foundation model for human-associated microbial genomesPreprint
Fang, C., Yang, F., Hou, H., Ren, H., Zhong, H., Xu, H., Zhang, J., Su, J., Cai, J., Yuan, J., et al. (2026) · bioRxiv (Cold Spring Harbor Laboratory) · doi:10.64898/2026.05.21.726868 · Cited by 3
Self-citationAnkylosing Spondylitis - Recent Concepts
Armas, J. B. (2022) · IntechOpen eBooks · doi:10.5772/intechopen.98070 · Cited by 1
Harnessing Nutritional Niches to Explore Fungus‐Animal Symbioses
Shik, J. Z., Dussutour, A., & Licht, H. H. D. F. (2025) · Ecology Letters · doi:10.1111/ele.70176 · Cited by 1
Schroer, H. W., Beghini, F., Garay, J. A. R., Christakis, N. A., & Bosch, D. E. (2026) · mSystems · doi:10.1128/msystems.00305-26 · Cited by 1
Associations and interactions between prokaryotes and other gut biota in non-human primates
Bambi, M., Hauffe, H. C., & Barelli, C. (2025) · Primates · doi:10.1007/s10329-025-01224-1 · Cited by 1
Integration of microbiome and transcriptome information in helping diagnosis of colorectal cancer
He, Z., Zhu, W., Zeng, Y., Li, S.-L., Ma, J., Yang, Z., Wang, H., Zhang, H., Liu, B., & Wang, T. (2025) · Discover Oncology · doi:10.1007/s12672-025-04036-3 · Cited by 1
Self-citationRapid and sensitive detection of Candida albicans using nystatin-functionalized magnetic spheres
Zhao, Z.-Y., Che, Y.-N., Huang, Q., Yang, H., Wang, X., & Dong, L. (2025) · Journal of Chromatography B · doi:10.1016/j.jchromb.2025.124896 · Cited by 1
The application of AI-driven and engineered intratumoral microbes in cancer therapy
Guo, Y., Yu, R., Wang, Z., Chang, J., & Han, L. (2025) · Journal of Translational Medicine · doi:10.1186/s12967-025-07546-4 · Cited by 3
Self-citationGut fungal landscape in colorectal cancer and its cross-kingdom interplay with gut microbial ecology
Wu, Y., Jia, X., Zheng, W., Xiaojian, Y., Shu, X., Qingjie, Z., Lu, Y., & Han, S. (2026) · iScience · doi:10.1016/j.isci.2026.114664 · Cited by 2
Huang, W., Hu, Y. H., Li, Z., Che, J., Wang, S., Yang, Y., Yan, S., Chen, Y., Gao, W., Yang, F., et al. (2026) · Mycology: An International Journal on Fungal Biology · doi:10.1080/21501203.2026.2633942 · Cited by 1
Wei, G., Liu, M., Huang, L., & Chen, C. (2026) · Animal Microbiome · doi:10.1186/s42523-026-00551-y · Cited by 1
Multiomics Research Strategies in Cancer: A Growing and Innovative Field
Du, Z., Liu, X., Lv, Z., Wang, B., Xia, Y., Al-duais, W. A. M., Yan, L., Zhang, F., & Li, Y. (2026) · MedComm · doi:10.1002/mco2.70644 · Cited by 1
Reyed, R. M. (2026) · Advances in computational intelligence and robotics book series · doi:10.4018/979-8-3373-5268-8.ch001 · Cited by 1
Tracking fungal pathogens on cancer: Oncomicrobes or opportunistic bystanders?
Alves, R. M. A., Genechten, W. V., & Dijck, P. V. (2026) · PLoS Pathogens · doi:10.1371/journal.ppat.1014179 · Cited by 1
Liu, J., Zhao, P., Jiang, D., Li, S. B., Jin, C., Xu, D., Wang, X. M., Chen, Y., Tang, B., & Qu, X. (2026) · Gut Microbes · doi:10.1080/19490976.2026.2672791 · Cited by 3
Metagenome analysis reveals multi-kingdom gut microbiota as diagnostic markers for colorectal cancer
Wang, X., Wang, J., Chen, W., Sun, J., Li, J. Z., & Hu, H. (2026) · Frontiers in Microbiology · doi:10.3389/fmicb.2026.1805055 · Cited by 1
Li, Y., Yang, Y., Zhang, X., Huang, Z., Zhang, X., & Wen, J. (2026) · Virulence · doi:10.1080/21505594.2026.2696642 · Cited by 1
Methanogens in Colorectal Cancer: Association or Causation?
Bu, J., Zhu, X., & Zhang, H. (2025) · Gastroenterology · doi:10.1053/j.gastro.2025.03.044 · Cited by 1
Deep Learning Transforms Phage-Host Interaction Discovery from Metagenomic DataPreprint
Yang, Y., Wang, T., Huang, D., Wang, X., Weiss, S. T., Korzenik, J. R., & Liu, Y. (2025) · bioRxiv (Cold Spring Harbor Laboratory) · doi:10.1101/2025.05.26.656232 · Cited by 2
Nile, S. H., Sharma, A., Sharma, A., Kaur, N., Rani, A., Kaur, S., & Kuksal, K. (2025) · Research Square · doi:10.21203/rs.3.rs-8201956/v1 · Cited by 1
Cross-kingdom analysis of microbial communities in Cystic Fibrosis and BronchiectasisPreprint
Cuthbertson, L., Ish-Horowicz, J. S., Felton, I. C., James, P., Turek, E. M., Cox, M. J., Loebinger, M. R., Simmonds, N. J., Filippi, S. L., Moffatt, M., et al. (2022) · bioRxiv (Cold Spring Harbor Laboratory) · doi:10.1101/2022.01.11.475678
Mycobiota Signatures and Colorectal Cancer: A True Association or Not?
Lu, Y. (2022) · Gastroenterology · doi:10.1053/j.gastro.2022.07.065
Gao, W., Gao, X., Zhu, L., Gao, S., Sun, R., Feng, Z., Wu, D., Liu, Z., Zhu, R., & Jiao, N. (2023) · bioRxiv (Cold Spring Harbor Laboratory) · doi:10.1101/2023.02.04.527090
Self-citationEditorial: New insights into the role of mycobiome in diseases
Wu, W., Ding, J., Zheng, X., Wang, H., & Liu, N. (2023) · Frontiers in Cellular and Infection Microbiology · doi:10.3389/fcimb.2023.1240657
Self-citationDong, T., Fan, W., Xie, J., Wang, Y., Chen, H., Wang, M., & Han, X. (2023) · Research Square · doi:10.21203/rs.3.rs-3135172/v1
Chang, Y., Huang, Z., Hou, F., Liu, Y., Wang, L., Wang, Z., Sun, Y., Pan, Z., Tan, Y., Ding, L., et al. (2023) · Figshare · doi:10.6084/m9.figshare.22607620
Self-citationChang, Y., Huang, Z., Hou, F., Liu, Y., Wang, L., Wang, Z., Sun, Y., Pan, Z., Tan, Y., Ding, L., et al. (2023) · Figshare · doi:10.6084/m9.figshare.22607623
Self-citationChang, Y., Huang, Z., Hou, F., Liu, Y., Wang, L., Wang, Z., Sun, Y., Pan, Z., Tan, Y., Ding, L., et al. (2023) · Figshare · doi:10.6084/m9.figshare.22607617
Self-citationChang, Y., Huang, Z., Hou, F., Liu, Y., Wang, L., Wang, Z., Sun, Y., Pan, Z., Tan, Y., Ding, L., et al. (2023) · Figshare · doi:10.6084/m9.figshare.22607611
Self-citationChang, Y., Huang, Z., Hou, F., Liu, Y., Wang, L., Wang, Z., Sun, Y., Pan, Z., Tan, Y., Ding, L., et al. (2023) · Figshare · doi:10.6084/m9.figshare.22607614
Self-citationMetagenomics Insight into the Mycobiome Analysis
Mathuria, A., Chaudhary, A., Sharma, H., & Mani, I. (2024) · Springer eBooks · doi:10.1007/978-981-97-1844-3_7
Analysis of the Clinical Incidence and Correlation between Colorectal Cancer and Microorganisms
Koutouvalis, K., & Bejarano, P. A. (2024) · American Journal of Infectious Diseases · doi:10.3844/ajidsp.2024.11.23
Microbiome and colorectal cancer drug resistance
Miya, T. V., Belancio, V. P., & Dlamini, Z. (2024) · Elsevier eBooks · doi:10.1016/b978-0-443-33475-7.00016-0
Microbiome in Defence Against Cancer
Ramanathan, J. (2024) · Springer eBooks · doi:10.1007/978-3-031-70088-0_17
Ding, N., Kang, Y., Tan, X., Tang, Y., Zhang, Y., & He, Y. (2025) · Discover Oncology · doi:10.1007/s12672-024-01733-3
Yang, Y., Wang, D., Li, L., Song, J., Yang, X., & Li, J. (2025) · Virus Research · doi:10.1016/j.virusres.2025.199569 · Cited by 1
Li, T., Coker, O. O., & Yu, J. Q. (2025) · Gastroenterology · doi:10.1053/j.gastro.2025.04.014
Role of gut commensal fungi in human health and disease
Li, M., Du, Y., & Wang, K. (2025) · Scientia Sinica Vitae · doi:10.1360/ssv-2025-0099
Prospect of interdisciplinary research on gut microbiota and colorectal cancer immunotherapy
Lu, Y., Zhang, Z., Chen, L., Xue, P., Zhang, Y., Li, Y., & Guo, H. (2025) · Critical Reviews in Oncology/Hematology · doi:10.1016/j.critrevonc.2025.104832 · Cited by 1
Core gastric microbiota linked to pathogenesis and preserved across age-stratified cohorts
Huang, W., Chen, Q., Gao, X., Yi, G., Su, Y., Shen, J., Zhang, T., Zhang, H., Chen, Y., Yu, Y., et al. (2026) · Cell Reports Medicine · doi:10.1016/j.xcrm.2026.102905
Zhou, H., Li, H., Deng, G., Wang, X., Zheng, X., Chen, J., Meng, Z., Zheng, Y., Gao, Y., Qian, Z., et al. (2025) · Journal of Advanced Research · doi:10.1016/j.jare.2025.10.065
Self-citationFNatPred: A Data-Driven Approach for Distinguishing Between NAT and Tumor on the Fungal Microbiome
Zhan, B., He, D., Xin, Y., Zhang, Z., & Yan, S. (2025) · IEEE Transactions on Computational Biology and Bioinformatics · doi:10.1109/tcbbio.2025.3639775
Xie, Z., Canalda-Baltrons, A., d’Enfert, C., & Manichanh, C. (2024) · Figshare · doi:10.6084/m9.figshare.26653939
Xie, Z., Canalda-Baltrons, A., d’Enfert, C., & Manichanh, C. (2024) · Figshare · doi:10.6084/m9.figshare.26653942
Zhang, L., Chen, C., Chai, D., Li, C., Qiu, Z., Kuang, T., Liu, L., Deng, W., & Wang, W. (2024) · Figshare · doi:10.6084/m9.figshare.26568856
Chang, Y., Huang, Z., Hou, F., Liu, Y., Wang, L., Wang, Z., Sun, Y., Pan, Z., Tan, Y., Ding, L., et al. (2023) · Figshare · doi:10.6084/m9.figshare.22607608
Self-citationHan, S., Wu, Y., Xingming, Z., Jing, Z., Jinxin, L., Wei, W., & Kefeng, D. (2024) · Figshare · doi:10.6084/m9.figshare.26557913
Xie, Z., Canalda-Baltrons, A., d’Enfert, C., & Manichanh, C. (2024) · Figshare · doi:10.6084/m9.figshare.26653915
Han, S., Wu, Y., Xingming, Z., Jing, Z., Jinxin, L., Wei, W., & Kefeng, D. (2024) · Figshare · doi:10.6084/m9.figshare.26557907
Xie, Z., Canalda-Baltrons, A., d’Enfert, C., & Manichanh, C. (2024) · Figshare · doi:10.6084/m9.figshare.26653912
Xie, Z., Canalda-Baltrons, A., d’Enfert, C., & Manichanh, C. (2024) · Figshare · doi:10.6084/m9.figshare.26653936
Xie, Z., Canalda-Baltrons, A., d’Enfert, C., & Manichanh, C. (2024) · Figshare · doi:10.6084/m9.figshare.26653930
Xie, Z., Canalda-Baltrons, A., d’Enfert, C., & Manichanh, C. (2024) · Figshare · doi:10.6084/m9.figshare.26653921
Zhang, L., Chen, C., Chai, D., Li, C., Qiu, Z., Kuang, T., Liu, L., Deng, W., & Wang, W. (2024) · Figshare · doi:10.6084/m9.figshare.26568850
Zhang, L., Chen, C., Chai, D., Li, C., Qiu, Z., Kuang, T., Liu, L., Deng, W., & Wang, W. (2024) · Figshare · doi:10.6084/m9.figshare.26568862
Han, S., Wu, Y., Xingming, Z., Jing, Z., Jinxin, L., Wei, W., & Kefeng, D. (2024) · Figshare · doi:10.6084/m9.figshare.26557901
Xie, Z., Canalda-Baltrons, A., d’Enfert, C., & Manichanh, C. (2024) · Figshare · doi:10.6084/m9.figshare.26653909
Xie, Z., Canalda-Baltrons, A., d’Enfert, C., & Manichanh, C. (2024) · Figshare · doi:10.6084/m9.figshare.26653933
Xie, Z., Canalda-Baltrons, A., d’Enfert, C., & Manichanh, C. (2024) · Figshare · doi:10.6084/m9.figshare.26653927
Xie, Z., Canalda-Baltrons, A., d’Enfert, C., & Manichanh, C. (2024) · Figshare · doi:10.6084/m9.figshare.26653924
Xie, Z., Canalda-Baltrons, A., d’Enfert, C., & Manichanh, C. (2024) · Figshare · doi:10.6084/m9.figshare.26653918
Zhang, L., Chen, C., Chai, D., Li, C., Qiu, Z., Kuang, T., Liu, L., Deng, W., & Wang, W. (2024) · Figshare · doi:10.6084/m9.figshare.26568853
Xie, Z., Canalda-Baltrons, A., d’Enfert, C., & Manichanh, C. (2024) · Figshare · doi:10.6084/m9.figshare.26653948
Han, S., Wu, Y., Xingming, Z., Jing, Z., Jinxin, L., Wei, W., & Kefeng, D. (2024) · Figshare · doi:10.6084/m9.figshare.26557904
Zhang, L., Chen, C., Chai, D., Li, C., Qiu, Z., Kuang, T., Liu, L., Deng, W., & Wang, W. (2024) · Figshare · doi:10.6084/m9.figshare.26568841
Zhang, L., Chen, C., Chai, D., Li, C., Qiu, Z., Kuang, T., Liu, L., Deng, W., & Wang, W. (2024) · Figshare · doi:10.6084/m9.figshare.26568868
Zhang, L., Chen, C., Chai, D., Li, C., Qiu, Z., Kuang, T., Liu, L., Deng, W., & Wang, W. (2024) · Figshare · doi:10.6084/m9.figshare.26568844
Xie, Z., Canalda-Baltrons, A., d’Enfert, C., & Manichanh, C. (2024) · Figshare · doi:10.6084/m9.figshare.26653951
Zhang, L., Chen, C., Chai, D., Li, C., Qiu, Z., Kuang, T., Liu, L., Deng, W., & Wang, W. (2024) · Figshare · doi:10.6084/m9.figshare.26568865
Han, S., Wu, Y., Xingming, Z., Jing, Z., Jinxin, L., Wei, W., & Kefeng, D. (2024) · Figshare · doi:10.6084/m9.figshare.26557910
Xie, Z., Canalda-Baltrons, A., d’Enfert, C., & Manichanh, C. (2024) · Figshare · doi:10.6084/m9.figshare.26653954
Zhang, L., Chen, C., Chai, D., Li, C., Qiu, Z., Kuang, T., Liu, L., Deng, W., & Wang, W. (2024) · Figshare · doi:10.6084/m9.figshare.26568838
Zhang, L., Chen, C., Chai, D., Li, C., Qiu, Z., Kuang, T., Liu, L., Deng, W., & Wang, W. (2024) · Figshare · doi:10.6084/m9.figshare.26568847
Xie, Z., Canalda-Baltrons, A., d’Enfert, C., & Manichanh, C. (2024) · Figshare · doi:10.6084/m9.figshare.26653906
Dinu, L.-D., Vamanu, E., & Avram, I. (2025) · Interdisciplinary biotechnological advances · doi:10.1007/978-981-95-2104-3_7
Unveiling the microbial world: A comprehensive overview of single-microbe genomics
Xie, J., Wang, K., Li, Y., Wu, W., & Shi, D. (2024) · Elsevier eBooks · doi:10.1016/b978-0-443-14064-8.00026-6
Factoring fungi into the One Health conversation
Zhang, T.-Y., Lu, E.-P., Lin, Y., Zhou, J.-A., Chen, Y., Qi, W., Guo, J. F., Cheong, I. H., Wong, K. H., Kozlakidis, Z., et al. (2026) · Fundamental Research · doi:10.1016/j.fmre.2026.01.006
Self-citationZhang, J., Deng, J., He, B., Wang, H., lin, D., Li, J., Zhong, Q., Chen, Y., Liao, S., Wang, J., et al. (2026) · BMC Microbiology · doi:10.1186/s12866-025-04578-0
Self-citationBiedroń, P., Skrzypek, A., Hutkowski, M., Zbrożek, M., Chwostek, Z., Kosiarski, B., Markowicz, P., Maruchniak, H., Marzec, W., & Biłyk, K. (2026) · International Journal of Innovative Technologies in Social Science · doi:10.31435/ijitss.1(49).2026.4808
The hidden mycobiome: emerging role in anticancer immunotherapy
Peng, Z.-C., Liu, X.-Y., Liu, Q.-Y., Lü, W., Jin, C.-Z., Zhang, T.-Y., & Liu, N.-N. (2026) · Mycology: An International Journal on Fungal Biology · doi:10.1080/21501203.2026.2640728
Self-citationMetabolic specialization structures gut bacterial niches and drives colorectal cancer progressionPreprint
Xu, L.-L., Seelbinder, B., Zhou, Z., Kuo, T.-H., Sae-Ong, T., Treibmann, S., Damerell, V., Brobeil, A., Richter, K. M., Mueller, M., et al. (2026) · bioRxiv (Cold Spring Harbor Laboratory) · doi:10.64898/2026.03.21.712571 · Cited by 1
Colorectal cancer therapy and nutrition: From ultra-processed consumption to metabolic reprogramming
LIMA, R. S. P., Sousa, J. D. S., Neres, M. S. D. O., de Sousa, D. J. M., Martins, J. A., Pereira, I. C., da Silva, A. C. A., Severo, J. S., Torres‐Leal, F. L., & da Silva, M. T. B. (2026) · World Journal of Gastrointestinal Oncology · doi:10.4251/wjgo.v18.i4.115511 · Cited by 1
Cheng, J., Han, Z., Zhang, X., Yu, J., Luo, C., & Chen, X. S. (2026) · Research Square · doi:10.21203/rs.3.rs-9371117/v1
Self-citationThe association of fungal infection in cervical cancer: a systematic review and meta-analysis
Wu, Y., Zhang, Y., Qian, X., & Li, Y. (2026) · BMC Women s Health · doi:10.1186/s12905-026-04451-w
Fungi and colorectal cancer: from dysregulation to clinical translation
Wu, Y., Han, S., Jing, Z., & Min, F. (2026) · Gut Pathogens · doi:10.1186/s13099-026-00835-3
Hillman, T. (2026) · Journal of Clinical Pharmacy and Therapeutics · doi:10.1155/jcpt/9727196
Metadata
- Authors
- Liu, N.-N., Jiao, N., Tan, J.-C., Wang, Z., Wu, D., Wang, A.-J., Chen, J., Tao, L., Zhou, C., Fang, W., Cheong, I. H., Pan, W., Liao, W., Kozlakidis, Z., Heeschen, C., Moore, G. G., Zhu, L., Chen, X., Zhang, G., Zhu, R., & Wang, H.
- Affiliations
- Shanghai Jiao Tong University (CN)
- Sun Yat-sen University (CN)
- Shanghai University of Traditional Chinese Medicine (CN)
- Tongji University (CN)
- Chinese Academy of Sciences (CN)
- Second Military Medical University (CN)
- Centre international de recherche sur le cancer (FR)
- Agricultural Research Service (US)
- Fudan University (CN)
- Corresponding author
- Zhu, Lixin
- Chen, Xingdong
- Zhang, Guoqing
- Zhu, Ruixin
- Wang, Hui
- ORCID
- Venue
- Nature Microbiology
- Published
- 2022-01-27
- Volume
- 7
- Issue
- 2
- Pages
- 238-250
- ISSN
- 2058-5276 (ISSN-L)
- PMC
- PMC8813618
- OpenAlex
- W4210569788
- Cited by
- 306
- References
- 51
- Citations by year
- 2026: 69 · 2025: 76 · 2024: 78 · 2023: 64 · 2022: 19
- FWCI
- 20.80
- Type
- journal article
- Language
- en
- Open access
- hybrid
- doi.org
- Locations
- Nature Microbiology (publishedVersion, cc-by)
- PubMed Central (publishedVersion, cc-by)
- PubMed (publishedVersion)
- Funders
- National Natural Science Foundation of China (31900129)
- China Postdoctoral Science Foundation
- Topics
- Life Sciences › Biochemistry, Genetics and Molecular Biology › Molecular Biology › Gut microbiota and health
- Health Sciences › Medicine › Infectious Diseases › Clostridium difficile and Clostridium perfringens research
- Health Sciences › Dentistry › Periodontics › Oral microbiology and periodontitis research
- Keywords
- colorectal cancer, gut microbiota, fungal-bacterial interactions, fungal biomarkers, archaea, viral markers, cancer diagnosis, diagnostic biomarkers, co-occurrence networks, Talaromyces islandicus, Clostridium saccharobutylicum, D-amino acid metabolism, butanoate metabolism, functional metagenomics, cross-cohort validation
- MeSH terms
- Gastrointestinal Microbiome, Adult, Aged, Bacteria, Feces, Female, Fungi, Humans, Male, Middle Aged, Viruses, Colorectal Neoplasms, Cohort Studies, Biomarkers, Sequence Analysis, DNA, Metabolic Networks and Pathways, Metagenome, Microbial Interactions, Dysbiosis
About these checks
Registry, retraction, Cites and statistics results are computed, not judged, with one exception: a printed reference that no index lists is read once by a model before it counts as a citation error. Claims are extracted by a model and kept only when their quote appears verbatim in the text; each cited source is then checked, with a model’s help, for whether it says what the claim relies on. Those verdicts can be wrong — read the claim’s quote and the cited source before relying on one.
Statistics and arithmetic are recomputed, not judged.
Confidence bands are shown only for fields calibrated on our annotated test set. None is calibrated yet, so no band is shown.
What counts as a claim ›How we measure confidence ›How we check this ›
Are you an author, or do you see a problem with this page? Request a review
