

The DOI matches its Crossref record; 47 of the 47 references it cites were found in a registry or an index.
A new coronavirus associated with human respiratory disease in China
Open accessAbstract
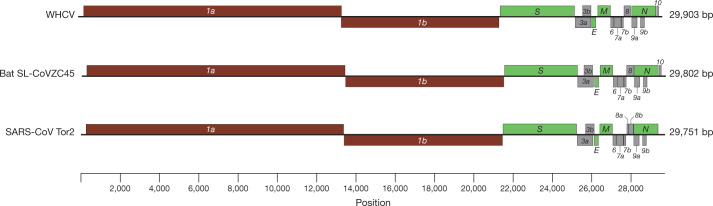
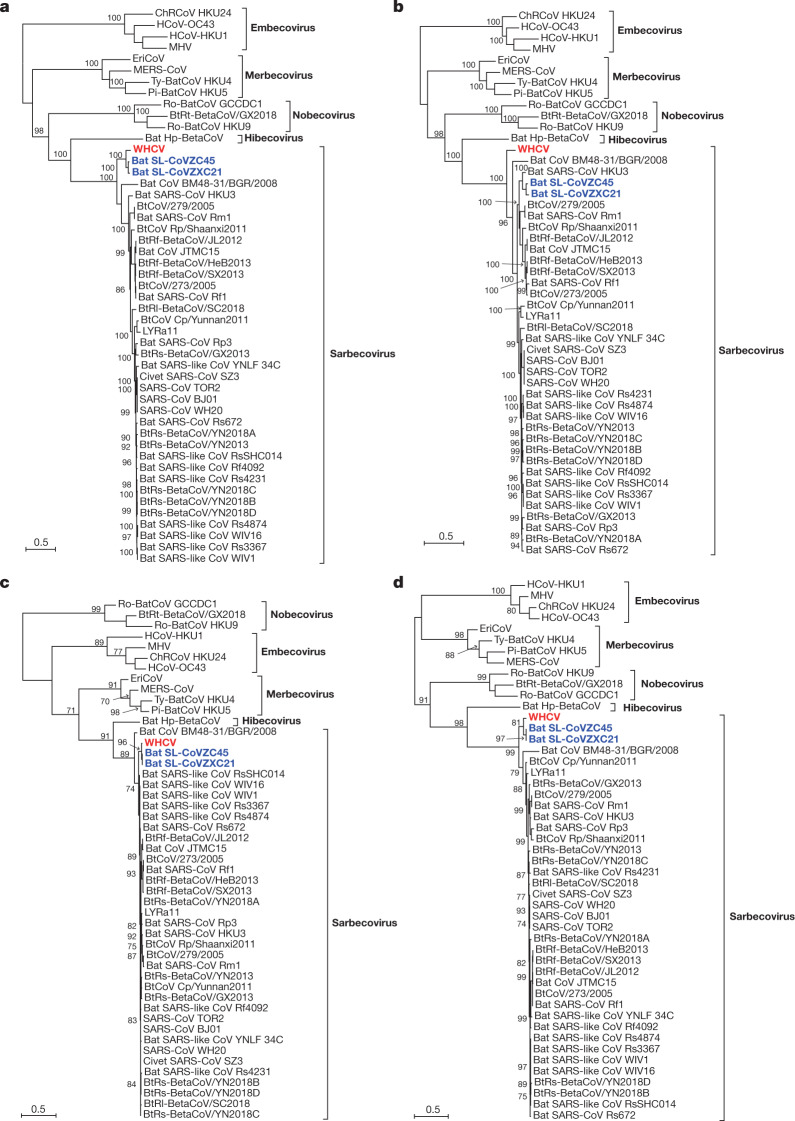
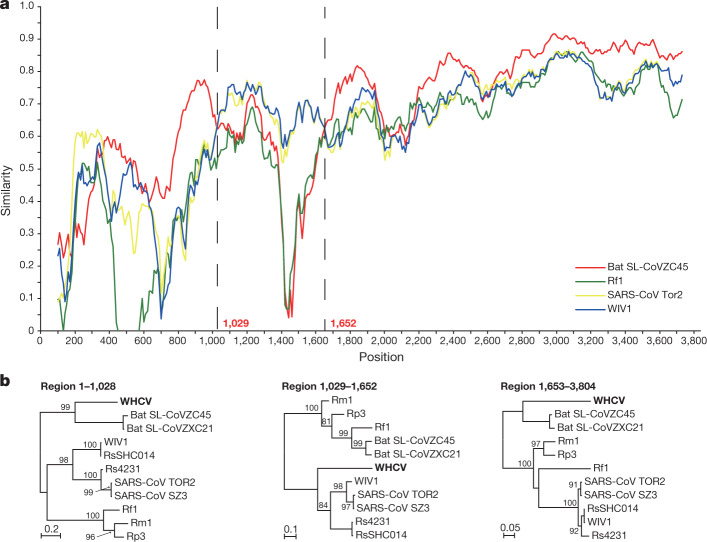
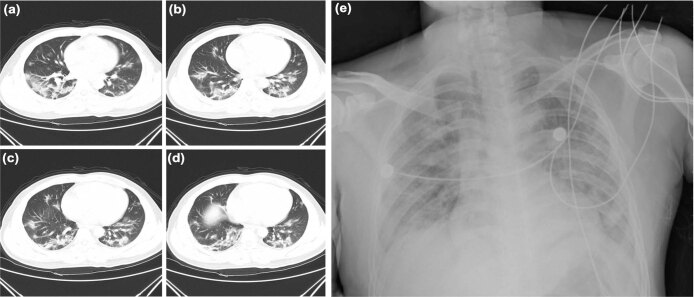
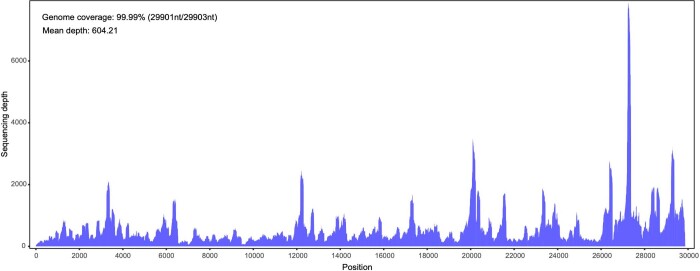
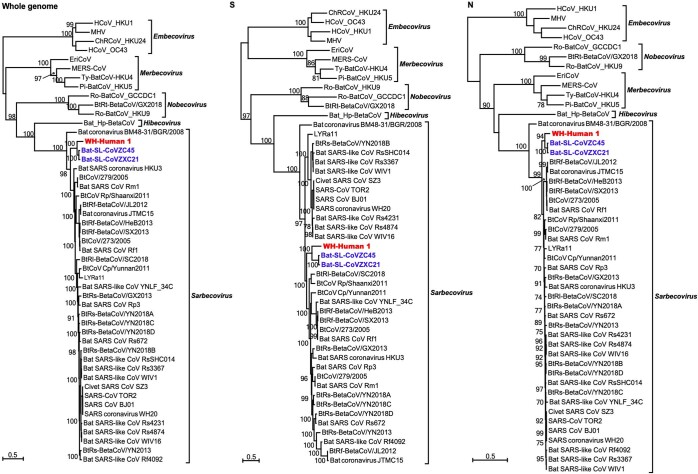
Emerging infectious diseases, such as severe acute respiratory syndrome (SARS) and Zika virus disease, present a major threat to public health 1–3 . Despite intense research efforts, how, when and where new diseases appear are still a source of considerable uncertainty. A severe respiratory disease was recently reported in Wuhan, Hubei province, China. As of 25 January 2020, at least 1,975 cases had been reported since the first patient was hospitalized on 12 December 2019. Epidemiological investigations have suggested that the outbreak was associated with a seafood market in Wuhan. Here we study a single patient who was a worker at the market and who was admitted to the Central Hospital of Wuhan on 26 December 2019 while experiencing a severe respiratory syndrome that included fever, dizziness and a cough. Metagenomic RNA sequencing 4 of a sample of bronchoalveolar lavage fluid from the patient identified a new RNA virus strain from the family Coronaviridae , which is designated here ‘WH-Human 1’ coronavirus (and has also been referred to as ‘2019-nCoV’). Phylogenetic analysis of the complete viral genome (29,903 nucleotides) revealed that the virus was most closely related (89.1% nucleotide similarity) to a group of SARS-like coronaviruses (genus Betacoronavirus, subgenus Sarbecovirus) that had previously been found in bats in China 5 . This outbreak highlights the ongoing ability of viral spill-over from animals to cause severe disease in humans.
Overview
The claims and statistics of this paper haven’t been checked yet.
Run the check — free, no account needed. It reads the open-access text and checks the sources it cites.
Integrity signals
Registry
Cites
Statistics
Figures
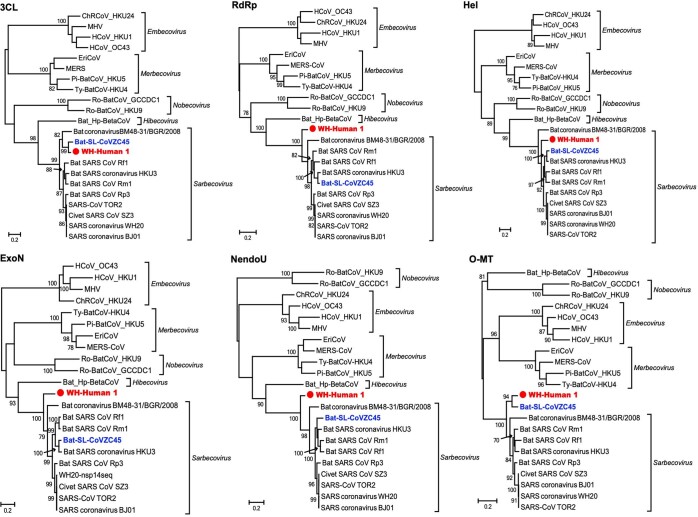
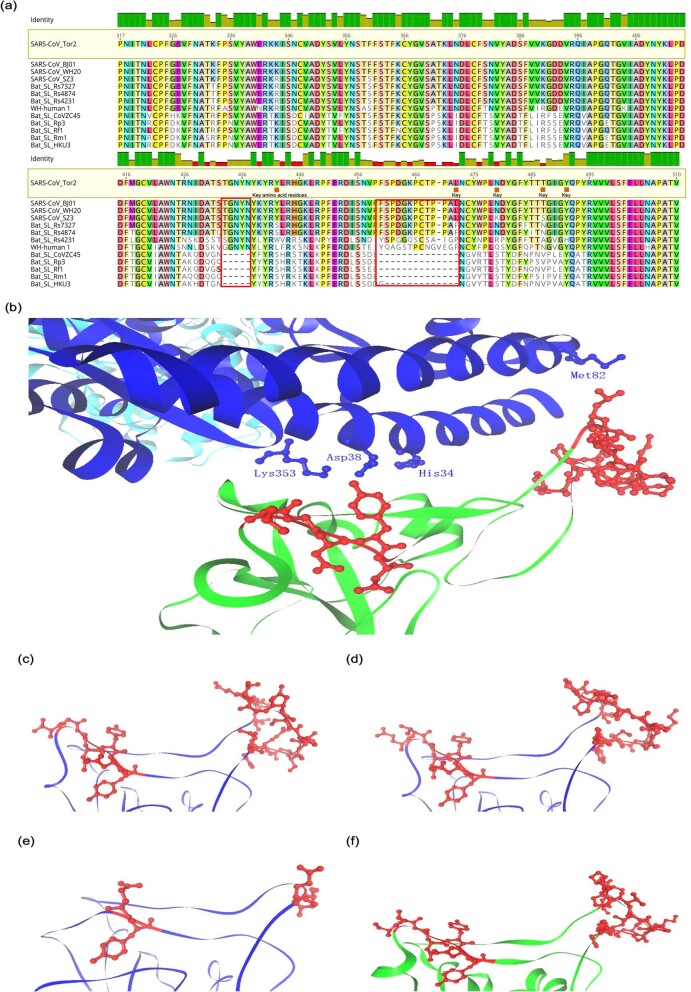
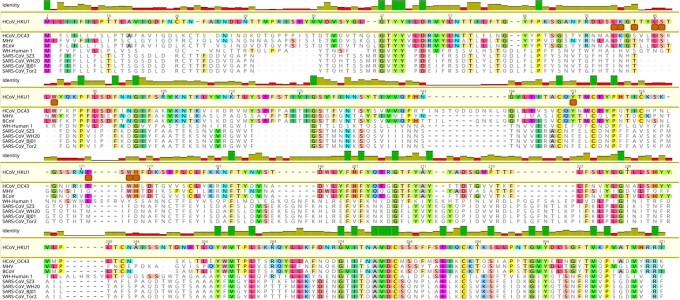
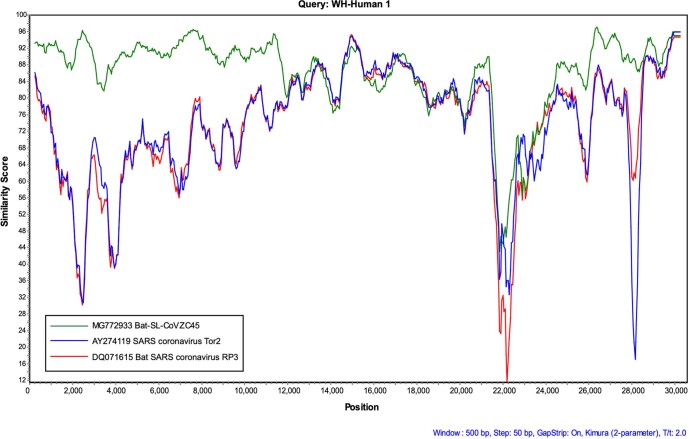
Verification
Claims the paper makes
The claims and statistics of this paper haven’t been checked yet.
Run the check — free, no account needed. It reads the open-access text and checks the sources it cites.
Claims other papers make about this one
Each is checked against this paper’s own text: does it say what the citing paper says it does?
In the citing paper
“Alternatively, the ongoing COVID-19 global pandemic has the potential to dramatically affect mortality among the prevalent IBD population96.”
From The four epidemiological stages in the global evolution of inflammatory bowel disease (2021) · cites this paper as [96]
In the citing paper
“Both vaccines encode a stabilized ectodomain version of the S protein derived from the Wuhan-Hu-1 variant isolated in December 2019 (43)”
From mRNA vaccination boosts cross-variant neutralizing antibodies elicited by SARS-CoV-2 infection (2021) · cites this paper as [43]
In the citing paper
“Opportunistic oral bacteria, including Veillonella parvula, Capnocytophaga gingivalis, Leptotrichia buccalis, and Prevotella melaninogenia were overrepresented in bronchoalveolar lavage fluid of patients with COVID‐19, suggesting that the oral cavity may serve as a reservoir of bacteria implicated in coinfection with SARS‐CoV‐2 in COVID‐19.”
From The oral microbiome: Role of key organisms and complex networks in oral health and disease (2021) · cites this paper as [310]
Self-check
Percentages, sums and reported differences re-computed from the paper’s own numbers.
The self-check needs the paper’s full text.
Citations
Cites
Trimmomatic: a flexible trimmer for Illumina sequence data
Bolger, A. M., Lohse, M., & Usadel, B. (2014) · Bioinformatics · doi:10.1093/bioinformatics/btu170 · Cited by 65,548
The Sequence Alignment/Map format and SAMtools
Li, H., Handsaker, B., Wysoker, A., Fennell, T., Ruan, J., Homer, N., Marth, G., Abecasis, G., Durbin, R., & 1000 Genome Project Data Processing Subgroup (2009) · Bioinformatics · doi:10.1093/bioinformatics/btp352 · Cited by 62,041
Fast gapped-read alignment with Bowtie 2
Langmead, B., & Salzberg, S. L. (2012) · Nature Methods · doi:10.1038/nmeth.1923 · Cited by 56,400
MAFFT Multiple Sequence Alignment Software Version 7: Improvements in Performance and Usability
Katoh, K., & Standley, D. M. (2013) · Molecular Biology and Evolution · doi:10.1093/molbev/mst010 · Cited by 46,209
MUSCLE: multiple sequence alignment with high accuracy and high throughput
Edgar, R. C. (2004) · Nucleic Acids Research · doi:10.1093/nar/gkh340 · Cited by 44,662
Tamura, K., Peterson, D., Peterson, N., Stecher, G., Nei, M., & Kumar, S. (2011) · Molecular Biology and Evolution · doi:10.1093/molbev/msr121 · Cited by 40,207
A pneumonia outbreak associated with a new coronavirus of probable bat origin
Zhou, P., Yang, X.-L., Wang, X.-G., Hu, B., Zhang, L., Zhang, W., Si, H.-R., Zhu, Y., Li, B., Huang, C.-L., et al. (2020) · Nature · doi:10.1038/s41586-020-2012-7 · Cited by 21,969
Self-citationFull-length transcriptome assembly from RNA-Seq data without a reference genome
Grabherr, M. G., Haas, B. J., Yassour, M., Levin, J. Z., Thompson, D. A., Amit, I., Adiconis, X., Fan, L., Raychowdhury, R., Zeng, Q., et al. (2011) · Nature Biotechnology · doi:10.1038/nbt.1883 · Cited by 21,201
Guindon, S., Dufayard, J.-F., Lefort, V., Anisimova, M., Hordijk, W., & Gascuel, O. (2010) · Systematic Biology · doi:10.1093/sysbio/syq010 · Cited by 18,376
SWISS-MODEL: homology modelling of protein structures and complexes
Waterhouse, A. M., Bertoni, M., Bienert, S., Studer, G., Tauriello, G., Gumienny, R., Heer, F. T., de Beer, T., Rempfer, C., Bordoli, L., et al. (2018) · Nucleic Acids Research · doi:10.1093/nar/gky427 · Cited by 13,248
Li, D., Liu, C.-M., Luo, R., Sadakane, K., & Lam, T. (2015) · Bioinformatics · doi:10.1093/bioinformatics/btv033 · Cited by 10,133
Identification of a novel coronavirus in patients with severe acute respiratory syndrome
Drosten, C., Günther, S., Preiser, W., van der Werf, S., Brodt, H.-R., Becker, S., Rabenau, H., Panning, M., Kolesnikova, L., Fouchier, R. A. M., et al. (2003) · New England Journal of Medicine · doi:10.1056/nejmoa030747 · Cited by 4,574
Lole, K. S., Bollinger, R. C., Paranjape, R., Gadkari, D. A., Kulkarni, S., Novak, N. G., Ingersoll, R., Sheppard, H. W., & Ray, S. C. (1999) · Journal of Virology · doi:10.1128/jvi.73.1.152-160.1999 · Cited by 2,700
Bats Are Natural Reservoirs of SARS-Like Coronaviruses
Li, W., Shi, Z., Yu, M., Ren, W., Smith, C. S., Epstein, J. H., Wang, H., Crameri, G. S., Hú, Z., Zhang, H., et al. (2005) · Science · doi:10.1126/science.1118391 · Cited by 2,571
Structure of SARS Coronavirus Spike Receptor-Binding Domain Complexed with Receptor
Li, F., Li, W., Farzan, M., & Harrison, S. C. (2005) · Science · doi:10.1126/science.1116480 · Cited by 2,035
Identification of a new human coronavirus
van der Hoek, L., Pyrć, K., Jebbink, M. F., Vermeulen-Oost, W., Berkhout, R. J. M., Wolthers, K. C., Dillen, P. M. E. W., Kaandorp, J. C., Spaargaren, J., & Berkhout, B. (2004) · Nature Medicine · doi:10.1038/nm1024 · Cited by 1,868
Origins of major human infectious diseases
Wolfe, N. D., Dunavan, C. P., & Diamond, J. (2007) · Nature · doi:10.1038/nature05775 · Cited by 1,867
Isolation and characterization of a bat SARS-like coronavirus that uses the ACE2 receptor
Ge, X.-Y., Li, J.-L., Yang, X.-L., Chmura, A. A., Zhu, G., Epstein, J. H., Mazet, J. K., Hu, B., Zhang, W., Peng, C., et al. (2013) · Nature · doi:10.1038/nature12711 · Cited by 1,778
Self-citationRedefining the invertebrate RNA virosphere
Shī, M., Lin, X., Tian, J.-H., Chen, L., Chen, X., Li, C., Qin, X.-C., Li, J., Cao, J., Eden, J., et al. (2016) · Nature · doi:10.1038/nature20167 · Cited by 1,649
Self-citationRDP3: a flexible and fast computer program for analyzing recombination
Martin, D. P., Lemey, P., Lott, M. C., Moulton, V., Posada, D., & Lefeuvre, P. (2010) · Bioinformatics · doi:10.1093/bioinformatics/btq467 · Cited by 1,626
Severe acute respiratory syndrome coronavirus-like virus in Chinese horseshoe bats
Lau, S. K. P., Woo, P. C. Y., Li, K. S. M., Huang, Y. P., Tsoi, H., Wong, B. H. L., Wong, S. S. Y., Leung, S.-Y., Chan, K., & Yuen, K. (2005) · Proceedings of the National Academy of Sciences · doi:10.1073/pnas.0506735102 · Cited by 1,561
Woo, P. C. Y., Lau, S. K. P., Chu, C., Chan, K., Tsoi, H., Huang, Y. P., Wong, B. H. L., Poon, R. W., Cai, J. J., Luk, W., et al. (2004) · Journal of Virology · doi:10.1128/jvi.79.2.884-895.2005 · Cited by 1,525
RNA-Seq gene expression estimation with read mapping uncertainty
Li, B., Ruotti, V., Stewart, R. M., Thomson, J. A., & Dewey, C. N. (2010) · Bioinformatics · doi:10.1093/bioinformatics/btp692 · Cited by 1,198
Hu, B., Zeng, L., Yang, X., Ge, X.-Y., Zhang, W., Li, B., Xie, J., Shen, X.-R., Zhang, Y.-Z., Wang, N., et al. (2017) · PLoS Pathogens · doi:10.1371/journal.ppat.1006698 · Cited by 956
Self-citationA SARS-like cluster of circulating bat coronaviruses shows potential for human emergence
Menachery, V. D., Yount, B. L., Debbink, K. M., Agnihothram, S., Gralinski, L. E., Plante, J. A., Graham, R. L., Scobey, T., Ge, X., Donaldson, E., et al. (2015) · Nature Medicine · doi:10.1038/nm.3985 · Cited by 901
A New Virus Isolated from the Human Respiratory Tract.
Hamre, D. M., & Procknow, J. J. (1966) · Experimental Biology and Medicine · doi:10.3181/00379727-121-30734 · Cited by 888
The evolutionary history of vertebrate RNA viruses
Shī, M., Lin, X., Chen, X., Tian, J.-H., Chen, L., Li, K., Wang, W., Eden, J., Shen, J., Liu, L., et al. (2018) · Nature · doi:10.1038/s41586-018-0012-7 · Cited by 763
Self-citationZika virus in Brazil and macular atrophy in a child with microcephaly
Ventura, C. V. O. C., Maia, M., Bravo-Filho, V., Gois, A. L., & Belfort, R. (2016) · The Lancet · doi:10.1016/s0140-6736(16)00006-4 · Cited by 566
Bermingham, A., Chand, M. A., Brown, C. S., Aarons, E., Tong, C. Y. W., Langrish, C., Höschler, K., Brown, K. E., Galiano, M., Myers, R. E., et al. (2012) · Eurosurveillance · doi:10.2807/ese.17.40.20290-en · Cited by 468
Hulswit, R. J. G., Lang, Y., Bakkers, M. J. G., Li, W., Li, Z., Schouten, A., Ophorst, B., van Kuppeveld, F. J. M., Boons, G., Bosch, B., et al. (2019) · Proceedings of the National Academy of Sciences · doi:10.1073/pnas.1809667116 · Cited by 384
Genomic characterization and infectivity of a novel SARS-like coronavirus in Chinese bats
Hu, D., Zhu, C.-Q., Ai, L.-L., He, T., Wang, Y., Ye, F., Yang, L., Ding, C., Zhu, X.-H., Lv, R., et al. (2018) · Emerging Microbes and Infections · doi:10.1038/s41426-018-0155-5 · Cited by 281
McIntosh, K., Becker, W. B., & Chanock, R. M. (1967) · Proceedings of the National Academy of Sciences · doi:10.1073/pnas.58.6.2268 · Cited by 278
Yang, X., Hu, B., Wang, B., Wang, M., Zhang, Q., Zhang, W., Wu, L., Ge, X., Zhang, Y., Daszak, P., et al. (2015) · Journal of Virology · doi:10.1128/jvi.02582-15 · Cited by 250
Self-citationLi, C., Harmanus, C., Zhu, D., Meng, X., Wang, S., Duan, J., Liu, S., Fu, C., Zhou, P., Liu, R., et al. (2018) · Emerging Microbes & Infections · doi:10.1038/s41426-018-0211-1 · Cited by 246
Association of COVID-19 pandemic with meteorological parameters over Singapore
Pani, S. K., Lin, N., & Babu, S. R. (2020) · The Science of The Total Environment · doi:10.1016/j.scitotenv.2020.140112 · Cited by 235
Hwang, W. C., Lin, Y., Santelli, E., Sui, J., Jaroszewski, L., Stec, B., Farzan, M., Marasco, W. A., & Liddington, R. (2006) · Journal of Biological Chemistry · doi:10.1074/jbc.m603275200 · Cited by 195
Ren, W., Qu, X., Li, W., Han, Z., Yu, M., Zhou, P., Zhang, S., Wang, L., Deng, H., & Shi, Z. (2007) · Journal of Virology · doi:10.1128/jvi.01085-07 · Cited by 162
Discovery, diversity and evolution of novel coronaviruses sampled from rodents in China
Wang, W., Lin, X.-D., Guo, W.-P., Zhou, R., Wang, M.-R., Wang, C.-Q., Ge, S., Mei, S.-H., Li, M., Shī, M., et al. (2014) · Virology · doi:10.1016/j.virol.2014.10.017 · Cited by 139
Self-citationExtensive diversity of coronaviruses in bats from China
Lin, X.-D., Wang, W., Hao, Z.-Y., Wang, Z.-X., Guo, W.-P., Guan, X.-Q., Wang, M.-R., Wang, H., Zhou, R., Li, M., et al. (2017) · Virology · doi:10.1016/j.virol.2017.03.019 · Cited by 108
Self-citationNipah Virus Sequences from Humans and Bats during Nipah Outbreak, Kerala, India, 2018
Yadav, P. D., Shete, A. M., Kumar, G. A., et al. (2019) · Emerging infectious diseases · doi:10.3201/eid2505.181076 · Cited by 104
Pangolins Harbor SARS-CoV-2-Related Coronaviruses
Han, G. (2020) · Trends in Microbiology · doi:10.1016/j.tim.2020.04.001 · Cited by 68
Wang, W., Lin, X., Liao, Y. Y., Guan, X.-Q., Guo, W., Xing, J.-G., Holmes, E. C., & Zhāng, Y.-Z. (2017) · Journal of Virology · doi:10.1128/jvi.00764-17 · Cited by 51
Self-citationMcMullan, L. K., Flint, M., Chakrabarti, A. K., et al. (2019) · The Lancet Infectious Diseases · doi:10.1016/s1473-3099(19)30291-9 · Cited by 50
Detection and characterization of diverse alpha- and betacoronaviruses from bats in China
Xu, L., Zhang, F., Yang, W., Jiang, T., Lu, G., He, B., Li, X., Hu, T., Chen, G., Feng, Y., et al. (2016) · Virologica Sinica · doi:10.1007/s12250-016-3727-3 · Cited by 34
Self-citationAkar, A. R. (2020) · Turkish Journal of Thoracic and Cardiovascular Surgery · doi:10.5606/tgkdc.dergisi.2020.09293 · Cited by 12
Can We Reduce Mortality of COVID-19 if We do Better in Glucose Control?
Deng, M., Jiang, L., Ren, Y., & Liao, J. (2020) · Medicine in Drug Discovery · doi:10.1016/j.medidd.2020.100048 · Cited by 6
Han, Y., Li, Y., & Ma, C. (2020) · PubMed · doi:10.11909/j.issn.1671-5411.2020.05.001 · Cited by 5
Research works printed but not linked: 1
- Gorbalenya, A. E. Severe acute respiratory syndrome-related coronavirus — the species and its viruses, a statement of the Coronavirus Study Group. Preprint at bioRxiv https://doi.org/10.1101/2020.02.07.93786 (2020). · DOI
Cited by
Sorted by citations
Cryo-EM structure of the 2019-nCoV spike in the prefusion conformation
Wrapp, D., Wang, N., Corbett, K. S., Goldsmith, J. A., Hsieh, C.-L., Abiona, O., Graham, B. S., & McLellan, J. S. (2020) · Science · doi:10.1126/science.abb2507 · Cited by 8,897
Pathological findings of COVID-19 associated with acute respiratory distress syndrome
Xu, Z., Shi, L., Wang, Y., Zhang, J., Huang, L., Zhang, C., Liu, S., Zhao, P., Liu, H., Zhu, L., et al. (2020) · The Lancet Respiratory Medicine · doi:10.1016/s2213-2600(20)30076-x · Cited by 8,545
Structure of the SARS-CoV-2 spike receptor-binding domain bound to the ACE2 receptor
Lan, J., Ge, J., Yu, J., Shan, S., Zhou, H., Fan, S., Zhang, Q., Shi, X., Wang, Q., Zhang, L., et al. (2020) · Nature · doi:10.1038/s41586-020-2180-5 · Cited by 5,983
Self-citationThe proximal origin of SARS-CoV-2
Andersen, K. G., Rambaut, A., Lipkin, W. I., Holmes, E. C., & Garry, R. F. (2020) · Nature Medicine · doi:10.1038/s41591-020-0820-9 · Cited by 5,081
Self-citationCharacteristics of SARS-CoV-2 and COVID-19
Hu, B., Guo, H., Zhou, P., & Shi, Z.-L. (2021) · Nature Reviews Microbiology · doi:10.1038/s41579-020-00459-7 · Cited by 5,291
Metadata
- Authors
- Wu, F., Zhao, S., Yu, B., Chen, Y.-M., Wang, W., Song, Z.-G., Hu, Y., Tao, Z.-W., Tian, J.-H., Pei, Y.-Y., Yuan, M.-L., Zhang, Y.-L., Dai, F.-H., Liu, Y., Wang, Q.-M., Zheng, J.-J., Xu, L., Holmes, E. C., & Zhang, Y.-Z.
- Affiliations
- Fudan University (CN)
- Wuhan Center for Disease Control and Prevention (CN)
- Chinese Center For Disease Control and Prevention (CN)
- Central Hospital of Wuhan (CN)
- The University of Sydney (AU)
- Corresponding author
- Zhang, Yu-Ling
- Venue
- Nature
- Published
- 2020-02-03
- Volume
- 579
- Issue
- 7798
- Pages
- 265-269
- ISSN
- 0028-0836 (ISSN-L)
- 1476-4687
- PMC
- PMC7094943
- OpenAlex
- W3003217347
- Cited by
- 11,688
- References
- 47
- Citations by year
- 2026: 223 · 2025: 481 · 2024: 839 · 2023: 1294 · 2022: 2184 · 2021: 3232 · 2020: 3416
- FWCI
- 333.80
- Type
- journal article
- Language
- en
- Update notices
- correction (2020-04-02)
- Open access
- hybrid
- doi.org
- Locations
- Nature (publishedVersion, cc-by)
- PubMed Central (publishedVersion, cc-by)
- PubMed (publishedVersion)
- LA Referencia (Red Federada de Repositorios Institucionales de Publicaciones Científicas) (publishedVersion, cc-by)
- RePEc: Research Papers in Economics (submittedVersion)
- LA Referencia (Red Federada de Repositorios Institucionales de Publicaciones Científicas) (submittedVersion, cc-by)
- The Sydney eScholarship Repository (The University of Sydney) (submittedVersion)
- Funders
- National Natural Science Foundation of China (81861138003, 31930001)
- Australian Research Council (FL170100022)
- Topics
- Health Sciences › Medicine › Infectious Diseases › SARS-CoV-2 and COVID-19 Research
- Life Sciences › Agricultural and Biological Sciences › Animal Science and Zoology › Animal Virus Infections Studies
- Health Sciences › Medicine › Public Health, Environmental and Occupational Health › Zoonotic diseases and public health
- Keywords
- SARS-CoV-2, novel coronavirus, SARS-like coronaviruses, Betacoronavirus, Sarbecovirus, SARS, animal-to-human transmission, Wuhan, phylogenetic analysis, viral genome, emerging infectious diseases
- MeSH terms
- Whole Genome Sequencing, Betacoronavirus, COVID-19, SARS-CoV-2, Adult, China, Humans, Lung, Male, Phylogeny, Pneumonia, Viral, Recombination, Genetic, RNA, Viral, Tomography, X-Ray Computed, Genome, Viral, Coronavirus Infections, Communicable Diseases, Emerging, Severe Acute Respiratory Syndrome
About these checks
Registry, retraction, Cites and statistics results are computed, not judged, with one exception: a printed reference that no index lists is read once by a model before it counts as a citation error. Claims are extracted by a model and kept only when their quote appears verbatim in the text; each cited source is then checked, with a model’s help, for whether it says what the claim relies on. Those verdicts can be wrong — read the claim’s quote and the cited source before relying on one.
Statistics and arithmetic are recomputed, not judged.
Confidence bands are shown only for fields calibrated on our annotated test set. None is calibrated yet, so no band is shown.
What counts as a claim ›How we measure confidence ›How we check this ›
Are you an author, or do you see a problem with this page? Request a review
