

The DOI matches its Crossref record; 30 of the 30 references it cites were found in a registry or an index.
Rapid and stable mobilization of CD8+ T cells by SARS-CoV-2 mRNA vaccine
Open accessPublished version of a preprint
Abstract
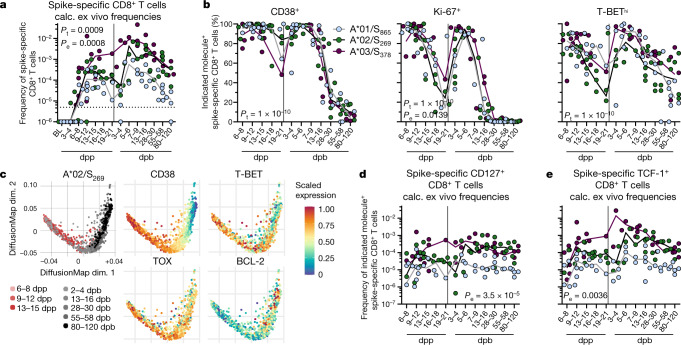
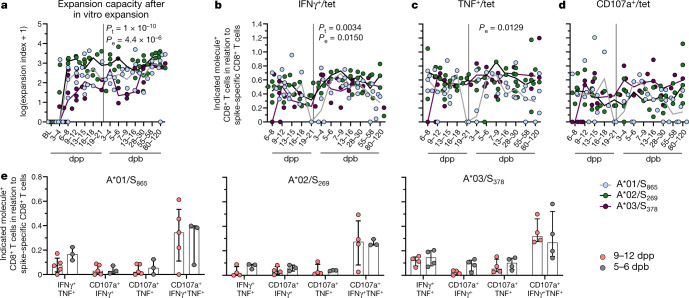
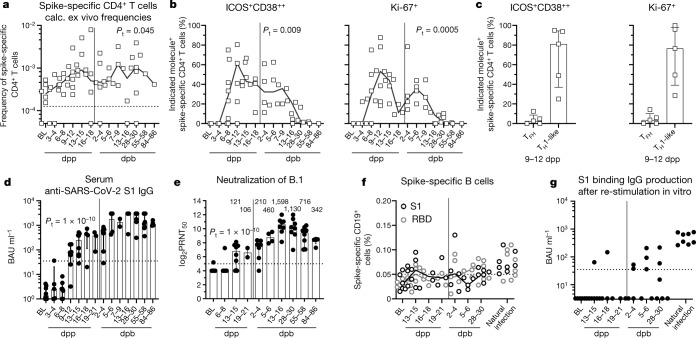
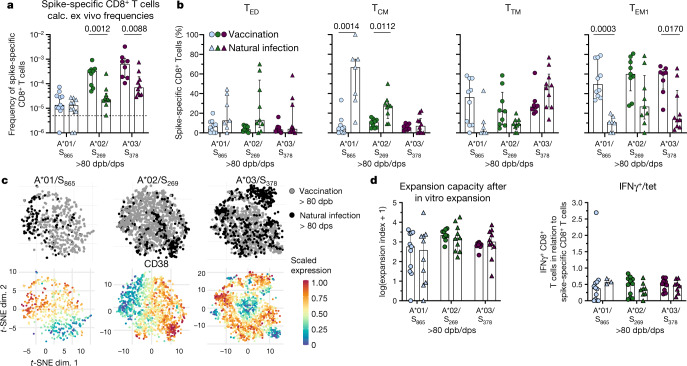
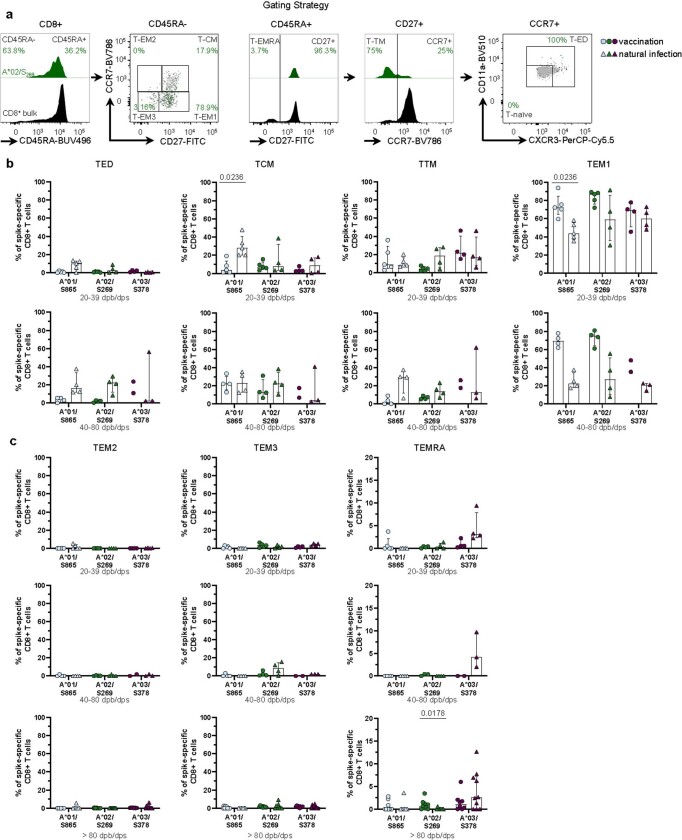
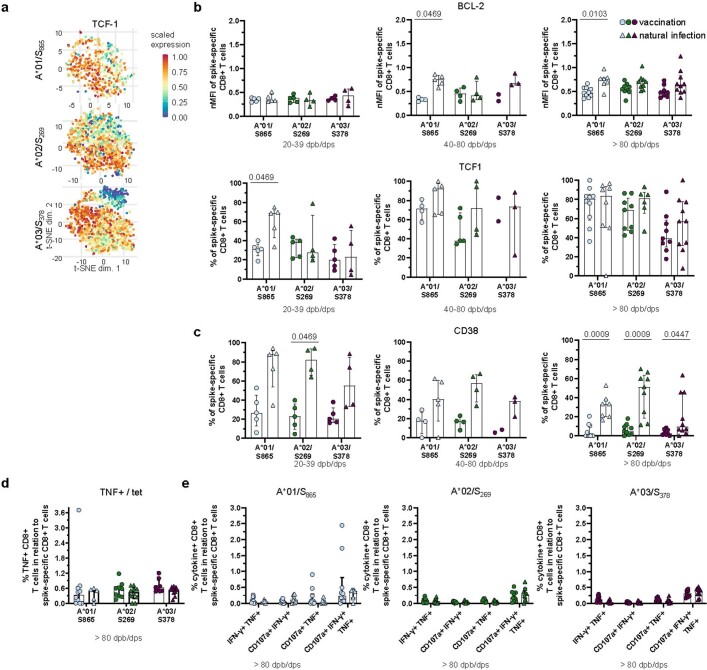
SARS-CoV-2 spike mRNA vaccines 1–3 mediate protection from severe disease as early as ten days after prime vaccination 3 , when neutralizing antibodies are hardly detectable 4–6 . Vaccine-induced CD8 + T cells may therefore be the main mediators of protection at this early stage 7,8 . The details of their induction, comparison to natural infection, and association with other arms of vaccine-induced immunity remain, however, incompletely understood. Here we show on a single-epitope level that a stable and fully functional CD8 + T cell response is vigorously mobilized one week after prime vaccination with bnt162b2, when circulating CD4 + T cells and neutralizing antibodies are still weakly detectable. Boost vaccination induced a robust expansion that generated highly differentiated effector CD8 + T cells; however, neither the functional capacity nor the memory precursor T cell pool was affected. Compared with natural infection, vaccine-induced early memory T cells exhibited similar functional capacities but a different subset distribution. Our results indicate that CD8 + T cells are important effector cells, are expanded in the early protection window after prime vaccination, precede maturation of other effector arms of vaccine-induced immunity and are stably maintained after boost vaccination.
Overview
The claims and statistics of this paper haven’t been checked yet.
Run the check — free, no account needed. It reads the open-access text and checks the sources it cites.
Integrity signals
Registry
Cites
Statistics
Figures
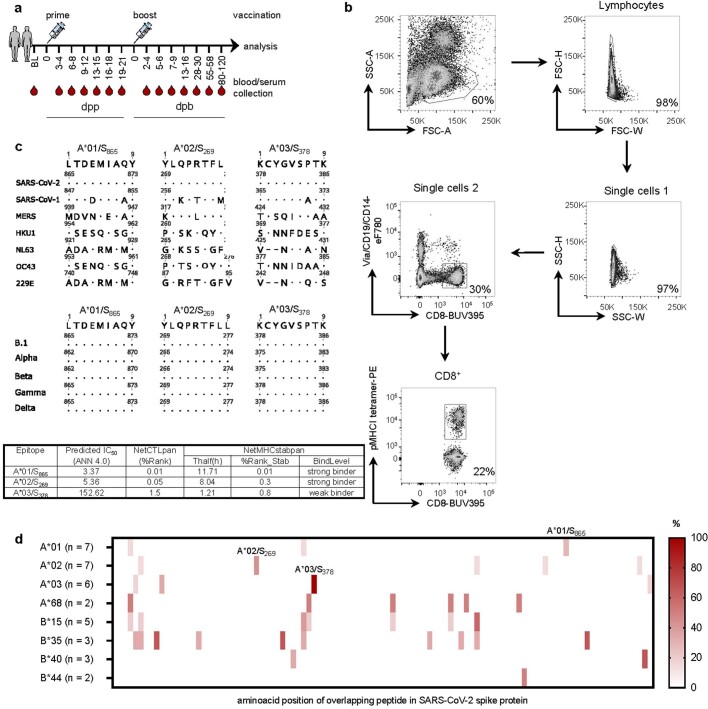
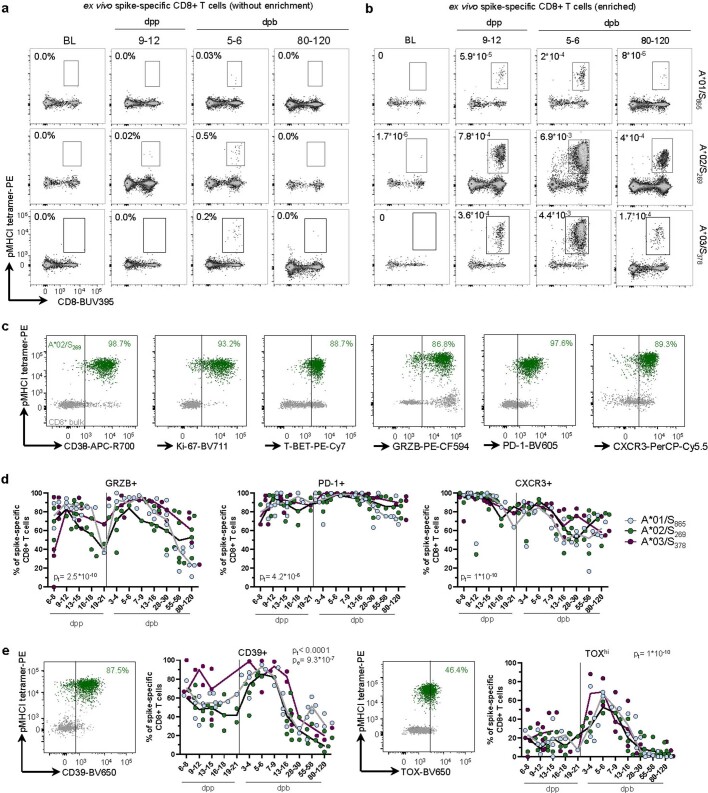
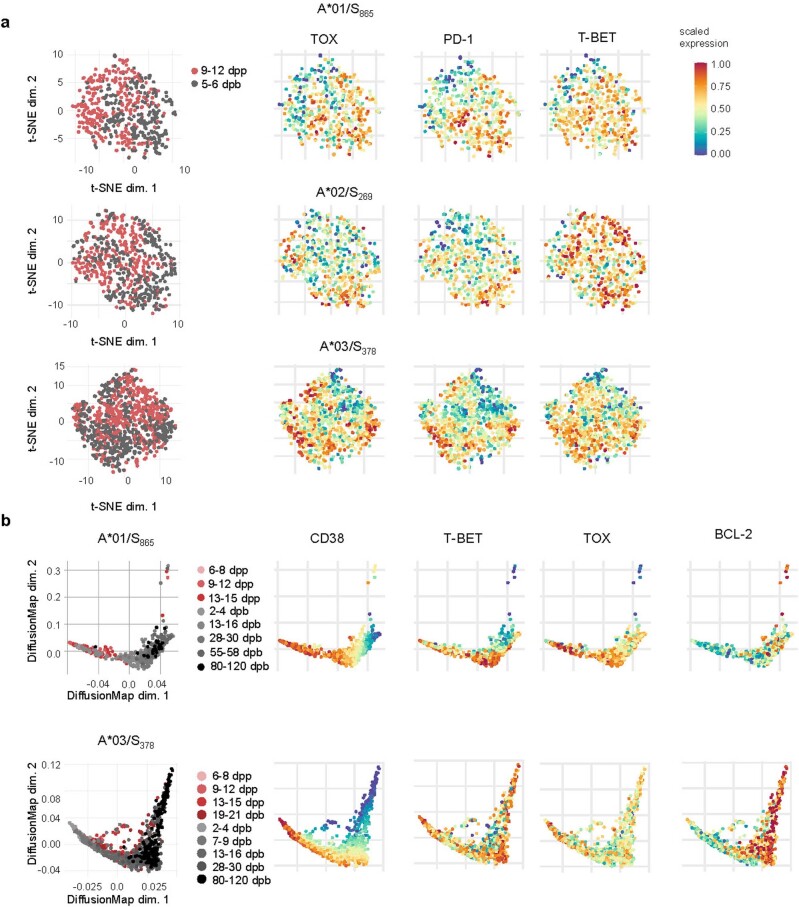
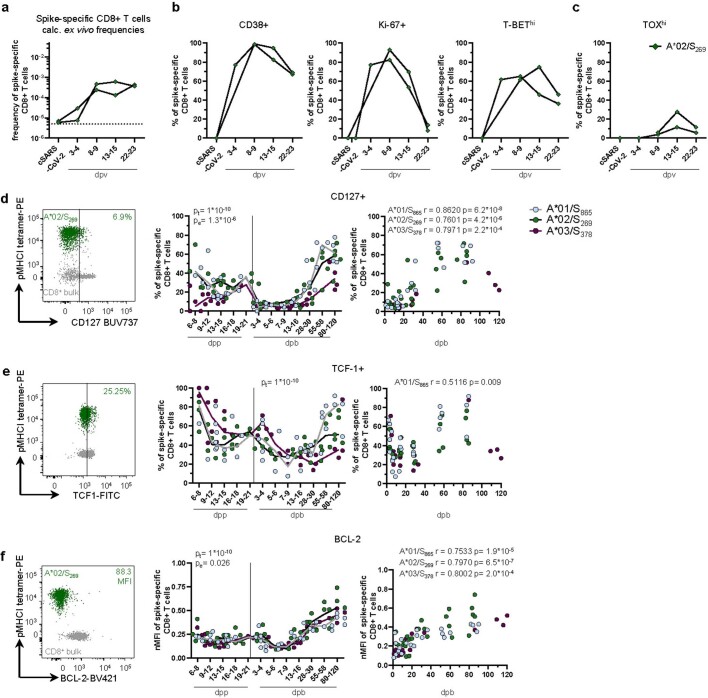
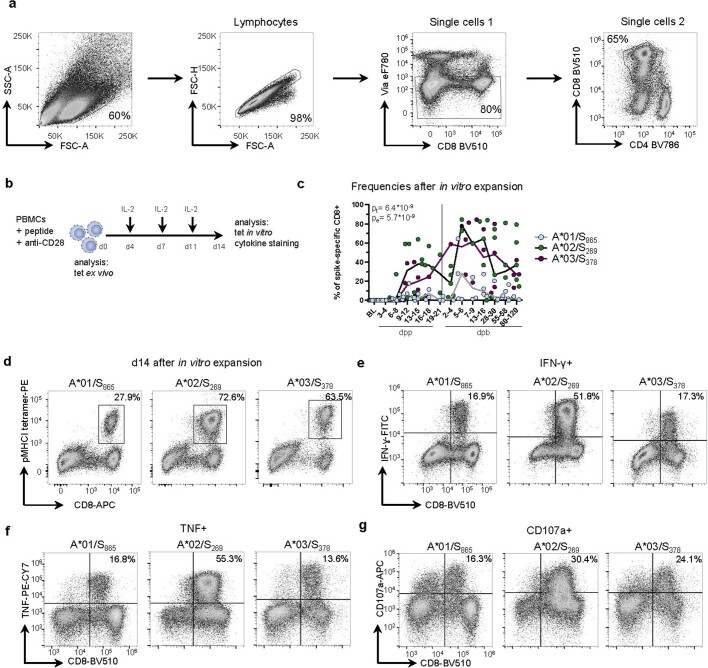
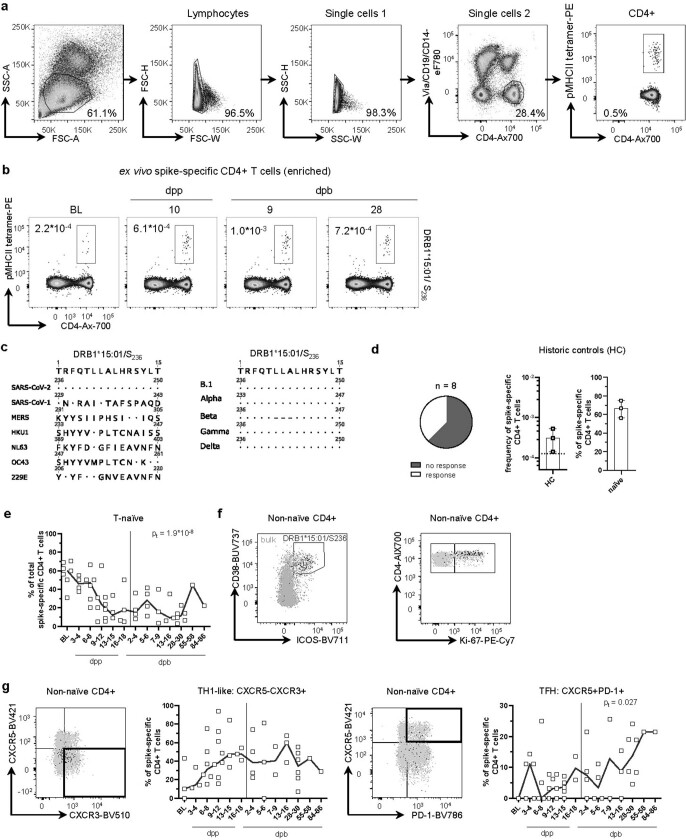
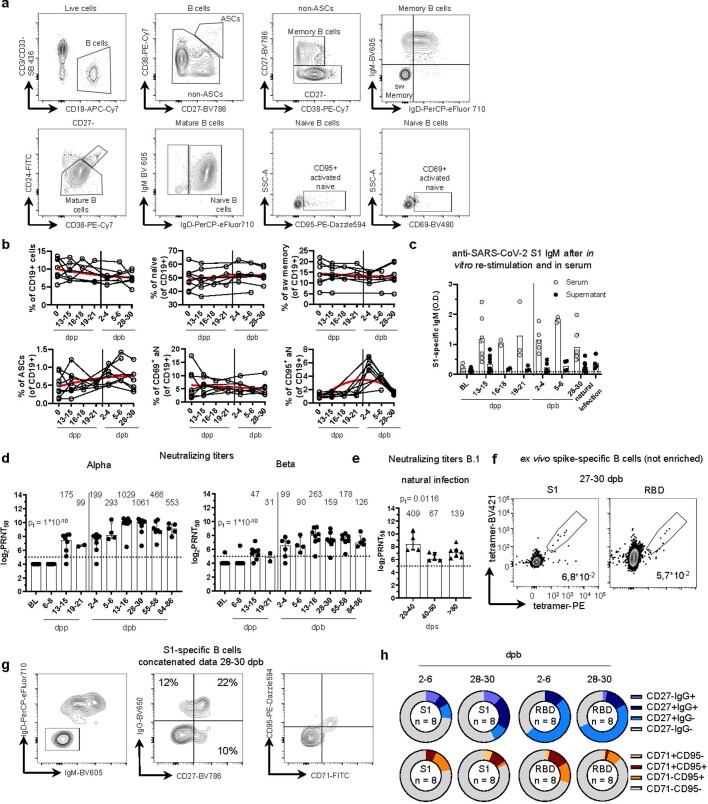
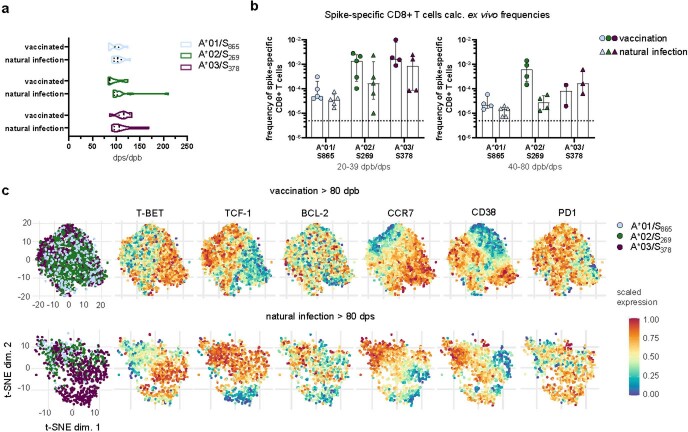
Verification
Claims the paper makes
The claims and statistics of this paper haven’t been checked yet.
Run the check — free, no account needed. It reads the open-access text and checks the sources it cites.
Claims other papers make about this one
Each is checked against this paper’s own text: does it say what the citing paper says it does?
The source backs part of the claim, not all of it — or backs it for a different population, condition or comparison.
In the citing paper
“mRNA-based vaccines, commonly delivered via lipid nanoparticles (LNPs), stimulate potent and broadly protective immune responses by transfecting synthetic mRNA-encoding pathogen-specific antigens into the body [[18], [19], [20], [21], [22]].”
From Systemic profiling of immune responses in healthy adults vaccinated with an RBD-targeting COVID-19 mRNA vaccine (2025) · cites this paper as [18]
Experimental — accuracy not yet measuredIn the citing paper
“The majority of COVID-19 vaccines are designed to evoke humoral and cellular immune responses against the SARS-CoV-2 spike protein — responses that may not prevent infection but robustly protect against severe COVID-19, at least for certain periods of time11,150–157.”
From COVID-19 and cellular senescence (2023) · cites this paper as [154]
In the citing paper
“mRNA vaccination has also been shown to generate spike-specific memory CD4+ and CD8+ T cell responses (19–22).”
From mRNA vaccines induce durable immune memory to SARS-CoV-2 and variants of concern (2021) · cites this paper as [20]
In the citing paper
“Consistent with recent studies, SARS-CoV-2 mRNA vaccination efficiently primed antigen-specific CD4+ T cells and CD8+ T cells (Fig. 5, C and D) (20–22).”
From mRNA vaccines induce durable immune memory to SARS-CoV-2 and variants of concern (2021) · cites this paper as [20]
Self-check
Percentages, sums and reported differences re-computed from the paper’s own numbers.
The self-check needs the paper’s full text.
Citations
Cites
Fast, scalable generation of high-quality protein multiple sequence alignments using Clustal Omega
Sievers, F., Wilm, A., Dineen, D., Gibson, T., Karplus, K., Li, W.-Z., Lopez, R., McWilliam, H., Remmert, M., Söding, J., et al. (2011) · Molecular Systems Biology · doi:10.1038/msb.2011.75 · Cited by 15,576
Safety and Efficacy of the BNT162b2 mRNA Covid-19 Vaccine
Polack, F. P., Thomas, S. J., Kitchin, N., Absalon, J., Gurtman, A., Lockhart, S., Perez, J. L., Pérez Marc, G., Moreira, E. D., Zerbini, C., et al. (2020) · New England Journal of Medicine · doi:10.1056/nejmoa2034577 · Cited by 14,592
Efficacy and Safety of the mRNA-1273 SARS-CoV-2 Vaccine
Baden, L. R., El Sahly, H. M., Essink, B., Kotloff, K., Frey, S., Novak, R., Diemert, D., Spector, S. A., Rouphael, N., Creech, C. B., et al. (2021) · New England Journal of Medicine · doi:10.1056/nejmoa2035389 · Cited by 10,119
Reynisson, B., Alvarez, B., Paul, S., Peters, B., & Nielsen, M. (2020) · Nucleic Acids Research · doi:10.1093/nar/gkaa379 · Cited by 2,361
SARS-CoV-2 vaccines in development
Krammer, F. (2020) · Nature · doi:10.1038/s41586-020-2798-3 · Cited by 2,098
COVID-19 vaccine BNT162b1 elicits human antibody and TH1 T cell responses
Sahin, U., Muik, A., Derhovanessian, E., Vogler, I., Kranz, L. M., Vormehr, M., Baum, A., Pascal, K., Quandt, J., Maurus, D., et al. (2020) · Nature · doi:10.1038/s41586-020-2814-7 · Cited by 1,977
Joshi, N. S., Cui, W., Chandele, A., Lee, H. K., Urso, D. R., Hagman, J., Gapin, L., & Kaech, S. M. (2007) · Immunity · doi:10.1016/j.immuni.2007.07.010 · Cited by 1,861
mRNA vaccine-elicited antibodies to SARS-CoV-2 and circulating variants
Wang, Z., Schmidt, F., Weisblum, Y., Muecksch, F., Barnes, C. O., Finkin, S., Schaefer-Babajew, D., Cipolla, M., Gaebler, C., Lieberman, J. A., et al. (2021) · Nature · doi:10.1038/s41586-021-03324-6 · Cited by 1,343
Kaech, S. M., & Ahmed, R. (2001) · Nature Immunology · doi:10.1038/87720 · Cited by 1,265
BNT162b2 vaccine induces neutralizing antibodies and poly-specific T cells in humans
Sahin, U., Muik, A., Vogler, I., Derhovanessian, E., Kranz, L. M., Vormehr, M., Quandt, J., Bidmon, N., Ulges, A., Baum, A., et al. (2021) · Nature · doi:10.1038/s41586-021-03653-6 · Cited by 919
Cited by
Sorted by citations
Items 201–300 of 397
Silva‐Moraes, V., Souquette, A. H., Sautto, G. A., Paciello, I., Antonelli, G., Andreano, E., Rappuoli, R., Teixeira‐Carvalho, A., & Ross, T. M. (2023) · ImmunoHorizons · doi:10.4049/immunohorizons.2300041 · Cited by 10
Doan, T. A., Forward, T. S., Schafer, J. B., Lucas, E. D., Fleming, I., Uecker-Martin, A., Ayala, E., Guthmiller, J. J., Hesselberth, J. R., Morrison, T. E., et al. (2024) · npj Vaccines · doi:10.1038/s41541-024-00856-6 · Cited by 9
Lopes-Ribeiro, Á., Araújo, F. P., Oliveira, P. D. M., Teixeira, L. D. A., Ferreira, G. M., Lourenço, A. A., Corrêa-Dias, L. C., Teixeira, C. W., Retes, H. M., Lopes, É. N., et al. (2022) · Frontiers in Immunology · doi:10.3389/fimmu.2022.1035515 · Cited by 9
Zhang, G., Zhang, J., Gao, Q., Zhao, Y., & Lai, Y. (2024) · Frontiers in Immunology · doi:10.3389/fimmu.2024.1357638 · Cited by 9
An mRNA-LNP-based Lassa virus vaccine induces protective immunity in mice
Hashizume, M., Takashima, A., & Iwasaki, M. (2024) · Journal of Virology · doi:10.1128/jvi.00578-24 · Cited by 8
Fox-Fisher, I., Piyanzin, S., Briller, M., Oiknine‐Djian, E., Alfi, O., Ben‐Ami, R., Peretz, A., Neiman, D., Ochana, B.-L., Fridlich, O., et al. (2022) · Med · doi:10.1016/j.medj.2022.05.005 · Cited by 8
Svačina, M. K. R., Meißner, A., Schweitzer, F., Ladwig, A., Sprenger‐Svačina, A., Klein, I., Wüstenberg, H., Kohle, F., Schneider, C. A., Grether, N. B., et al. (2022) · European Journal of Neurology · doi:10.1111/ene.15508 · Cited by 8
Liu, J., Wang, L., Kurtesi, A., Budylowski, P., Potts, K. G., Menon, H., Tan, Y., Samaan, P., Liu, X., Wang, Y., et al. (2025) · npj Vaccines · doi:10.1038/s41541-025-01062-8 · Cited by 8
Dennehy, K. M., Loell, E., Dhillon, C., Classen, J.-M., Warm, T. D., Schuierer, L., Hyhlik-Dürr, A., Römmele, C., Goßlau, Y., Kling, E., et al. (2021) · Vaccines · doi:10.3390/vaccines9121439 · Cited by 7
Musa, H. H., & Musa, T. H. (2022) · Human Vaccines & Immunotherapeutics · doi:10.1080/21645515.2022.2135927 · Cited by 11
Smith, K. A., Zúñiga, T. M., Baker, F. L., Batatinha, H., Pedlar, C. R., Burgess, S. C., Gustafson, M. P., Katsanis, E., & Simpson, R. J. (2023) · Journal of sport and health science/Journal of Sport and Health Science · doi:10.1016/j.jshs.2023.06.006 · Cited by 7
Vecchio, E., Rotundo, S., Veneziano, C., Abatino, A., Aversa, I., Gallo, R., Giordano, C., Serapide, F., Fusco, P., Viglietto, G., et al. (2024) · Journal of Translational Medicine · doi:10.1186/s12967-024-04852-1 · Cited by 7
Structural insights into immune escape at killer T cell epitope by SARS-CoV-2 Spike Y453F variants
Deng, S., Xu, Z., Wang, M., Hu, J., Liu, Z., Zhu, F., Zheng, P., Kombe, A. J. K., Zhang, H., Wu, S., et al. (2024) · Journal of Biological Chemistry · doi:10.1016/j.jbc.2024.107563 · Cited by 9
COVID ‐19: Using high‐throughput flow cytometry to dissect clinical heterogeneity
del Barrio, I. D. M., Hayday, T. S., Laing, A. G., Hayday, A., & Rosa, F. D. (2021) · Cytometry Part A · doi:10.1002/cyto.a.24516 · Cited by 6
Vaccine-elicited B- and T-cell immunity to SARS-CoV-2 is impaired in chronic lung disease patients
Liu, H., Aviszus, K., Zelarney, P. T., Liao, S., Gerber, A. N., Make, B. J., Wechsler, M. E., Marrack, P., & Reinhardt, R. L. (2023) · ERJ Open Research · doi:10.1183/23120541.00400-2023 · Cited by 7
Kroemer, M., Boullerot, L., Ramseyer, M., Spehner, L., Barisien, C., Gravelin, E., Renaudin, A., Cognasse, F., Gallian, P., Hermine, O., et al. (2022) · Frontiers in Public Health · doi:10.3389/fpubh.2022.816848 · Cited by 7
Human tonsil organoids reveal innate pathways modulating humoral and cellular responses to ChAdOx1
Pudjohartono, M. F., Powell, K., Barnes, E. J., Klenerman, P., & Provine, N. M. (2025) · PLoS Pathogens · doi:10.1371/journal.ppat.1013432 · Cited by 6
Divergent Immune Responses to SARS-CoV-2 Vaccines in Immunocompromised Patients
Jordan, S. C., Shin, B., Gadsden, T. M., Chu, M., Petrosyan, A., Vo, A. A., Ammerman, N., Sethi, S., Najjar, R., Huang, E., et al. (2021) · Transplantation · doi:10.1097/tp.0000000000003957 · Cited by 6
Impact of Maternal Exposure to SARS-CoV-2 on Immunological Components of Breast Milk
Graciliano, N. G., Goulart, M. O. F., & de Oliveira, A. C. M. (2025) · International Journal of Molecular Sciences · doi:10.3390/ijms26062600 · Cited by 6
Bozkus, C. C., Brown, M., Velazquez, L. G., Thomas, M., Wilson, E. A., O’Donnell, T. J., Kaminska, A., Ruchnewitz, D., Geertz, D., Bykov, Y., et al. (2025) · iScience · doi:10.1016/j.isci.2025.113044 · Cited by 9
The T Cell Epitope Landscape of SARS-CoV-2 Variants of Concern
Tennøe, S., Gheorghe, M., Stratford, R., & Clancy, T. (2022) · Vaccines · doi:10.3390/vaccines10071123 · Cited by 5
Act Early and at the Right Location: SARS-CoV-2 T Cell Kinetics and Tissue Localization
Bertoletti, A., Bert, N. L., & Tan, A. T. (2022) · International Journal of Molecular Sciences · doi:10.3390/ijms231810679 · Cited by 6
Al‐Akioui‐Sanz, K., Pascual-Miguel, B., Díaz‐Almirón, M., Mestre‐Durán, C., Navarro‐Zapata, A., Villa, L. C., Martín-Cortázar, C., Vicario, J. L., Moreno, M. Á., Balas, A., et al. (2022) · Cytotherapy · doi:10.1016/j.jcyt.2022.12.001 · Cited by 5
Faissner, S., Heitmann, N., Rohling, R., Ceylan, U., Bongert, M., Plaza‐Sirvent, C., Marheinecke, C. S., Pedreiturria, X., Ayzenberg, I., Hellwig, K., et al. (2022) · Therapeutic Advances in Neurological Disorders · doi:10.1177/17562864221141505 · Cited by 6
Vaccination Provides Superior in vivo Recall Capacity of SARS-CoV-2 Specific Memory CD8 T Cells
Kavazović, I., Dimitropoulos, C., Gašparini, D., Filipović, M. R., Barković, I., Köster, J., Lemmermann, N. A. W., Babić, M., Cekinović, Đ., & Wensveen, F. M. (2022) · Cell Reports · doi:10.1016/j.celrep.2023.112395 · Cited by 6
King, A. (2021) · EMBO Reports · doi:10.15252/embr.202154073 · Cited by 5
Zhou, C., Sun, M., Huang, X., Liu, P., Ouyang, Z., Wu, M., Yuan, L., Chen, J., Shu, W., Cao, T., et al. (2025) · hLife · doi:10.1016/j.hlife.2025.04.008 · Cited by 5
Deng, S., Xu, Z., Hu, J., Yang, Y., Zhu, F., Liu, Z., Zhang, H., Wu, S., & Jin, T. (2024) · Frontiers in Immunology · doi:10.3389/fimmu.2024.1468456 · Cited by 5
López-Macías, C. I. R., Torres, M., Armenta-Copca, B., Wacher, N. H., Galindo‐Fraga, A., Castro-Castrezana, L., Colli-Domínguez, A. A., Cervantes-Trujano, E., Joerg, I. R., Lozano-Patiño, F., et al. (2025) · Science Advances · doi:10.1126/sciadv.adq2887 · Cited by 5
Chen, J., Zhu, X., Huo, J., Wu, S., Zhou, T., Cheng, C., Dong, H., Li, Y., Dong, X., & Chen, Y. (2025) · Biomedical Technology · doi:10.1016/j.bmt.2025.100112 · Cited by 5
Duhen, R., Beymer, M., Jensen, S. M., Abbina, S., Abraham, S., Jain, N., Thomas, A. M., Geall, A. J., Hu, H., Fox, B. A., et al. (2022) · Frontiers in Immunology · doi:10.3389/fimmu.2022.896310 · Cited by 5
Effect of immune responses on breath methane dynamics
Polag, D., & Keppler, F. (2023) · Journal of Breath Research · doi:10.1088/1752-7163/ace9f2 · Cited by 5
Liu, Y., Suzuoki, M., Tanaka, H., Sakurai, Y., Hatakeyama, H., & Akita, H. (2024) · Biological and Pharmaceutical Bulletin · doi:10.1248/bpb.b23-00689 · Cited by 5
Guan, X., Bu, F., Fu, Y., Zhang, H., Xiang, H., Chen, X., Chen, T., Wu, X.-J., Wu, K., Liu, L., et al. (2024) · iScience · doi:10.1016/j.isci.2024.111338 · Cited by 6
Messenger ribonucleic acid vaccines for severe acute respiratory syndrome coronavirus-2 – a review
Akamine, C. M., & Sahly, H. M. E. (2021) · Translational research · doi:10.1016/j.trsl.2021.12.007 · Cited by 5
Takagi, A., & Matsui, M. (2021) · Microbiology Spectrum · doi:10.1128/spectrum.01659-21 · Cited by 5
Vaccines against the original strain of SARS-CoV-2 provide T cell memory to the B.1.1.529 variant
Dörnte, C., Traska, V., Jansen, N., Kostyra, J., Baurmann, H., Lauer, G., Huang, Y.-J., Krämer, S., Brauns, O., Winkels, H., et al. (2022) · Communications Medicine · doi:10.1038/s43856-022-00203-7 · Cited by 5
Ancestral SARS-CoV-2-specific T cells cross-recognize Omicron (B.1.1.529)Preprint
Gao, Y., Cai, C., Grifoni, A., Müller, T. R., Niessl, J., Olofsson, A., Humbert, M., Hansson, L., Österborg, A., Bergman, P., et al. (2022) · Research Square · doi:10.21203/rs.3.rs-1217466/v1 · Cited by 5
Ford, E. S., Mayer-Blackwell, K., Jing, L., Sholukh, A. M., Germain, R. S., Bossard, E. L., Xie, H. J., Pulliam, T. H., Jani, S., Selke, S., et al. (2022) · Research Square · doi:10.21203/rs.3.rs-2146712/v1 · Cited by 6
A Low Number of Baselines γδ T Cells Increases the Risk of SARS-CoV-2 Post-Vaccination Infection
Andreu‐Ballester, J. C., Galindo-Regal, L., Cuéllar, C., López-Chuliá, F., García‐Ballesteros, C., Fernández-Murga, M. L., Llombart‐Cussac, A., & Domínguez-Márquez, M. V. (2024) · Vaccines · doi:10.3390/vaccines12050553 · Cited by 4
Hwang, Y. H., Min, D., & Park, W. B. (2025) · Human Vaccines & Immunotherapeutics · doi:10.1080/21645515.2025.2473795 · Cited by 4
Hollstein, M. M., Dierks, S., Schön, M. P., Bergmann, A., Abratis, A., Eidizadeh, A., Kaltenbach, S., Schanz, J., Groß, U., Leha, A., et al. (2023) · Journal of Medical Virology · doi:10.1002/jmv.29122 · Cited by 4
Pallás, R. M. (2024) · Vacunas (English Edition) · doi:10.1016/j.vacune.2024.05.002 · Cited by 5
Yong, L., Hutchings, C. L., Barnes, E. J., Klenerman, P., & Provine, N. M. (2024) · European Journal of Immunology · doi:10.1002/eji.202451142 · Cited by 6
Sсherbak, S. G., Vologzhanin, D. A., Голота, А. С., Kamilova, Т. A., & Макаренко, С. В. (2022) · Journal of clinical practice · doi:10.17816/clinpract106239 · Cited by 5
Casado, J. L., Vizcarra, P., Martín-Hondarza, A., Blasco, M., Platero, M. G., Häemmerle, J., Fernández-Escribano, M., & Vallejo, A. (2023) · Viruses · doi:10.3390/v15030627 · Cited by 4
Souan, L., Abdel‐Razeq, H., Zughbieh, M. A., Badr, S. A., & Sughayer, M. A. (2023) · Viruses · doi:10.3390/v15071439 · Cited by 3
Knell, A. I., Boehm, A., Jäger, M., Kerschbaum, J., Engl, S., Rudnicki, M., Buchwinkler, L., Bellmann‐Weiler, R., Posch, W., & Weiß, G. (2023) · Microorganisms · doi:10.3390/microorganisms11071756 · Cited by 4
Almeida, B., Dias, T. R., Teixeira, A. L., Dias, F., & Medeiros, R. (2023) · Cancers · doi:10.3390/cancers15164017 · Cited by 4
Aoki, H., Kitabatake, M., Abe, H., Xu, P., Tsunoda, M., Shichino, S., Hara, A., Ouji-Sageshima, N., Motozono, C., Ito, T., et al. (2022) · bioRxiv (Cold Spring Harbor Laboratory) · doi:10.1101/2022.08.27.504955 · Cited by 5
Badary, O. A. (2023) · Reviews in Medical Virology · doi:10.1002/rmv.2417 · Cited by 3
Kanis, F. M., Meier, J. P., Guldan, H., Niller, H.-H., Dahm, M., Dansard, A., Zander, T., Struck, F., Soutschek, E., Deml, L., et al. (2023) · Diagnostics · doi:10.3390/diagnostics13172722 · Cited by 3
Wu, J., Mao, X., Liu, X., Mao, J., Yang, X., zhou, X., Lu, T., Ji, Y., Zhao, L., & Xu, H. (2024) · Hereditas · doi:10.1186/s41065-023-00307-7 · Cited by 4
del Riego, E. S., Sáiz, M. L., Corte-Iglesias, V., Gordillo, B. L., Martín-Martín, C., Rodríguez-Pérez, M., Escudero, D., López‐Larrea, C., & Suárez-Álvarez, B. (2022) · Frontiers in Immunology · doi:10.3389/fimmu.2022.942192 · Cited by 3
Dimitroff, S. J., Würfel, L., Meier, M., Faig, K. E., Benz, A., Denk, B., Bentele, U. U., Unternäehrer, E., & Pruessner, J. C. (2023) · Biological Psychology · doi:10.1016/j.biopsycho.2023.108636 · Cited by 4
Choi, S.-J., Kim, S.-H., Han, M. S., Yoon, Y., Kim, Y. K., Cho, H., Yun, K. W., Song, S. H., Ahn, B., Kim, Y. K., et al. (2023) · Immune Network · doi:10.4110/in.2023.23.e33 · Cited by 3
Peng, J.-C., Li, J., Zhou, M., Zhu, S.-H., & Li, K.-F. (2023) · Neurology India · doi:10.4103/0028-3886.388127 · Cited by 3
Verheul, M. K., Vos, M. W., de Rond, L., de Zeeuw‐Brouwer, M., Nijhof, K. H., Smit, D., Oomen, D., Molenaar, P., Bogaard, M., van Bergen, R., et al. (2023) · Frontiers in Immunology · doi:10.3389/fimmu.2023.1327875 · Cited by 3
Cellular Immunity of SARS-CoV-2 in the Borriana COVID-19 Cohort: A Nested Case–Control Study
Domènech-Montoliu, S., Puig‐Barberà, J., Pac-Sa, M. R., Orrico‐Sánchez, A., Gómez-Lanas, L., Sala-Trull, D., Domènech-León, C., Rio-González, A. D., Sanchéz-Urbano, M., Satorres-Martinez, P., et al. (2024) · Epidemiologia · doi:10.3390/epidemiologia5020012 · Cited by 2
Fukushima, K., Kubo, T., Ito, Y., Oda, Y., Nagayoshi, Y., Fukuda, M., Takazono, T., Sakamoto, N., & Mukae, H. (2025) · Journal of Infection and Chemotherapy · doi:10.1016/j.jiac.2025.102695 · Cited by 3
Kang, H., Park, J., Bae, H., Chung, Y., & Oh, E. (2025) · International Journal of Molecular Sciences · doi:10.3390/ijms26083494 · Cited by 3
Impact of memory T cells on SARS-CoV-2 vaccine response in hematopoietic stem cell transplant
VanOudenhove, J., Liu, Y., Nelakanti, R. V., Kim, D., Busarello, E., Ovalle, N. T., Qi, Z., Mamillapalli, P., Siddon, A. J., Bai, Z., et al. (2025) · PLoS ONE · doi:10.1371/journal.pone.0320744 · Cited by 3
Update to COVID-19 serologic testing : FAQs and caveats
Kadkhoda, K. (2022) · Cleveland Clinic Journal of Medicine · doi:10.3949/ccjm.87a.20054-up · Cited by 3
Padula, L., Fisher, E., Rivas, K., Podack, K., Frasca, D., Kupritz, J., Seavey, M. M., Jayaraman, P., Dixon, E. P., Jasuja, R. R., et al. (2022) · Vaccine X · doi:10.1016/j.jvacx.2022.100202 · Cited by 3
Waning immune responses against SARS-CoV-2 among vaccinees in Hong KongPreprint
Peng, Q., Zhou, R., Wang, Y., Zhao, M., Liu, N., Li, S., Huang, H., Yang, D., Au, K., Wang, H., et al. (2021) · bioRxiv (Cold Spring Harbor Laboratory) · doi:10.1101/2021.12.22.473934 · Cited by 3
COVID19-vaccination affects breath methane dynamicsPreprint
Polag, D., & Keppler, F. (2022) · bioRxiv (Cold Spring Harbor Laboratory) · doi:10.1101/2022.07.27.501717 · Cited by 3
Zhang, B., Upadhyay, R., Hao, Y., Samanovic, M. I., Herati, R. S., Blair, J., Axelrad, J. E., Mulligan, M. J., Littman, D. R., & Satija, R. (2023) · bioRxiv (Cold Spring Harbor Laboratory) · doi:10.1101/2023.01.24.525203 · Cited by 3
The Impact of Vaccination Frequency on COVID-19 Public Health Outcomes: A Model-Based Analysis
Stoddard, M., Yuan, L., Sarkar, S., Egeren, D. V., Mangalaganesh, S., Nolan, R. P., Rogers, M. S., Hather, G., White, L. F., & Chakravarty, A. (2025) · Vaccines · doi:10.3390/vaccines13040368 · Cited by 8
SARS-CoV-2 Nsp1 Is a Major Suppressor of HLA Class I and Class II Expression
Schirmeister, I., Eckert, N., Weigang, S., Fuchs, J., Kern, L., Kochs, G., & Halenius, A. (2025) · Viruses · doi:10.3390/v17081083 · Cited by 2
Self-citationMuro, R., Wang, S., Ito-Kureha, T., Huynh, H. H., Kobiyama, K., Sugita, T., Okamoto, K., Nakano, K., Okamura, T., Kubo, M., et al. (2026) · Science Advances · doi:10.1126/sciadv.aec7827 · Cited by 3
Single-cell transcriptome landscape and antigen receptor dynamic during SARS-CoV-2 vaccination
Cao, X., Chen, X., Zhu, Y., Gou, X., Yan, K., Yang, B., Men, D., Liu, L., Zhang, Y., & Cao, G. (2022) · Genes & Diseases · doi:10.1016/j.gendis.2022.08.020 · Cited by 2
The discovery and development of mRNA vaccines for the prevention of SARS-CoV-2 infection
Xue, V. W., Wong, S. C. C., Li, B., & Cho, W. C. S. (2023) · Expert Opinion on Drug Discovery · doi:10.1080/17460441.2023.2218083 · Cited by 2
De Novo Vitiligo Following Covid-19 Infection and Vaccination: A Door Open to Future Events?
Mormile, R. (2024) · Archives of Medical Research · doi:10.1016/j.arcmed.2024.102961 · Cited by 2
la Torre-Gomar, F. J. D., Llamas‐Molina, J. M., Pegalajar‐García, M. D., Pérez-Valencia, C., Carrero-Castaño, A., & Ruíz‐Villaverde, R. (2024) · Life · doi:10.3390/life14030386 · Cited by 2
Chwa, J. S., Kim, M., Lee, Y., Cheng, W. A., Shin, Y., Jumarang, J., Bender, J. M., & Pannaraj, P. S. (2024) · Viruses · doi:10.3390/v16060852 · Cited by 2
Leno‐Durán, E., Serrano‐Conde, E., Salas-Rodríguez, A., Salcedo‐Bellido, I., Barrios‐Rodríguez, R., Fuentes, A. P., Viñuela, L., García, F., & Requena, P. (2024) · Frontiers in Immunology · doi:10.3389/fimmu.2024.1447317 · Cited by 2
mRNA Vaccines: Immunology and Present and Future Potential
Khan, O. F., Couture‐Senécal, J., Lau, Y. M. A., Oproescu, A.-M., Pang, J., Tilstra, G., & Walz, B. A. (2024) · Springer eBooks · doi:10.1007/978-3-031-62772-9_5 · Cited by 2
Cahuapaza-Gutierrez, N. L. (2024) · Annals of Hematology · doi:10.1007/s00277-024-06052-9 · Cited by 2
Coronaviruses: Pandemic SARS-CoV-2
Cowling, B. J., & Wong, S. (2024) · Springer eBooks · doi:10.1007/978-1-4939-9544-8_68-1 · Cited by 2
COVID-19 mRNA or viral vector vaccine type and subject sex influence the SARS-CoV-2 T-cell response
Tong, S., Litwin, S. M., Epel, E. S., Lin, J., Drury, S. S., Hecht, F. M., Robinson, J. E., Prather, A. A., & Norton, E. B. (2025) · Vaccine · doi:10.1016/j.vaccine.2025.127420 · Cited by 2
Limited vaccine-induced CD8+ T cell immunity in HIV-infected immunological nonresponders
Karl, V., Graeser, A., Kremser, A., Bauersfeld, L., Emmerich, F., Herkt, N., Rieg, S., Usadel, S., Bengsch, B., Boettler, T., et al. (2025) · JCI Insight · doi:10.1172/jci.insight.195458 · Cited by 3
Self-citationDentone, C., Fenoglio, D., Ponzano, M., Cerchiaro, M., Altosole, T., Franciotta, D. M., Portunato, F., Mikulska, M., Taramasso, L., Magnasco, L., et al. (2022) · Vaccines · doi:10.3390/vaccines10111784 · Cited by 2
Capturing adaptive immunity against SARS-CoV-2 in patients with cancer
Luxenburger, H., & Thimme, R. (2021) · Nature Cancer · doi:10.1038/s43018-021-00298-2 · Cited by 2
Self-citationA novel mAb broadly neutralizes SARS‐CoV‐2 VOCs in vitro and in vivo, including the Omicron variants
Kan, Q., Lin, X. Z., Li, T., Ke, X., Jian, X., Hou, L., Zhang, W., Wan, Z., Xie, Q., Shao, H., et al. (2023) · Journal of Medical Virology · doi:10.1002/jmv.28657 · Cited by 2
Rosseto-Welter, E. A., Rodrigues, S. S., Figueiredo, A. B., França, C. N., Oliveira, D. B. L., Bachi, A. L. L., do Amaral, J. B., Siqueira, R. A., Bento, L. C., da Silva, A. P., et al. (2023) · Vaccines · doi:10.3390/vaccines11040840 · Cited by 2
Evaluation of T and B cell immunophenotyping and antibody response post Covid-19 vaccination
Chadha, R., Udayakumar, D., Phogat, R., Alam, S., Mathur, N., Singh, M. K., Kataria, S., Sharma, P., Singh, P., Sarma, S., et al. (2023) · Indian Journal of Medical Microbiology · doi:10.1016/j.ijmmb.2023.100372 · Cited by 2
Hsieh, M.-J., Tsai, P., Chiang, P.-H., Kao, Z.-K., Zhuang, Z.-Q., Hsieh, A., Ho, H., Chiou, S., Liang, K., & Chen, Y. (2024) · Human Vaccines & Immunotherapeutics · doi:10.1080/21645515.2024.2399382 · Cited by 2
Kuo, T.-Y., Lien, C.-E., Lin, Y., Lin, M., Wu, C.-C., Tang, W.-H., Campbell, J. D. M., Traquina, P., Chuang, Y.-S., Liu, L.-K.-T.-C., et al. (2021) · bioRxiv · doi:10.1101/2021.09.29.462344 · Cited by 2
Meyer, S., Blaas, I., Bollineni, R. C., Delić-Šarac, M., Tran, T. T., Knetter, C. F., Dai, K., Madssen, T. S., Vaage, J. T., Gustavsen, A., et al. (2021) · bioRxiv (Cold Spring Harbor Laboratory) · doi:10.1101/2021.10.13.463911 · Cited by 2
The T cell receptor repertoire reflects the dynamics of the immune response to vaccinationPreprint
Mohammed, K., Meadows, A., Hekmaty, S., Hatem, S., Simon, V. R., Jayaprakash, A. D., & Sachidanandam, R. (2021) · bioRxiv (Cold Spring Harbor Laboratory) · doi:10.1101/2021.12.09.471735 · Cited by 2
Vaccination-Associated PathogenesisPreprint
Chang, C., Yu, C., Yang, C.-C., & Hsu, S. (2024) · Preprints.org · doi:10.20944/preprints202401.1689.v1 · Cited by 2
Supervised Deep Learning with Gene Annotation for Cell ClassificationPreprint
Lin, Z., Gao, Y., & Sun, W. (2024) · bioRxiv (Cold Spring Harbor Laboratory) · doi:10.1101/2024.07.15.603527 · Cited by 2
Rosenthal, J. A., Papa, M. P., Sanz, M., Nicholes, S., Holmberg, C. S., Bosque, A., Keswani, A., AMDUR, R. L., Lynch, R. M., Soriano-Sarabia, N., et al. (2023) · Annals of Allergy Asthma & Immunology · doi:10.1016/j.anai.2023.01.025 · Cited by 1
T cell responses to SARS-COV-2
Khadri, L., Ziraksaz, M. H., Barekzai, A. B., & Ghauri, B. (2023) · Progress in molecular biology and translational science · doi:10.1016/bs.pmbts.2023.06.001 · Cited by 1
Shoumariyeh, K., Csernalabics, B., Alizei, E. S., Reinscheid, M., Giese, S., Ciminski, K., Kochs, G., Schwemmle, M., Lang‐Meli, J., Maas, M., et al. (2024) · Vaccines · doi:10.3390/vaccines12111249 · Cited by 1
Self-citationSun, J., Yang, M., Su, G., Wang, L., Hu, X., Zhou, Y., Cui, G., Qian, G., Yuan, Y., Hu, X., et al. (2025) · Advanced Science · doi:10.1002/advs.202405679 · Cited by 1
Tailoring mRNA lipid nanoparticles for antifungal vaccines
Li, Y., Meagher, R. B., & Lin, X. (2025) · PLoS Pathogens · doi:10.1371/journal.ppat.1013091 · Cited by 1
Brunetti, J. E., Escudero-Pérez, B., Lasala, F., Rivas, G. A., Mancheño‐Losa, M., Rial‐Crestelo, D., Lora‐Tamayo, J., Cadar, D., Carroll, M. W., Delgado, R. B., et al. (2025) · Vaccines · doi:10.3390/vaccines13060551 · Cited by 1
Metadata
- Authors
- Oberhardt, V., Luxenburger, H., Kemming, J., Schulien, I., Ciminski, K., Giese, S., Csernalabics, B., Lang-Meli, J., Janowska, I., Staniek, J., Wild, K., Basho, K., Marinescu, M. S., Fuchs, J., Topfstedt, F., Janda, A., Sogukpinar, O., Hilger, H., Stete, K., Emmerich, F., Bengsch, B., Waller, C. F., Rieg, S., Sagar, Boettler, T., Zoldan, K., Kochs, G., Schwemmle, M., Rizzi, M., Thimme, R., Neumann-Haefelin, C., & Hofmann, M.
- Affiliations
- University of Freiburg (DE)
- Corresponding author
- Thimme, Robert
- Hofmann, Maike
- ORCID
- Luxenburger, Hendrik
- Kemming, Janine
- Ciminski, Kevin
- Giese, Sebastian
- Lang-Meli, Julia
- Janowska, Iga
- Staniek, Julian
- Fuchs, Jonas
- Janda, Ales
- Emmerich, Florian
- Bengsch, Bertram
- Waller, Cornelius F.
- Rieg, Siegbert
- Boettler, Tobias
- Kochs, Georg
- Schwemmle, Martin
- Rizzi, Marta
- Thimme, Robert
- Neumann-Haefelin, Christoph
- Hofmann, Maike
- Venue
- Nature
- Published
- 2021-07-28
- Volume
- 597
- Issue
- 7875
- Pages
- 268-273
- ISSN
- 0028-0836 (ISSN-L)
- 1476-4687
- PMC
- PMC8426185
- OpenAlex
- W3183161080
- Cited by
- 391
- References
- 28
- Citations by year
- 2026: 22 · 2025: 48 · 2024: 68 · 2023: 88 · 2022: 122 · 2021: 43
- FWCI
- 25.81
- Type
- journal article
- Language
- en
- Open access
- hybrid
- doi.org
- Locations
- Nature (publishedVersion, cc-by)
- Research Square (acceptedVersion, cc-by)
- Europe PMC (PubMed Central) (publishedVersion, other-oa)
- PubMed Central (publishedVersion, cc-by)
- PubMed (publishedVersion)
- RePEc: Research Papers in Economics (submittedVersion)
- Funders
- Deutsche Forschungsgemeinschaft (256073931, Project A06, 272983813, TRR179, CRC 1160)
- Bundesministerium für Bildung und Forschung (01KI2077)
- Albert-Ludwigs-Universität Freiburg
- Medizinische Fakultät der Albert-Ludwigs-Universität Freiburg
- Topics
- Health Sciences › Medicine › Infectious Diseases › SARS-CoV-2 and COVID-19 Research
- Life Sciences › Immunology and Microbiology › Immunology › T-cell and B-cell Immunology
- Life Sciences › Immunology and Microbiology › Immunology › Immune responses and vaccinations
- Keywords
- SARS-CoV-2, COVID-19 pandemic, mRNA vaccines, BNT162b2, CD8+ T cells, T cell mobilization, memory T cells, effector T cells, T cell differentiation
- MeSH terms
- COVID-19, SARS-CoV-2, COVID-19 Vaccines, mRNA Vaccines, BNT162 Vaccine, Antibodies, Viral, B-Lymphocytes, Cells, Cultured, Humans, Immunization, Secondary, Immunologic Memory, Time Factors, Vaccination, Vaccines, Synthetic, CD4-Positive T-Lymphocytes, CD8-Positive T-Lymphocytes, Epitopes, T-Lymphocyte, Antibodies, Neutralizing, Spike Glycoprotein, Coronavirus
About these checks
Registry, retraction, Cites and statistics results are computed, not judged, with one exception: a printed reference that no index lists is read once by a model before it counts as a citation error. Claims are extracted by a model and kept only when their quote appears verbatim in the text; each cited source is then checked, with a model’s help, for whether it says what the claim relies on. Those verdicts can be wrong — read the claim’s quote and the cited source before relying on one.
Statistics and arithmetic are recomputed, not judged.
Confidence bands are shown only for fields calibrated on our annotated test set. None is calibrated yet, so no band is shown.
What counts as a claim ›How we measure confidence ›How we check this ›
Are you an author, or do you see a problem with this page? Request a review
