

The DOI matches its Crossref record; 51 of the 52 references it cites were found in a registry or an index.
Akkermansia muciniphila phospholipid induces homeostatic immune responses
Open accessAbstract
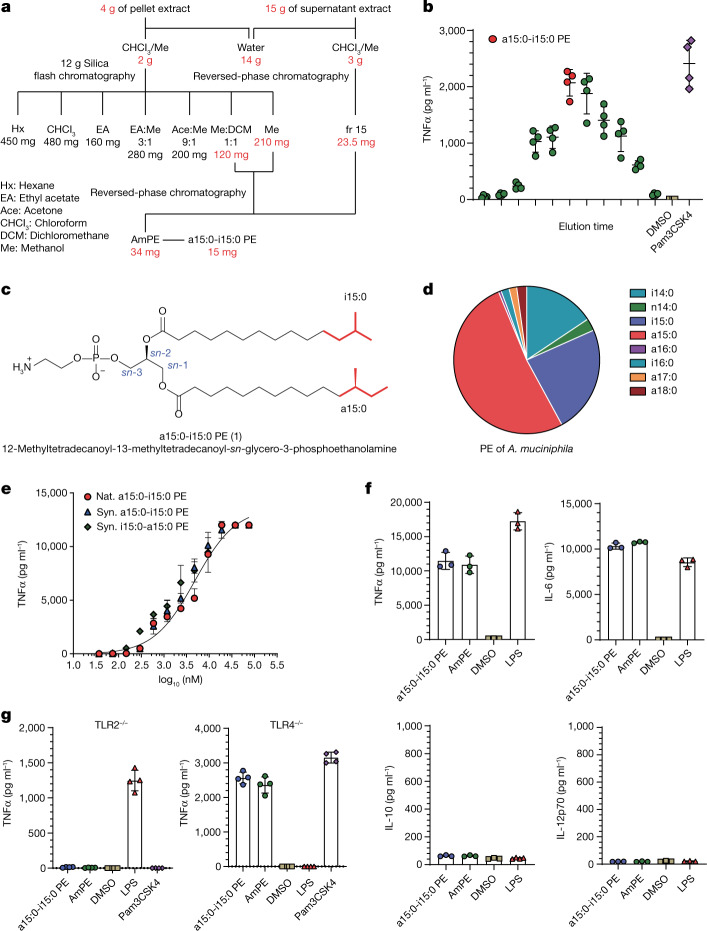
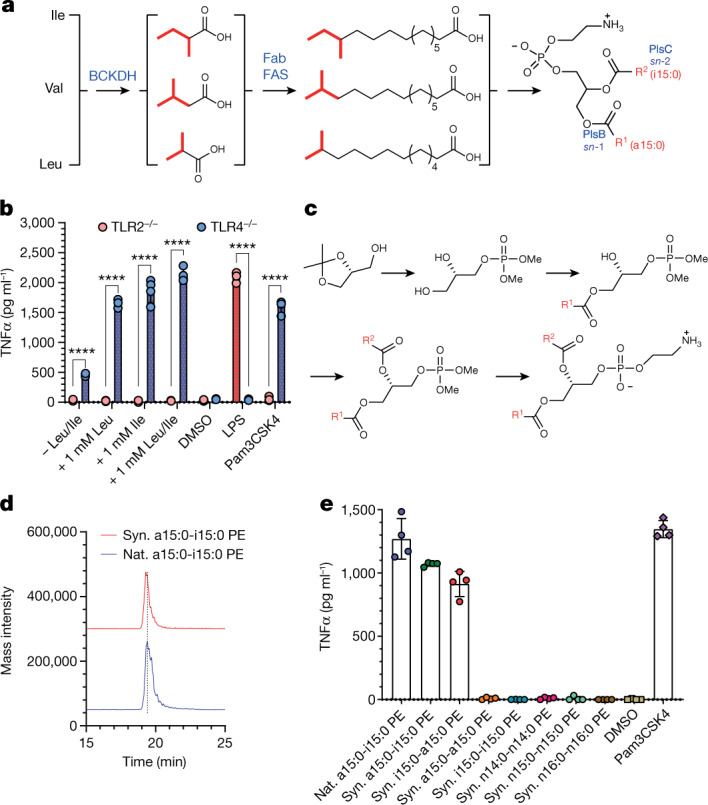
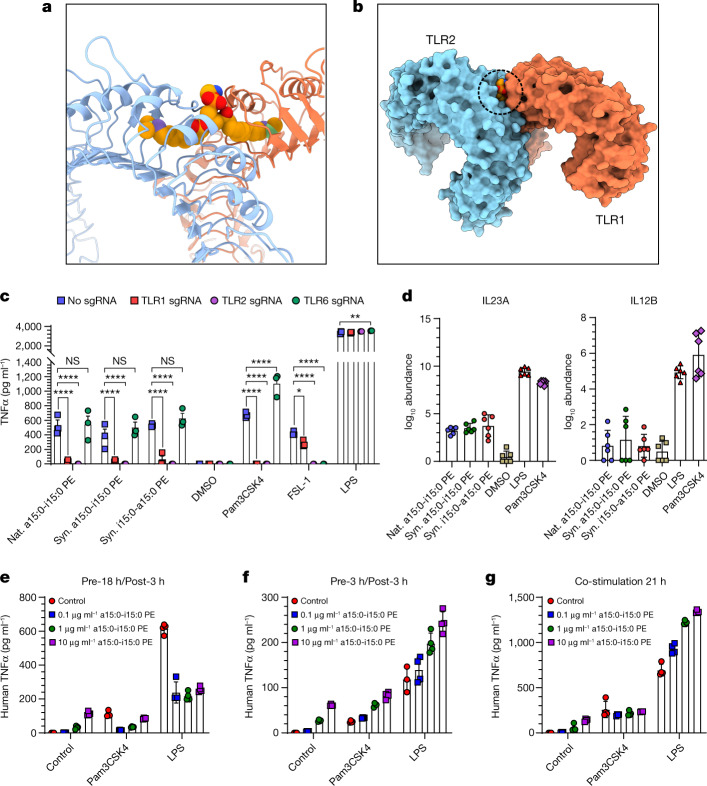
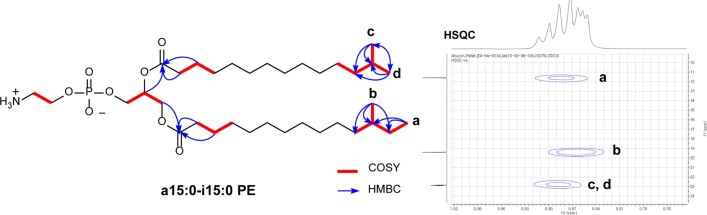
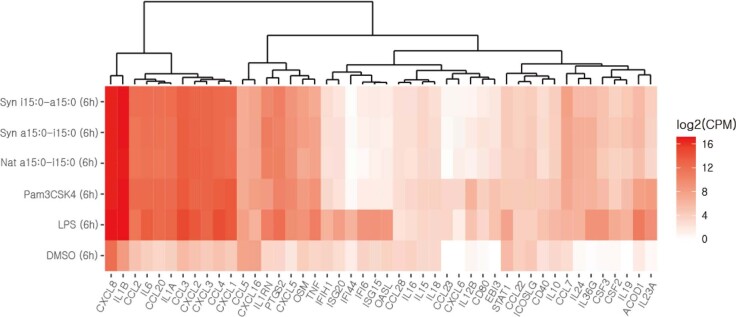
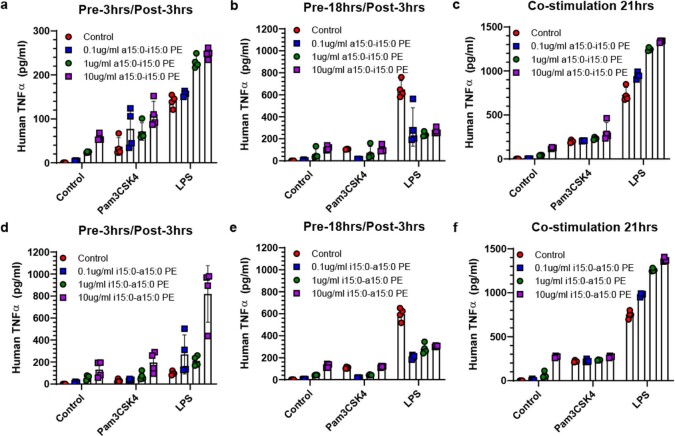
Abstract Multiple studies have established associations between human gut bacteria and host physiology, but determining the molecular mechanisms underlying these associations has been challenging 1–3 . Akkermansia muciniphila has been robustly associated with positive systemic effects on host metabolism, favourable outcomes to checkpoint blockade in cancer immunotherapy and homeostatic immunity 4–7 . Here we report the identification of a lipid from A. muciniphila ’s cell membrane that recapitulates the immunomodulatory activity of A. muciniphila in cell-based assays 8 . The isolated immunogen, a diacyl phosphatidylethanolamine with two branched chains (a15:0-i15:0 PE), was characterized through both spectroscopic analysis and chemical synthesis. The immunogenic activity of a15:0-i15:0 PE has a highly restricted structure–activity relationship, and its immune signalling requires an unexpected toll-like receptor TLR2–TLR1 heterodimer 9,10 . Certain features of the phospholipid’s activity are worth noting: it is significantly less potent than known natural and synthetic TLR2 agonists; it preferentially induces some inflammatory cytokines but not others; and, at low doses (1% of EC 50 ) it resets activation thresholds and responses for immune signalling. Identifying both the molecule and an equipotent synthetic analogue, its non-canonical TLR2–TLR1 signalling pathway, its immunomodulatory selectivity and its low-dose immunoregulatory effects provide a molecular mechanism for a model of A. muciniphila’ s ability to set immunological tone and its varied roles in health and disease.
Overview
The claims and statistics of this paper haven’t been checked yet.
Run the check — free, no account needed. It reads the open-access text and checks the sources it cites.
Integrity signals
Registry
Cites
Statistics
Figures
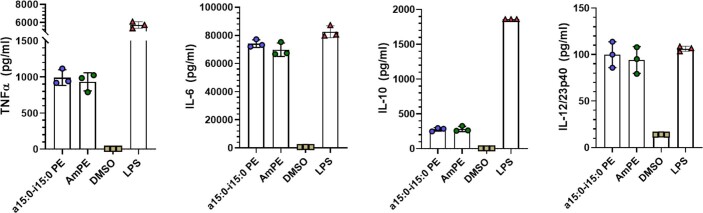
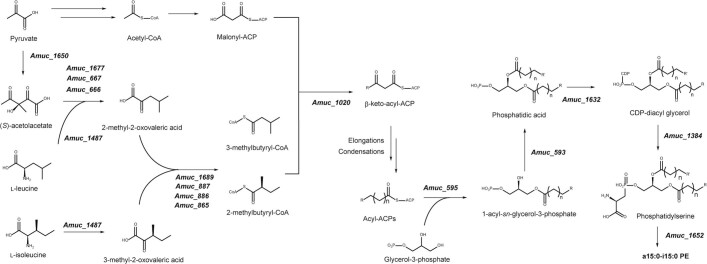
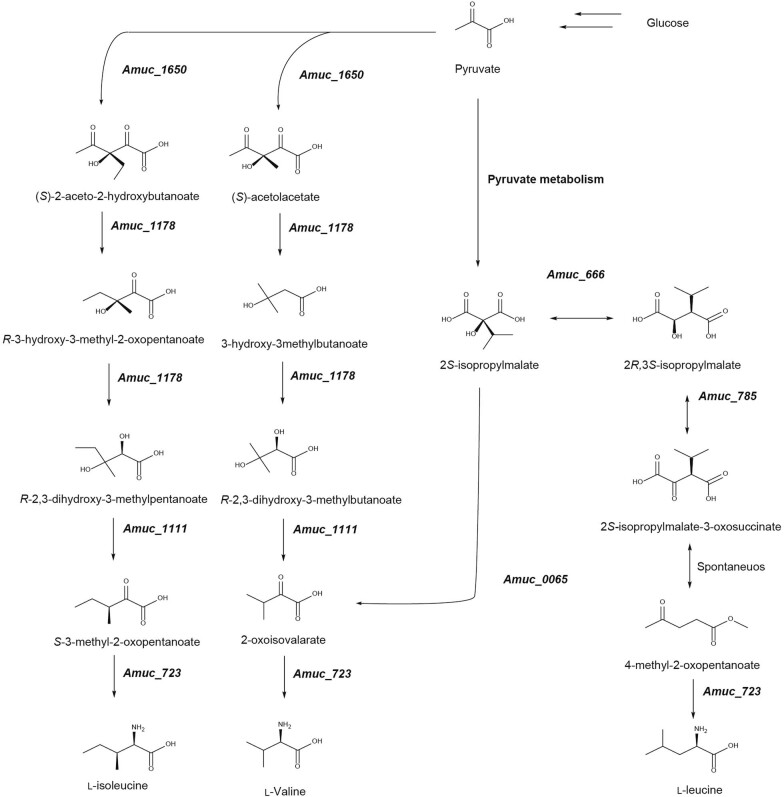
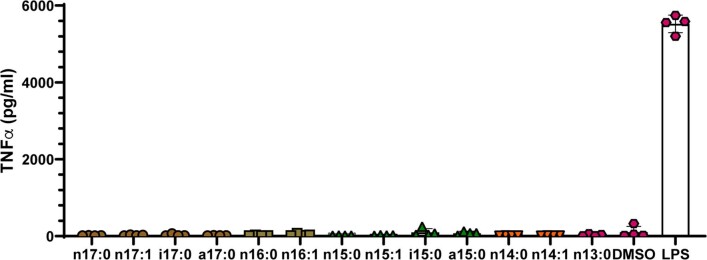
Verification
Claims the paper makes
The claims and statistics of this paper haven’t been checked yet.
Run the check — free, no account needed. It reads the open-access text and checks the sources it cites.
Claims other papers make about this one
Each is checked against this paper’s own text: does it say what the citing paper says it does?
The cited source says what the claim attributes to it.
In the citing paper
“while a lipid from Akkermansia’s cell membrane can activate a non-canonical TLR2-TLR1 pathway in immune cells42.”
From A non-antibiotic-disrupted gut microbiome is associated with clinical responses to CD19-CAR-T cell cancer immunotherapy (2023) · cites this paper as [42]
Self-check
Percentages, sums and reported differences re-computed from the paper’s own numbers.
The self-check needs the paper’s full text.
Citations
Cites
Robinson, M. D., McCarthy, D. J., & Smyth, G. K. (2010) · Bioinformatics · doi:10.1093/bioinformatics/btp616 · Cited by 41,364
Coot : model-building tools for molecular graphics
Emsley, P., & Cowtan, K. (2004) · Acta Crystallographica Section D Biological Crystallography · doi:10.1107/s0907444904019158 · Cited by 30,571
MultiQC: summarize analysis results for multiple tools and samples in a single report
Ewels, P., Magnusson, M., Lundin, S., & Käller, M. (2016) · Bioinformatics · doi:10.1093/bioinformatics/btw354 · Cited by 10,143
Near-optimal probabilistic RNA-seq quantification
Bray, N. L., Pimentel, H., Melsted, P., & Pachter, L. (2016) · Nature Biotechnology · doi:10.1038/nbt.3519 · Cited by 9,723
Akira, S., & Takeda, K. (2004) · Nature reviews. Immunology · doi:10.1038/nri1391 · Cited by 8,312
Gut microbiome influences efficacy of PD-1-based immunotherapy against epithelial tumors
Routy, B., Le Chatelier, E., Derosa, L., Duong, C. P. M., Alou, M. T., Daillère, R., Fluckiger, A., Messaoudene, M., Rauber, C., Roberti, M. P., et al. (2018) · Science · doi:10.1126/science.aan3706 · Cited by 5,671
UCSF ChimeraX: Meeting modern challenges in visualization and analysis
Goddard, T. D., Huang, C. C., Meng, E. C., Pettersen, E. F., Couch, G. S., Morris, J. H., & Ferrin, T. E. (2018) · Protein Science · doi:10.1002/pro.3235 · Cited by 5,267
Gut microbiota in human metabolic health and disease
Fan, Y., & Pedersen, O. (2021) · Nature Reviews Microbiology · doi:10.1038/s41579-020-0433-9 · Cited by 4,724
Cross-talk between Akkermansia muciniphila and intestinal epithelium controls diet-induced obesity
Everard, A., Belzer, C., Geurts, L., Ouwerkerk, J. P., Druart, C., Bindels, L. B., Guiot, Y., Derrien, M., Muccioli, G. G., Delzenne, N. M., et al. (2013) · Proceedings of the National Academy of Sciences · doi:10.1073/pnas.1219451110 · Cited by 4,511
Depommier, C., Everard, A., Druart, C., Plovier, H., Van Hul, M., Vieira-Silva, S., Falony, G., Raes, J., Maiter, D., Delzenne, N. M., et al. (2019) · Nature Medicine · doi:10.1038/s41591-019-0495-2 · Cited by 2,357
Cited by
Sorted by citations
Items 101–200 of 414
Feng, C., Li, N., Gao, G., He, Q., Kwok, L., & Zhang, H. (2024) · International Journal of Molecular Sciences · doi:10.3390/ijms25073768 · Cited by 27
Novel Candidate Microorganisms for Fermentation Technology: From Potential Benefits to Safety Issues
Ağagündüz, D., Yılmaz, B., Koçak, T., Başar, H. A., Rocha, J. M., & Özoğul, F. (2022) · Foods · doi:10.3390/foods11193074 · Cited by 27
Small molecule modulators of immune pattern recognition receptors
Tsukidate, T., Hespen, C. W., & Hang, H. C. (2023) · RSC Chemical Biology · doi:10.1039/d3cb00096f · Cited by 26
Liang, Z., Bian, Y., Gu, J. F., Yin, G., Sun, R. L., Liang, Y., Wan, L. L., Yin, Q. H., Wang, X., Gao, J., et al. (2023) · Phytomedicine · doi:10.1016/j.phymed.2023.154772 · Cited by 25
Wang, T., Liao, H., Lin, J., Zhang, M., Chen, B., Yin, R., Sun, J., Dai, H., & Liu, H. (2024) · Phytomedicine · doi:10.1016/j.phymed.2024.155575 · Cited by 27
Microbial metabolite-receptor interactions in the gut microbiome
Chang, P. V. (2024) · Current Opinion in Chemical Biology · doi:10.1016/j.cbpa.2024.102539 · Cited by 31
Akkermansia muciniphila and osteoporosis: emerging role of gut microbiota in skeletal homeostasis
Gong, Y., Ma, X., Huang, J., Zhang, P., Hai, Y., Song, Y., Song, M. S., Li, Y., Wen, H., & Dong, W. (2025) · Frontiers in Microbiology · doi:10.3389/fmicb.2025.1665101 · Cited by 26
Aloe-Emodin Ameliorates Cecal Ligation and Puncture-Induced Sepsis
Su, J., Chen, S., Xiao, J., Feng, Z., Hu, S., Su, Q., Chen, Q., & Chen, D. (2023) · International Journal of Molecular Sciences · doi:10.3390/ijms241511972 · Cited by 25
Olm, M. R., Spencer, S. P., Takeuchi, T., Silva, E. L., & Sonnenburg, J. L. (2025) · Nature Microbiology · doi:10.1038/s41564-024-01887-4 · Cited by 26
Park, J. S., Gazzaniga, F. S., Kasper, D. L., & Sharpe, A. H. (2023) · Experimental & Molecular Medicine · doi:10.1038/s12276-023-01075-0 · Cited by 25
Ren, P., Yu, X., Yue, H., Tang, Q., Wang, Y., & Xue, C. (2023) · Food & Function · doi:10.1039/d3fo02986g · Cited by 23
Barone, C. M., Heaver, S. L., Gruber, L., Zundel, F., Vu, D. L., & Ley, R. E. (2024) · Cell Host & Microbe · doi:10.1016/j.chom.2024.04.021 · Cited by 23
The biofunction of Akkermansia muciniphila in intestinal-related diseases
Jiang, P., Ji, S., Su, D., Zhao, Y., Goncalves, V. B. E., Xu, G., & Zhang, M. (2024) · Microbiome Research Reports · doi:10.20517/mrr.2024.12 · Cited by 23
Sun, X., Shan, X., Zhu, B., Cai, Y., He, Z., Zhou, L., Yin, L., Liu, Y., Liu, K., Zhang, T., et al. (2024) · Advanced Healthcare Materials · doi:10.1002/adhm.202403587 · Cited by 25
Fucoidan exerts antitumor effects by regulating gut microbiota and tryptophan metabolism
Ren, P., Liu, M., Wei, B., Tang, Q., Wang, Y., & Xue, C. (2025) · International Journal of Biological Macromolecules · doi:10.1016/j.ijbiomac.2025.140334 · Cited by 26
Ren, P., Yue, H., Tang, Q., Wang, Y., & Xue, C. (2024) · International Immunopharmacology · doi:10.1016/j.intimp.2024.111553 · Cited by 25
Cheng, G., Kong, W., Lin, R., Jiang, Z., Wang, X., Qin, X., Shi, Y., Yang, P., Chen, X., Xia, L., et al. (2025) · Microbiome · doi:10.1186/s40168-025-02124-8 · Cited by 23
Self-citationLiu, Q., Wu, Y., Fan, Q., Liu, J., Chen, Y., He, Y., Wei, W., Zhang, H., Zhao, Y., He, Y., et al. (2025) · ACS Nano · doi:10.1021/acsnano.5c01158 · Cited by 22
Pansai, N., Detarun, P., Chinnaworn, A., Sangsupawanich, P., & Wichienchot, S. (2023) · Food Research International · doi:10.1016/j.foodres.2023.112657 · Cited by 23
Gut modulation to regulate NF-κB in colorectal and gastric cancer therapy and inflammation
Kearns, R. (2025) · Cancer Immunology Immunotherapy · doi:10.1007/s00262-025-04118-9 · Cited by 24
Yang, X. N., Karrar, E. M. A., Cong, F., Lu, H., Jin, Q., Xu, X., Huppertz, T., Wei, W., & Wang, X. (2023) · International Dairy Journal · doi:10.1016/j.idairyj.2023.105587 · Cited by 21
Luo, F., Zhou, P., Xiong, R., Gu, M., & Zhou, S. (2023) · Scientific Reports · doi:10.1038/s41598-023-45545-x · Cited by 22
He, Z., Wang, T., Zhang, S., Shi, K., Wang, F., Li, Y., Lin, C., & Chen, J. (2023) · Frontiers in Microbiology · doi:10.3389/fmicb.2023.1279996 · Cited by 22
Gut community structure as a risk factor for infection in Klebsiella pneumoniae -colonized patients
Vornhagen, J., Rao, K. K., & Bachman, M. A. (2024) · mSystems · doi:10.1128/msystems.00786-24 · Cited by 20
Zeng, J., He, Z., Wang, G., Ma, Y., & Zhang, F. (2025) · MedComm · doi:10.1002/mco2.70265 · Cited by 29
Phospholipid metabolism in innate immunity and inflammation: from basic to clinic
Liu, J., Chen, Y., & O'Neill, L. A. J. (2025) · Immunity & Inflammation · doi:10.1007/s44466-025-00001-5 · Cited by 23
Revisiting Coley’s Toxins: Immunogenic Cardiolipins from Streptococcus pyogenes
Shin, Y., Bang, S., Park, S., Ma, X., Cassilly, C. D., Graham, D. B., Xavier, R. J., & Clardy, J. (2023) · Journal of the American Chemical Society · doi:10.1021/jacs.3c07727 · Cited by 20
Self-citationRole of gut microbiome in suppression of cancers
Xu, Y., Gao, Z., Liu, J., Yang, Q., & Xu, S. (2025) · Gut Microbes · doi:10.1080/19490976.2025.2495183 · Cited by 21
Interaction between gut microbiota and T cell immunity in colorectal cancer
Jing, Z., Wu, Y., Chu, J., Zhanbo, Q., Wu, X., & Han, S. (2025) · Autoimmunity Reviews · doi:10.1016/j.autrev.2025.103807 · Cited by 20
Li, J., Guo, Y., Liu, J., Guo, F., Du, L., Yang, Y. P., Li, X., & Ma, Y. (2023) · Journal for ImmunoTherapy of Cancer · doi:10.1136/jitc-2023-007420 · Cited by 18
Cuaycal, A. E., Teixeira, L. D., Lorca, G. L., & González, C. F. (2023) · Gut Microbes · doi:10.1080/19490976.2023.2252447 · Cited by 18
Effect of Human Milk Oligosaccharides on Learning and Memory in Mice with Alzheimer’s Disease
Gao, H., Fang, B., Sun, Z., Du, X., Guo, H., Zhao, L., & Zhang, M. (2023) · Journal of Agricultural and Food Chemistry · doi:10.1021/acs.jafc.3c05949 · Cited by 18
Mechanisms by which sheep milk consumption ameliorates insulin resistance in high-fat diet-fed mice
Zhang, L., Liu, J., Wang, Y., Wei, M., Liu, X., Jiang, Y., Wang, X., Zhu, Z., Niu, C., Liu, S., et al. (2024) · Food Research International · doi:10.1016/j.foodres.2024.114021 · Cited by 18
Self-citationWu, C., Yang, J., Ye, C., Wu, H., Shu, W., Li, R., Wang, S., Lü, Y., Chen, H., Zhang, Z., et al. (2024) · Heliyon · doi:10.1016/j.heliyon.2024.e34528 · Cited by 18
Lei, L., Zhu, T., Cui, T.-J., Liu, Y., Hocher, J.-G., Chen, X., Zhang, X.-M., Cai, K., Deng, Z.-Y., Wang, X., et al. (2024) · American Journal of Physiology-Cell Physiology · doi:10.1152/ajpcell.00367.2024 · Cited by 18
Self-citationImpact of astaxanthin on the capacity of gut microbiota to produce tryptophan catabolites
Ren, P., Wei, B., Qin, W., Tang, Q., Wang, Y., & Xue, C. (2024) · Food & Function · doi:10.1039/d4fo04890c · Cited by 17
Unraveling the role of the gut microbiome in pregnancy disorders: insights and implications
Xie, Y., Chen, Q., Shan, D., Pan, X., & Hu, Y. (2025) · Frontiers in Cellular and Infection Microbiology · doi:10.3389/fcimb.2025.1521754 · Cited by 18
Cao, Y., Fan, X., Zang, T., Qiu, T., Fang, Q., Bai, J., & Liu, Y. (2025) · Translational Psychiatry · doi:10.1038/s41398-025-03606-x · Cited by 21
Metabolic heterogeneity in tumor microenvironment – A novel landmark for immunotherapy
Chen, C., Han, P., & Qing, Y. (2024) · Autoimmunity Reviews · doi:10.1016/j.autrev.2024.103579 · Cited by 17
Menjivar, C., Pagella, E. A., & Biswas, I. (2024) · Trends in Microbiology · doi:10.1016/j.tim.2024.08.010 · Cited by 17
Intestinal microflora and metabolites affect the progression of acute pancreatitis (AP)
Wang, Z., Guo, M., Yang, S., Chen, Y., Cheng, J., Huang, Z., Wang, T., Zhang, W., Gama, L., Zhaxi, C., et al. (2024) · Gut Pathogens · doi:10.1186/s13099-024-00652-6 · Cited by 20
Cao, Y., Fan, X., Zang, T., Li, Y., Tu, Y., Yi, W., Bai, J., & Liu, Y. (2025) · Psychiatry Research · doi:10.1016/j.psychres.2025.116392 · Cited by 16
Wang, J., Liu, X., Sun, R., Mao, H., Liu, M., & Jin, X. (2023) · PLoS Pathogens · doi:10.1371/journal.ppat.1011683 · Cited by 16
Self-citationHan, L., Liu, X., Lan, Y., Hua, Y., Fan, Z.-X., & Li, Y.-F. (2024) · Frontiers in Immunology · doi:10.3389/fimmu.2024.1416185 · Cited by 19
Self-citationNechalová, L., Bielik, V., Hric, I., Babicová, M., Baranovičová, E., Grendár, M., Koška, J., & Penesová, A. (2024) · BMC Sports Science Medicine and Rehabilitation · doi:10.1186/s13102-024-01029-7 · Cited by 18
Zhao, M., Wang, P., Sun, X., Yang, D., Zhang, S., Meng, X., Zhang, M., & Gao, X. (2023) · Molecules · doi:10.3390/molecules28227562 · Cited by 14
Polypeptides synthesized by common bacteria in the human gut improve rodent metabolism
Fan, Y., Lyu, L., Vazquez-Uribe, R., Zhang, W., Bongers, M., Koulouktsis, A., Yang, M., Sereikaité, V., Arora, T., Stankevič, E., et al. (2025) · Nature Microbiology · doi:10.1038/s41564-025-02064-x · Cited by 15
Yang, L., Yang, J., Kong, X., Tang, Q., Song, R., Zhou, K., Quan, X., Zhang, Q., Zhang, Y., Zhang, C., et al. (2025) · Gut Microbes · doi:10.1080/19490976.2025.2587405 · Cited by 16
Microbiome Alterations and Alzheimer’s Disease: Modeling Strategies with Transgenic Mice
López-Villodres, J. A., Escamilla, A., Mercado-Sáenz, S., Alba-Tercedor, C., Rodríguez‐Pérez, L., Arranz‐Salas, I., Sanchez-Varo, R. M., & Bermúdez, D. (2023) · Biomedicines · doi:10.3390/biomedicines11071846 · Cited by 16
Archaeal Glycerolipids Are Recognized by C-Type Lectin Receptor Mincle
Oka, S., Watanabe, M., Ito, E., Takeyama, A., Matsuoka, T., Takahashi, M., Izumi, Y., Arichi, N., Ohno, H., Yamasaki, S., et al. (2023) · Journal of the American Chemical Society · doi:10.1021/jacs.3c05473 · Cited by 15
Yang, H., Shi, P., Li, M., Kong, L., Liu, S., Jiang, L., Yang, J., Xu, B., Yang, T., Xi, S., et al. (2023) · Ecotoxicology and Environmental Safety · doi:10.1016/j.ecoenv.2023.115660 · Cited by 16
Evolutionarily related host and microbial pathways regulate fat desaturation in C. elegans
Fox, B. W., Helf, M. J., Burkhardt, R. N., Artyukhin, A. B., Curtis, B. J., Palomino, D. F., Schroeder, A. F., Chaturbedi, A., Tauffenberger, A., Wrobel, C. J. J., et al. (2024) · Nature Communications · doi:10.1038/s41467-024-45782-2 · Cited by 15
Yan, S., Chen, L., Li, N., Wei, X., Wang, J., Dong, W., Wang, Y., Shi, J., Ding, X., & Peng, Y. (2024) · Bioresources and Bioprocessing · doi:10.1186/s40643-024-00766-4 · Cited by 17
Sun, L., Zhang, Y., Dong, W., Sun, J., Wang, T., Shao, F., Dai, H., Han, J., Wang, W., Wang, S., et al. (2025) · iMeta · doi:10.1002/imt2.70066 · Cited by 15
Akkermansia muciniphila extracellular vesicles: Function and theranostic potential in disease
Wang, Y.-D., Lin, W., Wu, S., He, X., Ou, Z., & Zheng, L. (2025) · LabMed discovery. · doi:10.1016/j.lmd.2025.100060 · Cited by 14
The gut-brain axis in the context of colorectal cancer
Wu, H., He, K., Wang, H., Li, W., Huo, R., Jiang, S., & Xue, J. (2025) · Pharmacological Research · doi:10.1016/j.phrs.2025.107816 · Cited by 16
Yan, X., Lin, X., Wu, J., Zheng, L., Liu, Y., Wu, F., Lin, Y., Lu, Y., Huang, C., Shen, B., et al. (2025) · BMC Medicine · doi:10.1186/s12916-025-04233-5 · Cited by 14
The multi-kingdom cancer microbiome
Dohlman, A. B., Pan, X., Zitvogel, L., & Iliev, I. D. (2025) · Nature Microbiology · doi:10.1038/s41564-025-02103-7 · Cited by 16
CRISPR-engineered microbiome: living therapeutics revolutionize blood cancer immunotherapy
Cheng, F., Samarkhazan, H. S., & Khazaei, Y. (2025) · npj Biofilms and Microbiomes · doi:10.1038/s41522-025-00882-9 · Cited by 15
Wang, B., Pan, M., Yang, L., Xu, J., Ye, C., Li, Y., Gong, Q., Liu, C., Li, L., Qin, J., et al. (2026) · Alzheimer s Research & Therapy · doi:10.1186/s13195-025-01880-x · Cited by 17
Akkermansia muciniphila Metabolite Inosine Inhibits Castration Resistance in Prostate Cancer
Yu, Y., Li, L., Yang, Q., Xue, J., Wang, B., Xie, M., Shangguan, W., Zhu, Z., & Wu, P. (2024) · Microorganisms · doi:10.3390/microorganisms12081653 · Cited by 16
Chemical genetic approaches to dissect microbiota mechanisms in health and disease
Yang, X., & Hang, H. C. (2024) · Science · doi:10.1126/science.ado8548 · Cited by 16
Liu, D., Meng, W., Fang, Y., Yuan, T., Sun, Y., Xie, H. Q., Yan, W., Yuan, B., Zhuang, B., & Jin, Y. (2024) · International Journal of Biological Macromolecules · doi:10.1016/j.ijbiomac.2024.139199 · Cited by 14
Epigenetic phase variation in the gut microbiome enhances bacterial adaptation
Ni, M., Junker, K., Liu, Y., Fan, Y., Li, Y., Qiao, W., Zhang, X.-S., Ksiezarek, M., Mead, E. A., Tourancheau, A., et al. (2026) · Cell Host & Microbe · doi:10.1016/j.chom.2026.04.019 · Cited by 13
Application of bacterial extracellular vesicles in gastrointestinal diseases
Wang, Y., Zu, M., Li, B., Reis, R. L., Kundu, S. C., & Xiao, B. (2025) · Trends in biotechnology · doi:10.1016/j.tibtech.2025.05.022 · Cited by 14
Hughes, E. R., Panzetta, M. E., Sharma, A., & Valdivia, R. H. (2025) · Annual Review of Microbiology · doi:10.1146/annurev-micro-051524-032131 · Cited by 14
Liu, J., Zhu, W., Liu, H., Ren, X., Qin, N., & Xia, X. (2023) · Food Science and Human Wellness · doi:10.26599/fshw.2022.9250215 · Cited by 14
Xu, W., Zhang, S., Yang, Y., Zhan, J., Zang, C., Yu, H., & Wu, C. (2024) · Food Frontiers · doi:10.1002/fft2.341 · Cited by 13
Chen, J., Cheng, J., Li, F., Deng, Y., Li, Y., Li, H., Zeng, J.-Y., You, Y., Zhou, X., Chen, Q., et al. (2024) · Phytomedicine · doi:10.1016/j.phymed.2024.155787 · Cited by 13
Kang, Y. Y., Song, H. J., Park, S. Y., Oh, D. N., Kim, G. Y., Been, N. Y., Kim, D. Y., Lee, E. J., Nam, B., & Lee, J. M. (2025) · Journal of Microbiology and Biotechnology · doi:10.4014/jmb.2411.11045 · Cited by 13
Self-citationFormation and Tandem Mass Spectrometry of Doubly Charged Lipid-Metal Ion Complexes
Hormann, F.-L., Sommer, S., & Heiles, S. (2023) · Journal of the American Society for Mass Spectrometry · doi:10.1021/jasms.3c00126 · Cited by 13
Diet-derived microbial metabolites as regulators of immune function
Siracusa, F., Machicote, A., Huber, S., & Gagliani, N. (2025) · Current Opinion in Immunology · doi:10.1016/j.coi.2025.102713 · Cited by 16
Mucin-degrading gut bacteria: context-dependent roles in intestinal homeostasis and disease
Tiffany, E., Kim, K. S., Sittipo, P., Lee, D.-W., & Lee, Y. K. (2026) · Gut Microbes · doi:10.1080/19490976.2026.2614054 · Cited by 16
Discovery of novel alkaline-tolerant xylanases from fecal microbiota of dairy cows
Zhang, X., Miao, Q., Tang, B., Mijakovic̀, I., Ji, X., Qu, L., & Wei, Y. (2023) · Biotechnology for Biofuels and Bioproducts · doi:10.1186/s13068-023-02435-8 · Cited by 12
Han, L., Sun, X., Kong, J., Li, J., Feng, K., Bai, Y., Wang, X., Zhu, Z., Yang, F., Chen, Q., et al. (2024) · Journal of Translational Medicine · doi:10.1186/s12967-024-05577-x · Cited by 13
Wang, R., Zhang, X., Wang, Y., Lin, Y., Zhou, Y., Wang, Y., & Li, G. (2024) · Clinical and Translational Medicine · doi:10.1002/ctm2.70035 · Cited by 12
Global trends in Akkermansia muciniphila research: A bibliometric visualization
Li, Z., Ke, H., Wang, Y., Chen, S., Liu, X., Lin, Q., Wang, P., & Chen, Y. (2022) · Frontiers in Microbiology · doi:10.3389/fmicb.2022.1037708 · Cited by 12
Self-citationThe microbial revolution: Akkermansia muciniphila's role in overcoming immunotherapy challenges
Shi, Y., Fu, Y., & Tang, D. (2025) · International Immunopharmacology · doi:10.1016/j.intimp.2025.115374 · Cited by 11
Gao, H., Wang, Y., Zhao, Y., Jiao, X., Guo, Z., Zheng, L., Li, Y., Su, Y., Wang, Z., Bai, J., et al. (2025) · Nature Communications · doi:10.1038/s41467-025-66733-5 · Cited by 15
Park, S. Y., Choi, J. W., Oh, D. N., Lee, E. J., Kim, D. P., Yoon, S. J., Jang, W. J., Han, S. J., Lee, S., & Lee, J. M. (2023) · Journal of Microbiology and Biotechnology · doi:10.4014/jmb.2212.12005 · Cited by 11
Self-citationAkkermansia muciniphila induces slow extramedullary hematopoiesis via cooperative IL‐1R/TLR signals
Wang, Y., Morishima, T., Sezaki, M., Sato, R., Nakato, G., Fukuda, S., Kobiyama, K., Ishii, K. J., Li, Y., & Takizawa, H. (2023) · EMBO Reports · doi:10.15252/embr.202357485 · Cited by 14
Zhang, H., Zhang, S., Chen, L., Xu, R. P., & Zhu, J. (2024) · Journal of Microbiological Methods · doi:10.1016/j.mimet.2024.106975 · Cited by 11
Quantitative and dynamic profiling of human gut core microbiota by real-time PCR
Yan, Z., Hao, T., Yan, Y., Zhao, Y.-T., Wu, Y., Tan, Y., Cui, Y., Cui, Y., Yang, R., & Zhao, Y. (2024) · Applied Microbiology and Biotechnology · doi:10.1007/s00253-024-13204-4 · Cited by 11
Yin, Q., Ni, J., & Ying, J. (2024) · Immunity Inflammation and Disease · doi:10.1002/iid3.1263 · Cited by 12
Green, C. R., Alaeddine, L. M., Wessendorf-Rodriguez, K. A., Turner, R., Elmastas, M., Hover, J. D., Murphy, A. N., Rydén, M., Mejhert, N., Metallo, C. M., et al. (2024) · Journal of Biological Chemistry · doi:10.1016/j.jbc.2024.108004 · Cited by 11
Jing, Y., Wang, K., Pi, T., Chen, Z., Liu, T., Liu, X., Ye, H., Xu, X., & Zhao, Y. (2025) · International Journal of Biological Macromolecules · doi:10.1016/j.ijbiomac.2025.139850 · Cited by 11
Self-citationStructure Revision of a Widespread Marine Sulfonolipid Class Based on Isolation and Total Synthesis
Roman, D., Meisinger, P. R., Guillonneau, R., Peng, C., Peltner, L. K., Jordan, P. M., Haensch, V. G., Götze, S., Werz, O., Hertweck, C., et al. (2024) · Angewandte Chemie International Edition · doi:10.1002/anie.202401195 · Cited by 11
Modulation of oral vaccine efficacy by the gut microbiota
Hou, Y., Li, J., & Wu, Y. (2025) · npj Vaccines · doi:10.1038/s41541-025-01240-8 · Cited by 11
Long-read metagenomics for strain tracking after faecal microbiota transplant
Fan, Y., Ni, M., Aggarwala, V., Mead, E. A., Ksiezarek, M., Cao, L., Kamm, M. A., Borody, T. J., Paramsothy, S., Kaakoush, N. O., et al. (2025) · Nature Microbiology · doi:10.1038/s41564-025-02164-8 · Cited by 14
Selmi, H., Walker, A., Balas, L., Lucio, M., Klotz, M., Jeridi, A., Burrichter, A. G., Conti, D. E., Chaffringeon, L., Beinsteiner, B., et al. (2025) · Gut Microbes · doi:10.1080/19490976.2025.2601376 · Cited by 10
Liu, Y., Sun, Y., Fang, B., Wang, R., Lan, H., Zhao, W. H., Hung, W., Zhao, L., & Zhang, M. (2025) · Journal of Agricultural and Food Chemistry · doi:10.1021/acs.jafc.5c10317 · Cited by 11
A phospholipid immunomodulator from Akkermansia muciniphila
Ghosh, S., & Mani, S. (2022) · Cell Host & Microbe · doi:10.1016/j.chom.2022.08.014 · Cited by 10
The Therapeutic Potential of the Specific Intestinal Microbiome (SIM) Diet on Metabolic Diseases
Chu, N. H. S., Chow, E., & Chan, J. C. N. (2024) · Biology · doi:10.3390/biology13070498 · Cited by 11
Sun, R., Yu, P., Guo, L., Huang, Y., Nie, Y., & Yang, Y. (2024) · Metabolic Engineering · doi:10.1016/j.ymben.2024.10.002 · Cited by 10
Chen, K., Kuo, T.-H., & Hsu, C. (2024) · Analytical Chemistry · doi:10.1021/acs.analchem.4c02697 · Cited by 10
Unusual Phospholipids from Morganella morganii Linked to Depression
Bang, S., Shin, Y., Park, S., Deng, L., Williamson, R. T., Graham, D. B., Xavier, R. J., & Clardy, J. (2025) · Journal of the American Chemical Society · doi:10.1021/jacs.4c15158 · Cited by 11
Self-citationAchasova, K. M., Snytnikova, O. A., Chanushkina, K. E., Morozova, M. V., Tsentalovich, Y. P., & Kozhevnikova, E. N. (2025) · Scientific Reports · doi:10.1038/s41598-025-96514-5 · Cited by 10
The efficacy of Akkermansia muciniphila YGMCC2602-derived postbiotics in skin repair
He, Z., Song, W., Zhang, S., Zhao, M., Wang, F., He, S., Jie, X., Gao, Q., & Chen, J. (2025) · Journal of Functional Foods · doi:10.1016/j.jff.2025.106950 · Cited by 10
Xu, Z., Man, S., Gong, B.-Y., Li, Z., Zhou, H., Peng, Y., Zhao, S., Hou, Y., Wang, L., & Bian, Y. (2023) · Journal of the Science of Food and Agriculture · doi:10.1002/jsfa.12812 · Cited by 10
The impacts of biologic treatment on metabolic profiling in psoriasis
Deng, S., Zhou, G., Li, X., Zhang, G., Hu, K., Lu, Y. Z., Li, J., Liu, Y., Zhou, G., Zhang, M., et al. (2024) · Experimental Dermatology · doi:10.1111/exd.15011 · Cited by 10
Metadata
- Authors
- Bae, M., Cassilly, C. D., Liu, X., Park, S.-M., Tusi, B. K., Chen, X., Kwon, J., Filipčík, P., Bolze, A. S., Liu, Z., Vlamakis, H., Graham, D. B., Buhrlage, S. J., Xavier, R. J., & Clardy, J.
- Affiliations
- Gachon University (KR)
- Harvard University (US)
- Broad Institute (US)
- Corresponding author
- Xavier, Ramnik J.
- Clardy, Jon
- ORCID
- Venue
- Nature
- Published
- 2022-07-27
- Volume
- 608
- Issue
- 7921
- Pages
- 168-173
- ISSN
- 0028-0836 (ISSN-L)
- 1476-4687
- PMC
- PMC9328018
- OpenAlex
- W4288052200
- Cited by
- 413
- References
- 52
- Citations by year
- 2026: 72 · 2025: 126 · 2024: 102 · 2023: 95 · 2022: 18
- FWCI
- 32.66
- Type
- journal article
- Language
- en
- Open access
- hybrid
- doi.org
- Locations
- Nature (publishedVersion, cc-by)
- PubMed Central (publishedVersion, cc-by)
- PubMed (publishedVersion)
- Digital Access to Scholarship at Harvard (DASH) (Harvard University) (acceptedVersion)
- RePEc: Research Papers in Economics (submittedVersion)
- Funders
- Massachusetts General Hospital
- National Institutes of Health
- National Institute of Allergy and Infectious Diseases (R01AI172147)
- National Institute of Diabetes and Digestive and Kidney Diseases (RC2DK114784, P30DK043351, R01DK131742, R01DK127171)
- National Center for Complementary and Integrative Health (F32AT010415, R01AT009708)
- Topics
- Life Sciences › Immunology and Microbiology › Immunology › Immune Response and Inflammation
- Life Sciences › Biochemistry, Genetics and Molecular Biology › Molecular Biology › Gut microbiota and health
- Life Sciences › Immunology and Microbiology › Immunology › T-cell and B-cell Immunology
- Keywords
- Akkermansia muciniphila, immunomodulation, Toll-like receptor signaling, structure-activity relationship, gut microbiota, immune homeostasis, inflammatory cytokines, synthetic analogues
- MeSH terms
- Akkermansia, Cell Membrane, Homeostasis, Humans, Immunity, Phosphatidylethanolamines, Structure-Activity Relationship, Cytokines, Inflammation Mediators, Toll-Like Receptor 1, Toll-Like Receptor 2
About these checks
Registry, retraction, Cites and statistics results are computed, not judged, with one exception: a printed reference that no index lists is read once by a model before it counts as a citation error. Claims are extracted by a model and kept only when their quote appears verbatim in the text; each cited source is then checked, with a model’s help, for whether it says what the claim relies on. Those verdicts can be wrong — read the claim’s quote and the cited source before relying on one.
Statistics and arithmetic are recomputed, not judged.
Confidence bands are shown only for fields calibrated on our annotated test set. None is calibrated yet, so no band is shown.
What counts as a claim ›How we measure confidence ›How we check this ›
Are you an author, or do you see a problem with this page? Request a review
