Cited by 103Acute Myeloid Leukemia ResearchEpigenetics and DNA MethylationRNA modifications and cancer

The DOI matches its Crossref record; 65 of the 65 references it cites were found in a registry or an index; none of the 47 sources its claims cite is checked for support yet.

RNA m5C oxidation by TET2 regulates chromatin state and leukaemogenesis

Open access

Abstract

Mutation of tet methylcytosine dioxygenase 2 (encoded by TET2 ) drives myeloid malignancy initiation and progression 1–3 . TET2 deficiency is known to cause a globally opened chromatin state and activation of genes contributing to aberrant haematopoietic stem cell self-renewal 4,5 . However, the open chromatin observed in TET2-deficient mouse embryonic stem cells, leukaemic cells and haematopoietic stem and progenitor cells 5 is inconsistent with the designated role of DNA 5-methylcytosine oxidation of TET2. Here we show that chromatin-associated retrotransposon RNA 5-methylcytosine (m 5 C) can be recognized by the methyl-CpG-binding-domain protein MBD6, which guides deubiquitination of nearby monoubiquitinated Lys119 of histone H2A (H2AK119ub) to promote an open chromatin state. TET2 oxidizes m 5 C and antagonizes this MBD6-dependent H2AK119ub deubiquitination. TET2 depletion thereby leads to globally decreased H2AK119ub, more open chromatin and increased transcription in stem cells. TET2- mutant human leukaemia becomes dependent on this gene activation pathway, with MBD6 depletion selectively blocking proliferation of TET2 -mutant leukaemic cells and largely reversing the haematopoiesis defects caused by Tet2 loss in mouse models. Together, our findings reveal a chromatin regulation pathway by TET2 through retrotransposon RNA m 5 C oxidation and identify the downstream MBD6 protein as a feasible target for developing therapies specific against TET2 mutant malignancies.

Overview

CoChat Summary

Written by AI from the paper’s full text.

TL;DR

TET2 oxidizes chromatin-associated retrotransposon RNA m5C, and TET2 loss increases m5C that is read by MBD6 to recruit PR-DUB/BAP1, deubiquitinate H2AK119ub, open chromatin, and activate leukaemogenic genes. Targeting MBD6 reverses Tet2-loss phenotypes in mouse HSPCs and impairs TET2-mutant leukaemia cell growth and xenograft progression.

Key findings

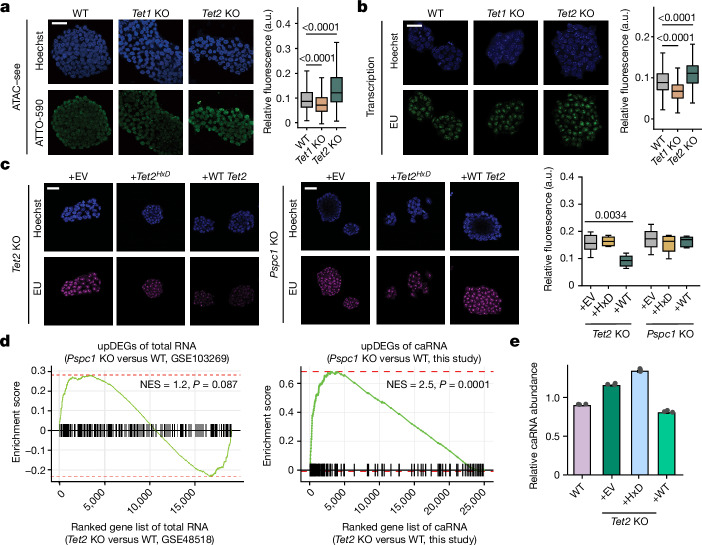
  • In mES cells, Tet2 KO increased chromatin accessibility and global transcription; WT Tet2, but not catalytically dead HxD, restored repression in Tet2-KO but not Pspc1-KO cells, implicating PSPC1-dependent RNA oxidation.
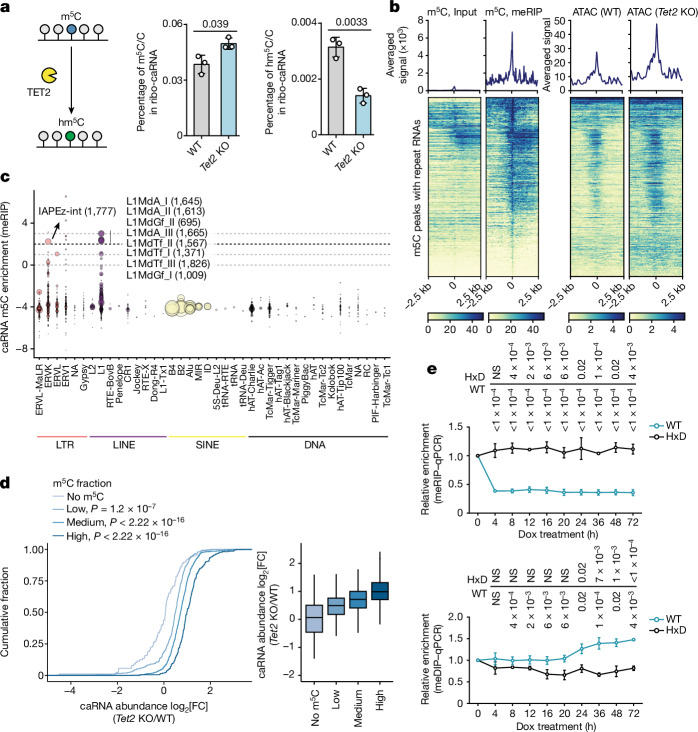
  • caRNA m5C is a TET2 substrate: Tet2 KO increased caRNA m5C and decreased hm5C; m5C peaks were enriched in repeat RNA, especially LTR/LINE families such as IAP. Nsun2 depletion reduced caRNA m5C by approximately 70% and closed chromatin; dCas13–TET2-CD targeting IAP reduced RNA m5C and increased local DNA 5mC.
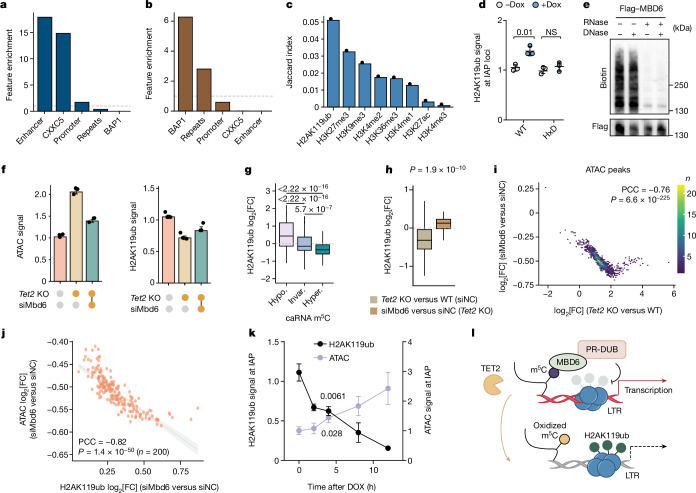
  • MBD6 reads m5C RNA and recruits PR-DUB: H2AK119ub ranked top among correlated marks; approximately 37% of ATAC–seq peaks were marked with H2AK119ub, H2AK119ub was downregulated in around 89% of those regions after Tet2 KO, and approximately 85% of regions with higher ATAC signals overlapped H2AK119ub loss. Mbd6 KD reversed chromatin opening and H2AK119ub loss.
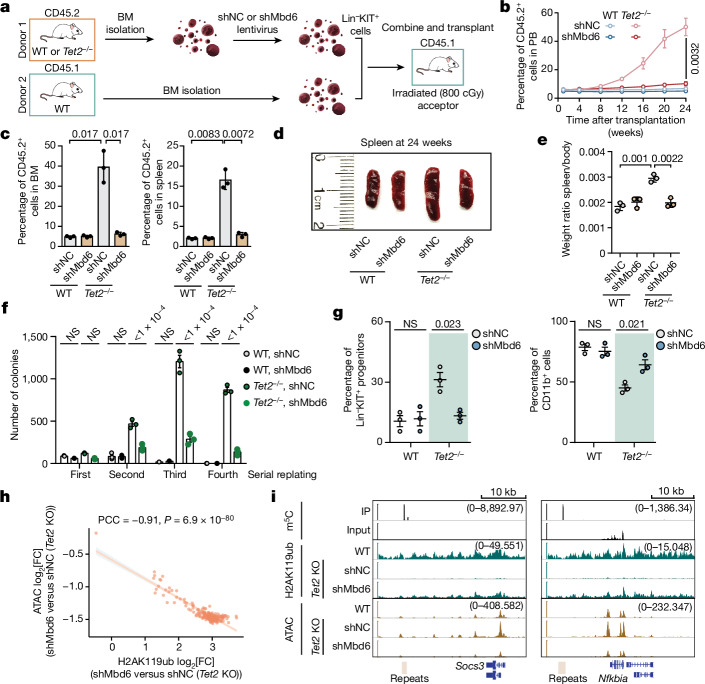
  • In vivo, Tet2−/− + shNC HSPC chimerism reached around 50% at 6 months versus around 5% with shMbd6; Mbd6 KD rescued splenomegaly and replating/differentiation defects. MBD6 KD blocked proliferation of TET2-mutant SKM-1 and TET2-KO K-562/THP-1 cells; in NSG xenografts, TET2-KO + shMBD6 recipients survived longer (reported ranges 125–135 days or 163–220 days).

Methods

  • Mouse mES cells (WT, Tet2-KO, Pspc1-KO), mouse HSPCs (Lin−KIT+), human leukaemia cell lines (SKM-1, K-562, THP-1 and others), NSG xenotransplantation, and competitive BM transplantation assays.
  • Assays included ATAC–seq/ATAC–see, RNA-seq/caRNA-seq, m5C meRIP–seq, UHPLC–MS/MS, RNA bisulfite amplicon sequencing, meDIP–seq, CUT&Tag, CLIP/PAR-CLIP, EMSA, dCas13/dCas9 tethering, ASO treatment, proliferation/colony formation, and flow cytometry.
  • Main analyses used spike-in-normalized genome-wide data, differential expression/accessibility/methylation, correlation analyses, and survival comparisons; most experiments used n = 3 biological replicates unless otherwise noted.

Limitations

  • The paper states that whether the oxidation product hm5C further promotes caRNA degradation remains to be investigated.
  • Evident from the text: mechanistic and in vivo evidence comes mainly from mouse mES cells/HSPCs and human leukaemia cell lines/xenografts, not primary TET2-mutant patient samples.
  • Evident from the text: MBD6 KD also suppressed transplanted TET2 WT human cells in vivo, so selectivity for TET2-mutant disease is not absolute; the study focused on MBD6, although MBD5 may have important roles in other cell types.

Model-written summary. Check it against the paper before relying on it.

Integrity signals

Registry

Crossref · 10.1038/s41586-024-07969-x

Cites

65 of 65 references verified0 citation errors · 0 not checkable

Statistics

Nothing to recompute.

Figures

Fig. 1 The elevated chromatin accessibility after Tet2 depletion is facilitated by PSPC1 through its RNA-binding activity in mES cells. a,b, Representative immunofluorescence images and quantification characterizing chromatin accessibility (a) and nascent RNA synthesis rate (b) of WT and Tet2-KO mES cells. a.u., arbitrary units; ATAC–see, assay of transposase-accessible chromatin with visualization; EU, 5-ethynyl uridine. c, Representative immunofluorescence images characterizing the nascent RNA synthesis rate in Tet2-KO (left) or Pspc1-KO (right) mES cells, overexpressing either an EV control, WT mouse Tet2 (WT) or catalytically dead mouse Tet2 (HxD). For a–c, six images were taken for each condition. For a–c, scale bars, 40 μm. d, GSEA enrichment analysis between genes upregulated (upDEGs) after Pspc1 depletion and upregulated DEGs after Tet2 KO in mES cells. Left, whole-cell RNA-seq (Gene Expression Omnibus (GEO): GSE103269 and GSE48518). Right, caRNA-seq (this study). e, Spike-in-calibrated overall caRNA levels in WT mES cells, and Tet2-KO mES cells overexpressing either EV control, WT or HxD. Data are mean. For a–c, the box plots show the median (centre line), upper and lower quartiles (box limits) and 1–99% (whiskers). P values were calculated using two-tailed Wilcoxon–Mann–Whitney tests (a and b), two-tailed unpaired t-tests with Welch’s correction (c) and two-tailed permutation tests (d). n = 3 biological replicates (a–c and e). The depicted genome-wide data represent an integration of three biological replicates. Source Data
Fig. 1 The elevated chromatin accessibility after Tet2 depletion is facilitated by PSPC1 through its RNA-binding activity in mES cells. a,b, Representative immunofluorescence images and quantification characterizing chromatin accessibility (a) and nascent RNA synthesis rate (b) of WT and Tet2-KO mES cells. a.u., arbitrary units; ATAC–see, assay of transposase-accessible chromatin with visualization; EU, 5-ethynyl uridine. c, Representative immunofluorescence images characterizing the nascent RNA synthesis rate in Tet2-KO (left) or Pspc1-KO (right) mES cells, overexpressing either an EV control, WT mouse Tet2 (WT) or catalytically dead mouse Tet2 (HxD). For a–c, six images were taken for each condition. For a–c, scale bars, 40 μm. d, GSEA enrichment analysis between genes upregulated (upDEGs) after Pspc1 depletion and upregulated DEGs after Tet2 KO in mES cells. Left, whole-cell RNA-seq (Gene Expression Omnibus (GEO): GSE103269 and GSE48518). Right, caRNA-seq (this study). e, Spike-in-calibrated overall caRNA levels in WT mES cells, and Tet2-KO mES cells overexpressing either EV control, WT or HxD. Data are mean. For a–c, the box plots show the median (centre line), upper and lower quartiles (box limits) and 1–99% (whiskers). P values were calculated using two-tailed Wilcoxon–Mann–Whitney tests (a and b), two-tailed unpaired t-tests with Welch’s correction (c) and two-tailed permutation tests (d). n = 3 biological replicates (a–c and e). The depicted genome-wide data represent an integration of three biological replicates. Source DataCC BY · PubMed Central
Fig. 2 Tet2 depletion led to elevated caRNA m5C methylation and abundance, resulting in local chromatin opening. a, The RNA m5C levels and 5-hydroxylmethylcytosine levels in the chromatin-associated fraction. m5C/C and hm5C/C values were obtained by normalizing absolute concentrations of m5C and hm5C to C. b, The average profile and heat map of the m5C level in WT mES cells, along with the corresponding ATAC–seq signals in WT and Tet2-KO mES cells on repeat RNA. The left colour bar shows meRIP signal and the right colour bar shows ATAC–seq signal. c, The m5C enrichment at various repeat RNA families. The size of each dot corresponds to the number of loci (subfamilies in ERVK or L1 shown) that were m5C methylated in WT mES cells. Exact loci numbers are indicated in parentheses. SINE, short interspersed nuclear element. d, Cumulative curve showing the log2-transformed fold change in repeat RNA expression after Tet2 KO. Repeat RNAs were grouped on the basis of their m5C enrichment quantified by log2[IP/input] using m5C meRIP-seq data. No m5C, log2[IP/input] < 1; low, 1 ≤ log2[IP/input] < 2; medium: 2 ≤ log2[IP/input] < 3; high, log2[IP/input] ≥ 3. e, Local RNA m5C and DNA 5mC changes at IAP loci at different timepoints after DOX-induced dCas13–TET2-CD tethering. P values were determined by comparing values at the corresponding timepoints with values at 0 h, individually. qPCR, quantitative PCR. For d, the box plots show the median (centre line), the upper and lower quartiles (box limits) and 1.5× the interquartile range (whiskers). For a and e, data are mean ± s.d. P values were calculated using two-tailed unpaired t-tests with Welch’s correction (a and e). NS, P > 0.05. n = 3 biological replicates (a and e). The depicted genome-wide data represent an integration of three biological replicates. Source Data
Fig. 2 Tet2 depletion led to elevated caRNA m5C methylation and abundance, resulting in local chromatin opening. a, The RNA m5C levels and 5-hydroxylmethylcytosine levels in the chromatin-associated fraction. m5C/C and hm5C/C values were obtained by normalizing absolute concentrations of m5C and hm5C to C. b, The average profile and heat map of the m5C level in WT mES cells, along with the corresponding ATAC–seq signals in WT and Tet2-KO mES cells on repeat RNA. The left colour bar shows meRIP signal and the right colour bar shows ATAC–seq signal. c, The m5C enrichment at various repeat RNA families. The size of each dot corresponds to the number of loci (subfamilies in ERVK or L1 shown) that were m5C methylated in WT mES cells. Exact loci numbers are indicated in parentheses. SINE, short interspersed nuclear element. d, Cumulative curve showing the log2-transformed fold change in repeat RNA expression after Tet2 KO. Repeat RNAs were grouped on the basis of their m5C enrichment quantified by log2[IP/input] using m5C meRIP-seq data. No m5C, log2[IP/input] < 1; low, 1 ≤ log2[IP/input] < 2; medium: 2 ≤ log2[IP/input] < 3; high, log2[IP/input] ≥ 3. e, Local RNA m5C and DNA 5mC changes at IAP loci at different timepoints after DOX-induced dCas13–TET2-CD tethering. P values were determined by comparing values at the corresponding timepoints with values at 0 h, individually. qPCR, quantitative PCR. For d, the box plots show the median (centre line), the upper and lower quartiles (box limits) and 1.5× the interquartile range (whiskers). For a and e, data are mean ± s.d. P values were calculated using two-tailed unpaired t-tests with Welch’s correction (a and e). NS, P > 0.05. n = 3 biological replicates (a and e). The depicted genome-wide data represent an integration of three biological replicates. Source DataCC BY · PubMed Central
Fig. 3 The activity of TET2 on RNA dictates the increased chromatin accessibility through MBD6-mediated H2AK119ub deubiquitination. a,b, Feature enrichment in hypermethylated differentially methylated regions (DMRs) compared with hypomethylated DMRs (hyperspecific; a), and in hypomethylated DMRs compared with hypermethylated DMRs (hypospecific; b) using the odds ratio. c, Overlapping ratios of histone modifications with DNA hypomethylated regions for Tet2-KO versus WT mES cells. d, The H2AK119ub levels at IAP loci after TET2-CD (catalytic domain; WT or catalytically dead HxD) tethering by dCas13. e, Representative image showing nucleic acids cross-linked to MBD6. f, Spike-in-calibrated ATAC–seq signals or H2AK119ub signals in WT (siNC WT) and Tet2-KO (siNC Tet2 KO) mES cells, as well as in Mbd6-KD Tet2-KO (siMbd6 Tet2 KO) mES cells. g, Changes in H2AK119ub on m5C hypomethylated (hypo.), unchanged (invar.) and hypermethylated (hyper.) repeat RNA after Tet2 KO versus WT. h, H2AK119ub changes in m5C hypermethylated repeat RNA in Tet2-KO versus WT compared with Mbd6-KD Tet2-KO versus Tet2-KO mES cells. i, The correlation between ATAC signal fold changes in Tet2-KO versus WT mES cells, and comparing Mbd6 KD with control Tet2-KO mES cells. PCC, Pearson correlation coefficient. j, The correlation between changes in ATAC and H2AK119ub signals, comparing Mbd6 KD with control Tet2-KO mES cells. k, The H2AK119ub levels and ATAC signal at IAP RNA after dCas13–MBD6-MBD tethering. l, Schematics of the proposed pathway of MBD6 regulating chromatin state through caRNA m5C binding. Data are mean ± s.d. (d and k) and mean ± s.e.m. (f). For g and h, the box plots show the median (centre line), the upper and lower quartiles (box limits) and 1.5× the interquartile range (whiskers). P values were calculated using two-tailed unpaired t-tests with Welch’s correction (d and k), two-tailed Wilcoxon–Mann–Whitney tests (g and h), two-tailed t-distribution with n − 2 d.f. (i and j). n = 3 biological replicates (d–f and k). The depicted genome-wide data represent an integration of three biological replicates. Source Data
Fig. 3 The activity of TET2 on RNA dictates the increased chromatin accessibility through MBD6-mediated H2AK119ub deubiquitination. a,b, Feature enrichment in hypermethylated differentially methylated regions (DMRs) compared with hypomethylated DMRs (hyperspecific; a), and in hypomethylated DMRs compared with hypermethylated DMRs (hypospecific; b) using the odds ratio. c, Overlapping ratios of histone modifications with DNA hypomethylated regions for Tet2-KO versus WT mES cells. d, The H2AK119ub levels at IAP loci after TET2-CD (catalytic domain; WT or catalytically dead HxD) tethering by dCas13. e, Representative image showing nucleic acids cross-linked to MBD6. f, Spike-in-calibrated ATAC–seq signals or H2AK119ub signals in WT (siNC WT) and Tet2-KO (siNC Tet2 KO) mES cells, as well as in Mbd6-KD Tet2-KO (siMbd6 Tet2 KO) mES cells. g, Changes in H2AK119ub on m5C hypomethylated (hypo.), unchanged (invar.) and hypermethylated (hyper.) repeat RNA after Tet2 KO versus WT. h, H2AK119ub changes in m5C hypermethylated repeat RNA in Tet2-KO versus WT compared with Mbd6-KD Tet2-KO versus Tet2-KO mES cells. i, The correlation between ATAC signal fold changes in Tet2-KO versus WT mES cells, and comparing Mbd6 KD with control Tet2-KO mES cells. PCC, Pearson correlation coefficient. j, The correlation between changes in ATAC and H2AK119ub signals, comparing Mbd6 KD with control Tet2-KO mES cells. k, The H2AK119ub levels and ATAC signal at IAP RNA after dCas13–MBD6-MBD tethering. l, Schematics of the proposed pathway of MBD6 regulating chromatin state through caRNA m5C binding. Data are mean ± s.d. (d and k) and mean ± s.e.m. (f). For g and h, the box plots show the median (centre line), the upper and lower quartiles (box limits) and 1.5× the interquartile range (whiskers). P values were calculated using two-tailed unpaired t-tests with Welch’s correction (d and k), two-tailed Wilcoxon–Mann–Whitney tests (g and h), two-tailed t-distribution with n − 2 d.f. (i and j). n = 3 biological replicates (d–f and k). The depicted genome-wide data represent an integration of three biological replicates. Source DataCC BY · PubMed Central
Fig. 4 Targeting MBD6–m5C pathway rescues haematopoietic defects caused by Tet2 deletion in HSPCs. a, Schematics of the mixed chimera transplantation assay. b, Quantification of CD45.2+ cells in the PB of recipient mice at different timepoints after transplantation. c, Quantification of CD45.2+ cells in the BM (left) or spleen (right) of recipient mice. d,e, Representative image (d) and quantification (e) of spleen size isolated from recipient mice at 24 weeks after transplantation. f,g, Colony formation analysis of the serial replating assay (f) and flow cytometry analyses of suspension cultures (g) of WT and Tet2−/− HSPCs with (shMbd6) or without (shNC) Mbd6 KD. h, The correlation between changes in ATAC–seq signal and H2AK119ub signal in response to Mbd6 KD in Tet2-KO HSPCs. i, Integrative Genome Viewer visualization of the H2AK119ub and ATAC signal around the Socs3 or Nfkbia genes in WT, Tet2 KO and shMbd6 after Tet2 KO in HSPCs. The values in parentheses represent the scale of signal in each track. Data are mean ± s.d. (b, c and e–g). P values were calculated using two-tailed unpaired t-tests with Welch’s correction (b, c and e–g) and two-tailed t-distribution with n − 2 d.f. (h). n = 3 biological replicates (b–g). The depicted genome-wide data represent an integration of three biological replicates. Source Data
Fig. 4 Targeting MBD6–m5C pathway rescues haematopoietic defects caused by Tet2 deletion in HSPCs. a, Schematics of the mixed chimera transplantation assay. b, Quantification of CD45.2+ cells in the PB of recipient mice at different timepoints after transplantation. c, Quantification of CD45.2+ cells in the BM (left) or spleen (right) of recipient mice. d,e, Representative image (d) and quantification (e) of spleen size isolated from recipient mice at 24 weeks after transplantation. f,g, Colony formation analysis of the serial replating assay (f) and flow cytometry analyses of suspension cultures (g) of WT and Tet2−/− HSPCs with (shMbd6) or without (shNC) Mbd6 KD. h, The correlation between changes in ATAC–seq signal and H2AK119ub signal in response to Mbd6 KD in Tet2-KO HSPCs. i, Integrative Genome Viewer visualization of the H2AK119ub and ATAC signal around the Socs3 or Nfkbia genes in WT, Tet2 KO and shMbd6 after Tet2 KO in HSPCs. The values in parentheses represent the scale of signal in each track. Data are mean ± s.d. (b, c and e–g). P values were calculated using two-tailed unpaired t-tests with Welch’s correction (b, c and e–g) and two-tailed t-distribution with n − 2 d.f. (h). n = 3 biological replicates (b–g). The depicted genome-wide data represent an integration of three biological replicates. Source DataCC BY · PubMed Central
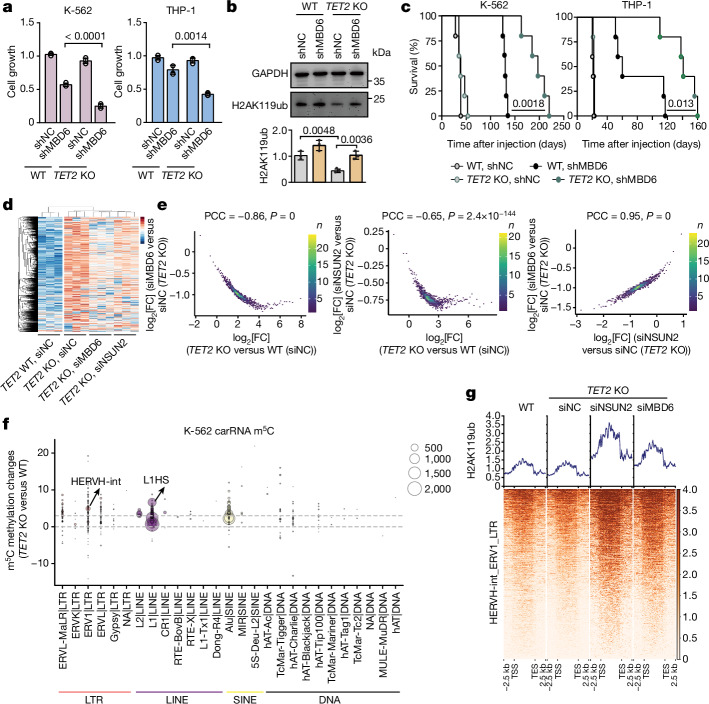
Fig. 5 MBD6 exhibited synergistic effects with TET2 deficiency in regulating leukaemia progression through the m5C–H2AK119ub axis. a, Proliferation of WT or TET2-KO K-562 or THP-1 cells with (shMBD6) or without (shNC) MBD6 KD. n = 4. b, The K-562 H2AK119ub level changes after MBD6 KD. n = 3. c, NSG mice were transplanted with K-562 (left) or THP-1 (right) cells and their overall survival is shown as the Kaplan–Meier estimator. n = 5 mice. d, Heat map illustrating the spike-in-calibrated ATAC–seq signals on ATAC–seq peak regions in WT (siNC WT) and TET2-KO (siNC TET2 KO) K-562 cells, as well as in NSUN2 KD (siNSUN2 TET2 KO) and MBD6-KD (siMBD6 TET2 KO) TET2-KO K-562 cells. n = 3. Data are row-normalized using z scores. e, The correlation of changes in ATAC signals between TET2-KO versus WT K-562 cells, and comparing NSUN2 KD or MBD6 KD with control in TET2-KO K-562 cells. f, m5C methylation level changes of K-562 cells in different repeat RNA families after TET2 KO. The size of the circle represents the number of loci methylated by m5C. g, The H2AK119ub signals around HERVH-int genomic loci. The colour bar shows H2AK119ub signal. Data are mean ± s.d. P values were calculated using two-tailed unpaired t-tests with Welch’s correction (a and b), log-rank Mentel–Cox tests (c) and two-tailed t-distribution with n − 2 d.f. (e). The depicted genome-wide data represent an integration of three biological replicates. Source Data
Fig. 5 MBD6 exhibited synergistic effects with TET2 deficiency in regulating leukaemia progression through the m5C–H2AK119ub axis. a, Proliferation of WT or TET2-KO K-562 or THP-1 cells with (shMBD6) or without (shNC) MBD6 KD. n = 4. b, The K-562 H2AK119ub level changes after MBD6 KD. n = 3. c, NSG mice were transplanted with K-562 (left) or THP-1 (right) cells and their overall survival is shown as the Kaplan–Meier estimator. n = 5 mice. d, Heat map illustrating the spike-in-calibrated ATAC–seq signals on ATAC–seq peak regions in WT (siNC WT) and TET2-KO (siNC TET2 KO) K-562 cells, as well as in NSUN2 KD (siNSUN2 TET2 KO) and MBD6-KD (siMBD6 TET2 KO) TET2-KO K-562 cells. n = 3. Data are row-normalized using z scores. e, The correlation of changes in ATAC signals between TET2-KO versus WT K-562 cells, and comparing NSUN2 KD or MBD6 KD with control in TET2-KO K-562 cells. f, m5C methylation level changes of K-562 cells in different repeat RNA families after TET2 KO. The size of the circle represents the number of loci methylated by m5C. g, The H2AK119ub signals around HERVH-int genomic loci. The colour bar shows H2AK119ub signal. Data are mean ± s.d. P values were calculated using two-tailed unpaired t-tests with Welch’s correction (a and b), log-rank Mentel–Cox tests (c) and two-tailed t-distribution with n − 2 d.f. (e). The depicted genome-wide data represent an integration of three biological replicates. Source DataCC BY · PubMed Central
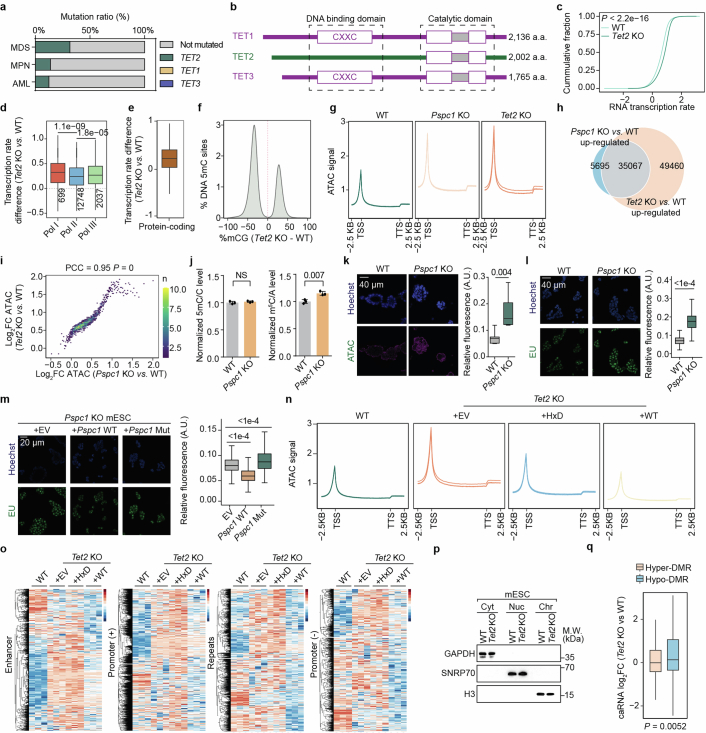
Extended Data Fig. 1 TET2 depletion led to global transcriptional activation in mESCs. a, The mutation profiles of TET family proteins (TET1, TET2, and TET3) in different diseases (from cbioportal.org). MDS, Myelodysplastic Syndromes; MPN, Myeloproliferative Neoplasms; AML, Acute Myeloid Leukaemia. b, Annotated domain structures of canonical human TET1-3 proteins. c, Nascent RNA transcription rate in WT and Tet2-KO mESCs. d, Transcription rates of genes regulated by RNA Polymerase I (Pol I), Polymerase II (Pol II), or Polymerase III (Pol III) in Tet2-KO versus WT mESCs defined using ChIP-seq data (GSE181698). e, Transcription rate changes of protein-coding genes in Tet2-KO versus WT mESCs. f, Distribution of 5mC methylation changes in Tet2-KO compared to WT mESCs at differentially methylated regions (DMRs) defined by Hon et al. (GSE48519). g, Metagene profile of calibrated ATAC-seq signals. h, Overlaps between ATAC-seq peaks with increased intensity for Tet2-KO versus WT, and for Pspc1-KO versus WT mESCs. i, Correlation of calibrated ATAC-seq signals comparing Tet2-KO with WT mESCs (y axis), and comparing Pspc1-KO with WT mESCs (x axis). PCC, Pearson correlation coefficient. j, DNA 5mC levels and caRNA m5C levels of WT and Pspc1 KO mESCs. k-m, Representative images and quantifications measuring chromatin accessibility (k) and transcription rate (l) in WT and Pspc1-KO mESCs, or transcription rate (m) in Pspc1-KO mESCs overexpressing empty vector (EV), WT Pspc1 (+Pspc1 WT), or mutant Pspc1 (+Pspc1 Mut). Scale bar: 40 µm. ATAC: ATAC-see signal; EU: 5-ethynyl uridine; Hoechst: nucleus. n,o, Calibrated ATAC-seq signal in WT, as well as in Tet2-KO mESCs overexpressing either EV, wild-type mouse Tet2 (WT), or catalytic dead mouse Tet2 (HxD). Metagene profile (n) or heatmap showing signals on different carRNA regions (o). p, Representative western blot evaluation of chromatin preparations in mESCs. q, Changes in caRNA abundances at DMRs in Tet2 KO versus WT mESCs. Box-plot elements: centre line, median; box limits, upper and lower quartiles; whiskers, 1–99% (k) or 1.5 × IQR (d,e,l,m,q). Bar represents mean and whiskers s.d. P values, two-tailed Wilcoxon-Mann-Whitney test (c,d,l,m,q), two-tailed unpaired t test with Welch’s correction (j,k), two-tailed t-distribution with n-2 degrees of freedom (i). NS, P > 0.05. n = 3 biological replicates (g,k-q). The depicted genome-wide data represent an integration of three biological replicates. Source Data
Extended Data Fig. 1 TET2 depletion led to global transcriptional activation in mESCs. a, The mutation profiles of TET family proteins (TET1, TET2, and TET3) in different diseases (from cbioportal.org). MDS, Myelodysplastic Syndromes; MPN, Myeloproliferative Neoplasms; AML, Acute Myeloid Leukaemia. b, Annotated domain structures of canonical human TET1-3 proteins. c, Nascent RNA transcription rate in WT and Tet2-KO mESCs. d, Transcription rates of genes regulated by RNA Polymerase I (Pol I), Polymerase II (Pol II), or Polymerase III (Pol III) in Tet2-KO versus WT mESCs defined using ChIP-seq data (GSE181698). e, Transcription rate changes of protein-coding genes in Tet2-KO versus WT mESCs. f, Distribution of 5mC methylation changes in Tet2-KO compared to WT mESCs at differentially methylated regions (DMRs) defined by Hon et al. (GSE48519). g, Metagene profile of calibrated ATAC-seq signals. h, Overlaps between ATAC-seq peaks with increased intensity for Tet2-KO versus WT, and for Pspc1-KO versus WT mESCs. i, Correlation of calibrated ATAC-seq signals comparing Tet2-KO with WT mESCs (y axis), and comparing Pspc1-KO with WT mESCs (x axis). PCC, Pearson correlation coefficient. j, DNA 5mC levels and caRNA m5C levels of WT and Pspc1 KO mESCs. k-m, Representative images and quantifications measuring chromatin accessibility (k) and transcription rate (l) in WT and Pspc1-KO mESCs, or transcription rate (m) in Pspc1-KO mESCs overexpressing empty vector (EV), WT Pspc1 (+Pspc1 WT), or mutant Pspc1 (+Pspc1 Mut). Scale bar: 40 µm. ATAC: ATAC-see signal; EU: 5-ethynyl uridine; Hoechst: nucleus. n,o, Calibrated ATAC-seq signal in WT, as well as in Tet2-KO mESCs overexpressing either EV, wild-type mouse Tet2 (WT), or catalytic dead mouse Tet2 (HxD). Metagene profile (n) or heatmap showing signals on different carRNA regions (o). p, Representative western blot evaluation of chromatin preparations in mESCs. q, Changes in caRNA abundances at DMRs in Tet2 KO versus WT mESCs. Box-plot elements: centre line, median; box limits, upper and lower quartiles; whiskers, 1–99% (k) or 1.5 × IQR (d,e,l,m,q). Bar represents mean and whiskers s.d. P values, two-tailed Wilcoxon-Mann-Whitney test (c,d,l,m,q), two-tailed unpaired t test with Welch’s correction (j,k), two-tailed t-distribution with n-2 degrees of freedom (i). NS, P > 0.05. n = 3 biological replicates (g,k-q). The depicted genome-wide data represent an integration of three biological replicates. Source DataCC BY · PubMed Central
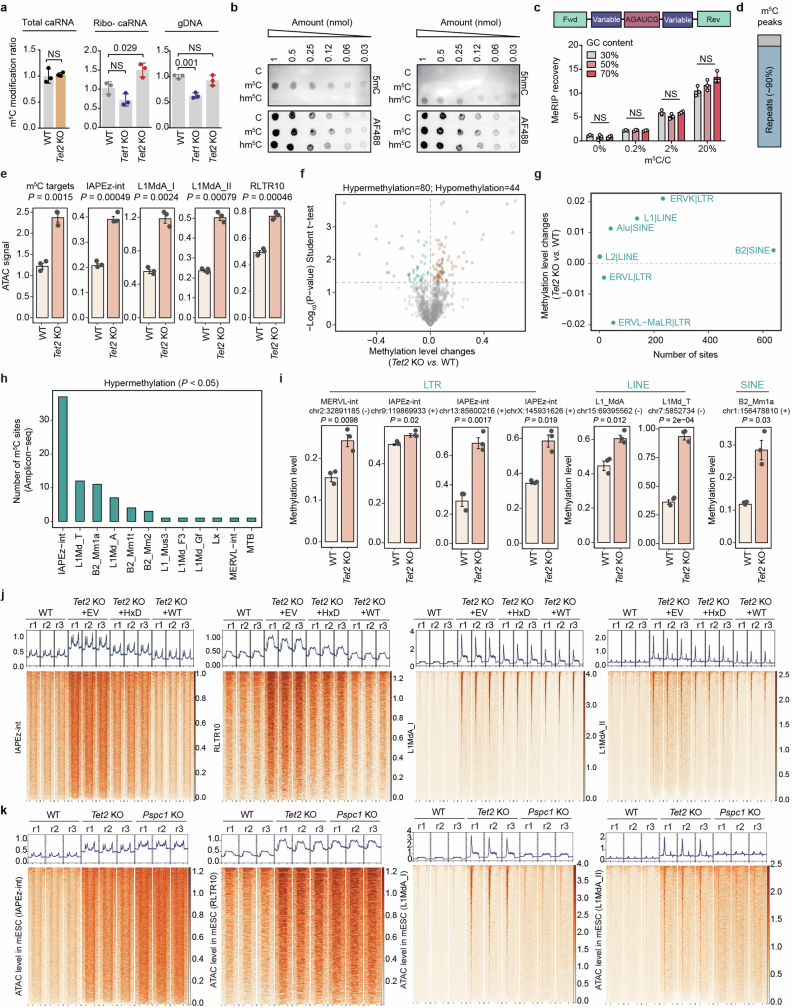
Extended Data Fig. 2 Repeat RNAs are major targets of TET2-mediated caRNA m5C oxidation. a, DNA 5mC and caRNA m5C levels. b, Representative imaging validating the binding specificity of the 5mC/5hmC antibody. AF488: total probe loading. Unmodified probe (C), m5C-modified probe (m5C), hm5C modified probe (hm5C). c, meRIP efficiency of RNA probes with different GC ratio and m5C modification levels. Comparisons are within the same m5C/C ratio group. d, Ratio of caRNA m5C meRIP peaks on repeat or non-repeat RNA. e, Calibrated global ATAC-seq signals across different repeat RNA families and m5C sites. f, Changes in RNA m5C methylation levels upon Tet2 KO and their -log10(p-value). g, Number of methylated sites and the changes in methylation levels for each repeat RNA family following Tet2 KO in mESCs. Each dot represents one repeat RNA family, with the number of methylated sites counted and the changes in methylation levels averaged within each family. h, Number of hypermethylated sites located across different repeat RNA families. i, m5C methylation levels on different repeat RNA loci in WT and Tet2-KO mESCs. j, Heatmap showing calibrated ATAC-seq signals in WT, as well as in Tet2-KO mESCs overexpressing either an empty vector (EV) control, wild-type mouse Tet2 (WT), or catalytically inactive mouse Tet2 (HxD), across different repeat RNA families including IAPEz-int, RLTR10, L1MdA_I, and L1MdA_II. k, Heatmap showing calibrated ATAC-seq signals in WT, Pspc1-KO and Tet2-KO mESCs, across different repeat RNA families including IAPEz-int, RLTR10, L1MdA_I, and L1MdA_II. Bar represents mean and whiskers s.d. (a,c) or s.e.m (e,i). P values, One-Way ANOVA (c), two-tailed unpaired t test with Welch’s correction (a,e,f,h,i). NS, P > 0.05. n = 3 biological replicates (a-c, e-k). The depicted genome-wide data represent an integration of three biological replicates. Source Data
Extended Data Fig. 2 Repeat RNAs are major targets of TET2-mediated caRNA m5C oxidation. a, DNA 5mC and caRNA m5C levels. b, Representative imaging validating the binding specificity of the 5mC/5hmC antibody. AF488: total probe loading. Unmodified probe (C), m5C-modified probe (m5C), hm5C modified probe (hm5C). c, meRIP efficiency of RNA probes with different GC ratio and m5C modification levels. Comparisons are within the same m5C/C ratio group. d, Ratio of caRNA m5C meRIP peaks on repeat or non-repeat RNA. e, Calibrated global ATAC-seq signals across different repeat RNA families and m5C sites. f, Changes in RNA m5C methylation levels upon Tet2 KO and their -log10(p-value). g, Number of methylated sites and the changes in methylation levels for each repeat RNA family following Tet2 KO in mESCs. Each dot represents one repeat RNA family, with the number of methylated sites counted and the changes in methylation levels averaged within each family. h, Number of hypermethylated sites located across different repeat RNA families. i, m5C methylation levels on different repeat RNA loci in WT and Tet2-KO mESCs. j, Heatmap showing calibrated ATAC-seq signals in WT, as well as in Tet2-KO mESCs overexpressing either an empty vector (EV) control, wild-type mouse Tet2 (WT), or catalytically inactive mouse Tet2 (HxD), across different repeat RNA families including IAPEz-int, RLTR10, L1MdA_I, and L1MdA_II. k, Heatmap showing calibrated ATAC-seq signals in WT, Pspc1-KO and Tet2-KO mESCs, across different repeat RNA families including IAPEz-int, RLTR10, L1MdA_I, and L1MdA_II. Bar represents mean and whiskers s.d. (a,c) or s.e.m (e,i). P values, One-Way ANOVA (c), two-tailed unpaired t test with Welch’s correction (a,e,f,h,i). NS, P > 0.05. n = 3 biological replicates (a-c, e-k). The depicted genome-wide data represent an integration of three biological replicates. Source DataCC BY · PubMed Central
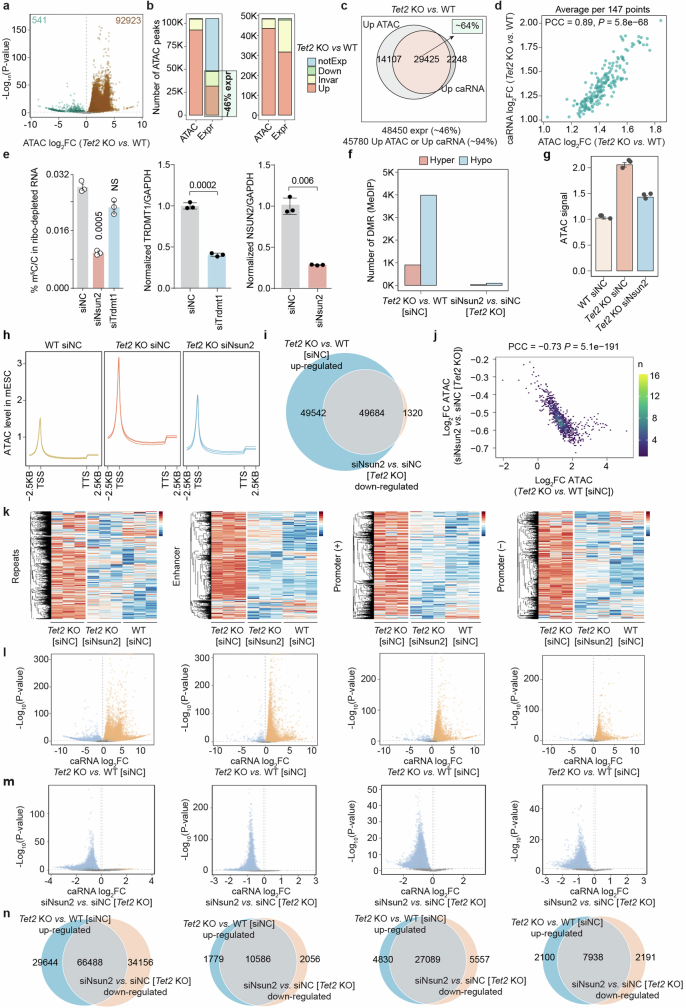
Extended Data Fig. 3 NSUN2 installs caRNA m5C and regulates chromatin openness. a, Changes in ATAC-seq peak intensity of Tet2-KO versus WT mESCs. b, Left panel: Total number of ATAC-seq peaks in mESCs. Right panel: Number of ATAC-seq peaks associated with caRNA expression in mESCs. These peaks were categorized into four groups: differentially upregulated (Up), downregulated (Down), or unchanged (Invar) upon Tet2 KO in mESCs. Additionally, they were classified based on their transcriptional status as either transcribed (Expr) or not transcribed (notExp). c, Overlap of ATAC-seq peaks with increased intensity (up ATAC) or increased caRNA abundance in Tet2-KO mESCs. d, Correlation of changes in chromatin accessibility and caRNA abundance upon Tet2 KO in mESCs. e, m5C levels in caRNAs from WT mESCs transfected with non-targeting siRNA (siNC), or siRNAs targeting Nsun2 or Trdmt1. KD efficacies of Trdmt1 or Nsun2 in mESCs. Comparisons against siNC group. f, Number of DMRs identified in Tet2-KO compared to WT mESCs, and in Nsun2 KD compared to control Tet2-KO mESCs. g, Calibrated ATAC-seq signals in WT, Tet2-KO, and Nsun2-KD Tet2-KO mESCs. h, Metagene Profile of calibrated ATAC-seq signals in WT, Tet2-KO, and Nsun2-KD Tet2-KO mESCs. i, Overlap of ATAC-seq peaks with increased intensity in Tet2-KO versus WT mESCs, and ATAC-seq peaks with decreased intensity in Nsun2-KD compared with control Tet2-KO mESCs. j, Correlation of changes in calibrated ATAC-seq signals comparing Tet2-KO with WT mESCs, and comparing Nsun2-KD with control Tet2-KO mESCs. k, caRNA expression profiles in WT, Tet2-KO mESCs, and in Nsun2-KD Tet2-KO mESCs, across different carRNA species. l-m, Volcano plots of calibrated caRNA expression changes comparing Tet2-KO to WT mESCs (l), and in Nsun2 KD compared to control Tet2-KO mESCs (m). n, Overlap of differentially expressed caRNAs in Tet2-KO compared to WT, and in Nsun2-KD compared to control Tet2-KO mESCs. Bar represents mean and whiskers s.d. (e) or s.e.m (g). P values, Wald-test (a,l,m), two-tailed unpaired t test with Welch’s correction (e), two-tailed t-distribution with n-2 degrees of freedom (d,j). NS, P > 0.05. n = 3 biological replicates (e,g,h,k). The depicted genome-wide data represent an integration of three biological replicates. Source Data
Extended Data Fig. 3 NSUN2 installs caRNA m5C and regulates chromatin openness. a, Changes in ATAC-seq peak intensity of Tet2-KO versus WT mESCs. b, Left panel: Total number of ATAC-seq peaks in mESCs. Right panel: Number of ATAC-seq peaks associated with caRNA expression in mESCs. These peaks were categorized into four groups: differentially upregulated (Up), downregulated (Down), or unchanged (Invar) upon Tet2 KO in mESCs. Additionally, they were classified based on their transcriptional status as either transcribed (Expr) or not transcribed (notExp). c, Overlap of ATAC-seq peaks with increased intensity (up ATAC) or increased caRNA abundance in Tet2-KO mESCs. d, Correlation of changes in chromatin accessibility and caRNA abundance upon Tet2 KO in mESCs. e, m5C levels in caRNAs from WT mESCs transfected with non-targeting siRNA (siNC), or siRNAs targeting Nsun2 or Trdmt1. KD efficacies of Trdmt1 or Nsun2 in mESCs. Comparisons against siNC group. f, Number of DMRs identified in Tet2-KO compared to WT mESCs, and in Nsun2 KD compared to control Tet2-KO mESCs. g, Calibrated ATAC-seq signals in WT, Tet2-KO, and Nsun2-KD Tet2-KO mESCs. h, Metagene Profile of calibrated ATAC-seq signals in WT, Tet2-KO, and Nsun2-KD Tet2-KO mESCs. i, Overlap of ATAC-seq peaks with increased intensity in Tet2-KO versus WT mESCs, and ATAC-seq peaks with decreased intensity in Nsun2-KD compared with control Tet2-KO mESCs. j, Correlation of changes in calibrated ATAC-seq signals comparing Tet2-KO with WT mESCs, and comparing Nsun2-KD with control Tet2-KO mESCs. k, caRNA expression profiles in WT, Tet2-KO mESCs, and in Nsun2-KD Tet2-KO mESCs, across different carRNA species. l-m, Volcano plots of calibrated caRNA expression changes comparing Tet2-KO to WT mESCs (l), and in Nsun2 KD compared to control Tet2-KO mESCs (m). n, Overlap of differentially expressed caRNAs in Tet2-KO compared to WT, and in Nsun2-KD compared to control Tet2-KO mESCs. Bar represents mean and whiskers s.d. (e) or s.e.m (g). P values, Wald-test (a,l,m), two-tailed unpaired t test with Welch’s correction (e), two-tailed t-distribution with n-2 degrees of freedom (d,j). NS, P > 0.05. n = 3 biological replicates (e,g,h,k). The depicted genome-wide data represent an integration of three biological replicates. Source DataCC BY · PubMed Central
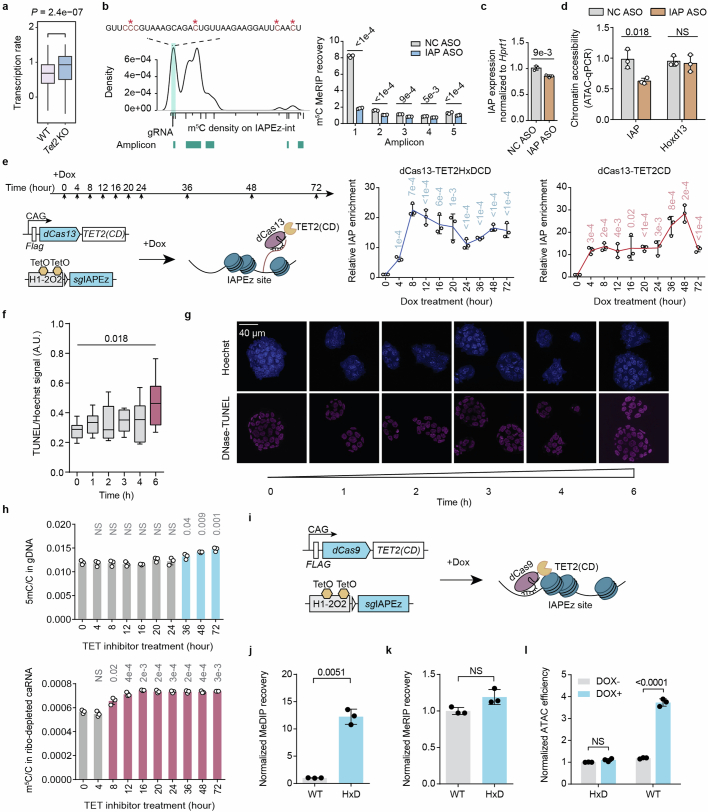
Extended Data Fig. 4 RNA oxidation by TET2 leads to chromatin compaction. a, IAPEz-nearby gene transcription in WT and Tet2-KO mESCs. b, Metagene profiles of IAP RNA m5C landscape in WT mESCs with individual amplicons indicated, and zoom-in showing the 5′ end sequence that contains multiple m5C sites revealed by bisulfite sequencing. meRIP-qPCR with primers targeting different amplicons enabled region-specific analysis of the IAP m5C level upon IAP ASO treatment in mESCs. IAP ASO targets amplicon 1, a non-targeting ASO (NC ASO) was used as control. c, IAP ASO treatment slightly downregulated IAP RNA level in mESCs. d, Chromatin accessibility at IAP loci following ASO treatment. e, Schematics showing the design of CRISPR tethering system of the TET2 catalytic domain to IAP RNA. mESCs stably express dCas13-TET2(CD) or a catalytic dead version (dCas13-TET2(CD)-HxDmut) fusion protein and guide RNA sequence downstream of a TetO-controlled H1 promotor (H1-2O2). Dox-inducible tethering to IAP is validated by RIP-qPCR. Comparisons against “0 h” group. f-g, Quantification (f) and representative immunofluorescence images (g) for DNase-TUNEL assay in mESCs treated by TET inhibitor TETi-C35. Scale bar: 40 μm. Comparison between “6 h” and “0 h” groups. h, Abundance of DNA 5mC in genomic DNA or RNA m5C in caRNA measured in mESCs at indicated time points post TETi-C35 treatment. Comparisons against “0 h” group. i, Schematics showing the design of CRISPR tethering system of the TET2 catalytic domain (TET2(CD)) to IAP genomic loci with a similar design as (e). j-l, DNA 5mC changes (j), RNA m5C changes (k) or chromatin accessibility changes (l) at IAP loci when dCas9-TET2CD fusion protein was targeted to IAP loci with guide RNA. HxD represents the catalytic dead mutant, WT represents wild-type TET2 catalytic domain. Box-plot elements: centre line, median; box limits, upper and lower quartiles; whiskers, 1–99% (a,f). Bar (b-d,h,j-l) or line centre (e) represents mean and whiskers s.d. P values, two-tailed Wilcoxon-Mann-Whitney test (a,f), two-tailed unpaired t test with Welch’s correction (b-e,h,j-l). NS, P > 0.05. n = 3 biological replicates (b-l). The depicted genome-wide data represent an integration of three biological replicates. Source Data
Extended Data Fig. 4 RNA oxidation by TET2 leads to chromatin compaction. a, IAPEz-nearby gene transcription in WT and Tet2-KO mESCs. b, Metagene profiles of IAP RNA m5C landscape in WT mESCs with individual amplicons indicated, and zoom-in showing the 5′ end sequence that contains multiple m5C sites revealed by bisulfite sequencing. meRIP-qPCR with primers targeting different amplicons enabled region-specific analysis of the IAP m5C level upon IAP ASO treatment in mESCs. IAP ASO targets amplicon 1, a non-targeting ASO (NC ASO) was used as control. c, IAP ASO treatment slightly downregulated IAP RNA level in mESCs. d, Chromatin accessibility at IAP loci following ASO treatment. e, Schematics showing the design of CRISPR tethering system of the TET2 catalytic domain to IAP RNA. mESCs stably express dCas13-TET2(CD) or a catalytic dead version (dCas13-TET2(CD)-HxDmut) fusion protein and guide RNA sequence downstream of a TetO-controlled H1 promotor (H1-2O2). Dox-inducible tethering to IAP is validated by RIP-qPCR. Comparisons against “0 h” group. f-g, Quantification (f) and representative immunofluorescence images (g) for DNase-TUNEL assay in mESCs treated by TET inhibitor TETi-C35. Scale bar: 40 μm. Comparison between “6 h” and “0 h” groups. h, Abundance of DNA 5mC in genomic DNA or RNA m5C in caRNA measured in mESCs at indicated time points post TETi-C35 treatment. Comparisons against “0 h” group. i, Schematics showing the design of CRISPR tethering system of the TET2 catalytic domain (TET2(CD)) to IAP genomic loci with a similar design as (e). j-l, DNA 5mC changes (j), RNA m5C changes (k) or chromatin accessibility changes (l) at IAP loci when dCas9-TET2CD fusion protein was targeted to IAP loci with guide RNA. HxD represents the catalytic dead mutant, WT represents wild-type TET2 catalytic domain. Box-plot elements: centre line, median; box limits, upper and lower quartiles; whiskers, 1–99% (a,f). Bar (b-d,h,j-l) or line centre (e) represents mean and whiskers s.d. P values, two-tailed Wilcoxon-Mann-Whitney test (a,f), two-tailed unpaired t test with Welch’s correction (b-e,h,j-l). NS, P > 0.05. n = 3 biological replicates (b-l). The depicted genome-wide data represent an integration of three biological replicates. Source DataCC BY · PubMed Central
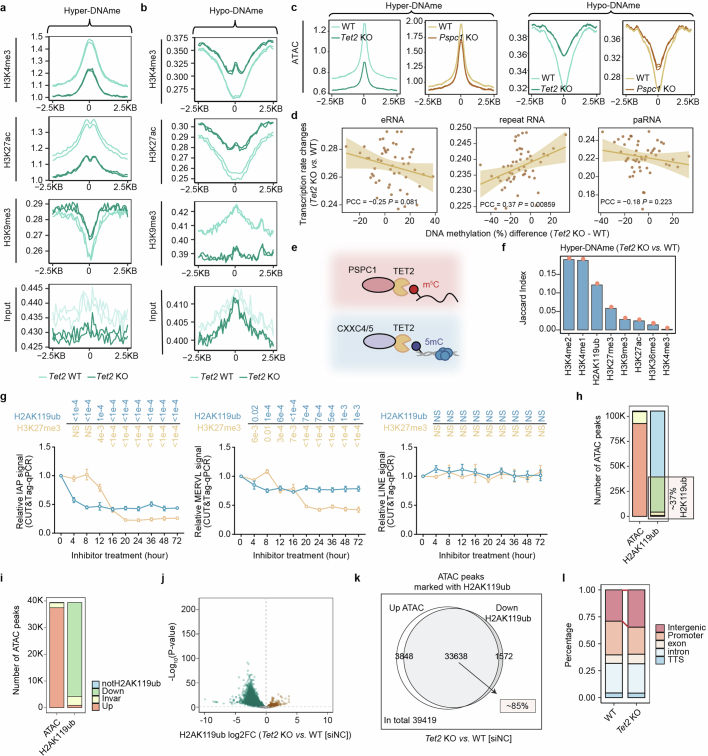
Extended Data Fig. 5 H2AK119ub modification is critical to TET2-mediated chromatin regulation. a,b, Average histone modification levels, as well as input signals, in WT and Tet2-KO mESCs at DNA hypermethylated regions (a) or hypomethylated regions (b), detected in Tet2-KO mESCs. c, Average ATAC signals in WT, Tet2-KO, and Pspc1-KO mESCs at DNA 5mC hypermethylated regions or hypomethylated regions detected in Tet2-KO mESCs. d, Correlation between DNA methylation differences in Tet2-KO versus WT mESCs and changes in their downstream gene transcription. carRNAs were categorized into different groups, including eRNA, paRNA, and repeat RNA. Within each group of carRNAs, they were further divided into 50 bins based on the ranked DNA methylation differences upon Tet2 KO in mESCs. Error band represents standard errors. e, Schematics showing the dual mode of chromatin regulation by TET2 when bound to different protein partners. f, Overlapping ratios of regions marked by different histone modifications with DNA hypermethylated regions (detected in the Tet2-KO mESCs). g, H2AK119ub and H3K27me3 chromatin bindings at IAP, MERVL, and LINE loci measured through CUT&Tag protocol. Comparisons against “0 h” group. h-i, Total number of ATAC-seq peaks in mESCs. h, Number of ATAC-seq peaks marked with H2AK119ub modification in mESCs; i, ATAC-seq peaks were categorized into four groups: differentially upregulated (Up), downregulated (Down), or unchanged (Invar) after Tet2 KO in mESCs. Additionally, they were classified based on their association with H2AK119ub as either marked (H2AK119ub) or not marked (notH2AK119ub). j, Volcano plot displaying changes in H2AK119ub peak intensity for Tet2-KO versus WT mESCs. k, Overlap of ATAC-seq peaks with increased chromatin accessibility (up ATAC) or decreased H2AK119ub (Down H2AK119ub) in Tet2-KO mESCs. l, Genomic distribution of H2AK119ub peaks in WT and Tet2-KO mESCs. Line centre (g) represents mean and whiskers s.d. P values, Wald test (j), two-tailed unpaired t test with Welch’s correction (g), two-tailed t-distribution with n-2 degrees of freedom (d). NS, P > 0.05. n = 3 biological replicates (g). The depicted genome-wide data represent an integration of three biological replicates (c,d,f,h-l) or two biological replicates (a,b). Source Data
Extended Data Fig. 5 H2AK119ub modification is critical to TET2-mediated chromatin regulation. a,b, Average histone modification levels, as well as input signals, in WT and Tet2-KO mESCs at DNA hypermethylated regions (a) or hypomethylated regions (b), detected in Tet2-KO mESCs. c, Average ATAC signals in WT, Tet2-KO, and Pspc1-KO mESCs at DNA 5mC hypermethylated regions or hypomethylated regions detected in Tet2-KO mESCs. d, Correlation between DNA methylation differences in Tet2-KO versus WT mESCs and changes in their downstream gene transcription. carRNAs were categorized into different groups, including eRNA, paRNA, and repeat RNA. Within each group of carRNAs, they were further divided into 50 bins based on the ranked DNA methylation differences upon Tet2 KO in mESCs. Error band represents standard errors. e, Schematics showing the dual mode of chromatin regulation by TET2 when bound to different protein partners. f, Overlapping ratios of regions marked by different histone modifications with DNA hypermethylated regions (detected in the Tet2-KO mESCs). g, H2AK119ub and H3K27me3 chromatin bindings at IAP, MERVL, and LINE loci measured through CUT&Tag protocol. Comparisons against “0 h” group. h-i, Total number of ATAC-seq peaks in mESCs. h, Number of ATAC-seq peaks marked with H2AK119ub modification in mESCs; i, ATAC-seq peaks were categorized into four groups: differentially upregulated (Up), downregulated (Down), or unchanged (Invar) after Tet2 KO in mESCs. Additionally, they were classified based on their association with H2AK119ub as either marked (H2AK119ub) or not marked (notH2AK119ub). j, Volcano plot displaying changes in H2AK119ub peak intensity for Tet2-KO versus WT mESCs. k, Overlap of ATAC-seq peaks with increased chromatin accessibility (up ATAC) or decreased H2AK119ub (Down H2AK119ub) in Tet2-KO mESCs. l, Genomic distribution of H2AK119ub peaks in WT and Tet2-KO mESCs. Line centre (g) represents mean and whiskers s.d. P values, Wald test (j), two-tailed unpaired t test with Welch’s correction (g), two-tailed t-distribution with n-2 degrees of freedom (d). NS, P > 0.05. n = 3 biological replicates (g). The depicted genome-wide data represent an integration of three biological replicates (c,d,f,h-l) or two biological replicates (a,b). Source DataCC BY · PubMed Central
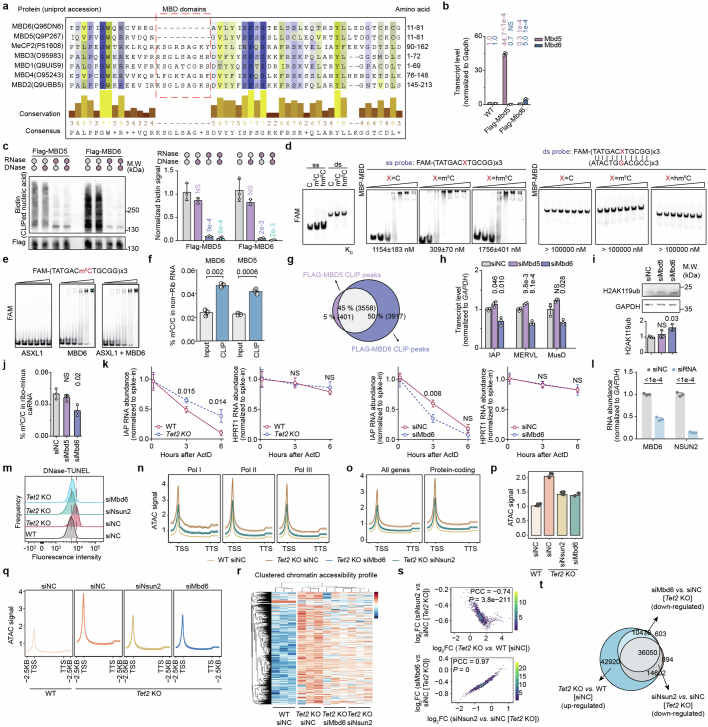
Extended Data Fig. 6 MBD6 preferentially binds to m5C-modified RNA and regulates chromatin H2AK119ub levels. a, Sequence alignment of human MBD family proteins (MBD1-6 and MeCP2) showing differences in the MBD region. b, Validation of Flag-MBD5 or Flag-MBD6 overexpressing mESCs using RT-qPCR. Averaged transcript expressions were indicated. Comparisons against “WT” group. c, Representative gel image quantifying nucleic acids crosslinked to MBD5 or MBD6. Comparisons against “RNase-, DNase-” group. d, EMSA showing the binding preferences of the purified MBD domain of MBD6 fused to maltose binding protein (MBP) with C, m5C, or hm5C-containing oligonucleotide probes. The purity of the single-stranded probe (ss probe) and double-stranded probe (ds probe) was validated by electrophoresis. Gradient for MBP-MBD protein was 0, 0.1, 0.5, 2.5, 12, 50, and 100 μM. e, EMSA showing that ASXL1 binding to MBD6 does not affect MBD6-m5C binding. MBD6 MBD domain (amino acid 1–100 fused by MBP-His) and ASXL1 ASXH domain (amino acid 1509–1541 fused by His-SUMO) were used. f, m5C abundance in MBD5 and MBD6 enriched RNA. g, Overlap between the RNA binding sites of MBD5 and MBD6. h-j, Repeat RNA expression (h), H2AK119ub (i) or caRNA m5C (j) level upon Mbd5 or Mbd6 KD. Comparisons against “siNC” group. k, IAP RNA lifetime upon Tet2 KO or Mbd6 KD in mESCs. l, qPCR results assessing Mbd6 or Nsun2 RNA abundance in mESCs. Comparisons against “siNC” groups. m, Chromatin openness measured by DNase-TUNEL assay upon Nsun2 or Mbd6 KD. n-r, Spike-in calibrated ATAC-seq signals in WT (WT [siNC]) and Tet2 KO (Tet2 KO [siNC]) mESCs, as well as Mbd6 KD (Tet2 KO siMbd6) and Nsun2 KD (Tet2 KO siNsun2) in Tet2-KO mESC cells. Metagene profile at genes regulated by different RNA polymerases (n), protein-coding genes (o), overall signal (p,q), or clustered ATAC peaks (r) were shown. s, Correlation fold changes in spike-in calibrated ATAC-seq signals in Tet2 KO versus WT mESCs, and comparing Nsun2 KD or Mbd6 KD with control Tet2 KO mESCs. t, Venn diagram displaying the significantly up-regulated ATAC-seq peaks in Tet2 KO compared with WT mESC cells, and down-regulated ATAC-seq peaks in Nsun2 KD or Mbd6 KD compared with control mESC cells following Tet2 KO. Bar (b,c,f,h-j,l,p) or line centre (k) represents mean and whiskers s.d. P values, two-tailed unpaired t test with Welch’s correction (b,c,f,h-l), two-tailed t-distribution with n-2 degrees of freedom (s). NS, P > 0.05. n = 3 biological replicates (b-f,h-r). The depicted genome-wide data represent an integration of three biological replicates. Source Data
Extended Data Fig. 6 MBD6 preferentially binds to m5C-modified RNA and regulates chromatin H2AK119ub levels. a, Sequence alignment of human MBD family proteins (MBD1-6 and MeCP2) showing differences in the MBD region. b, Validation of Flag-MBD5 or Flag-MBD6 overexpressing mESCs using RT-qPCR. Averaged transcript expressions were indicated. Comparisons against “WT” group. c, Representative gel image quantifying nucleic acids crosslinked to MBD5 or MBD6. Comparisons against “RNase-, DNase-” group. d, EMSA showing the binding preferences of the purified MBD domain of MBD6 fused to maltose binding protein (MBP) with C, m5C, or hm5C-containing oligonucleotide probes. The purity of the single-stranded probe (ss probe) and double-stranded probe (ds probe) was validated by electrophoresis. Gradient for MBP-MBD protein was 0, 0.1, 0.5, 2.5, 12, 50, and 100 μM. e, EMSA showing that ASXL1 binding to MBD6 does not affect MBD6-m5C binding. MBD6 MBD domain (amino acid 1–100 fused by MBP-His) and ASXL1 ASXH domain (amino acid 1509–1541 fused by His-SUMO) were used. f, m5C abundance in MBD5 and MBD6 enriched RNA. g, Overlap between the RNA binding sites of MBD5 and MBD6. h-j, Repeat RNA expression (h), H2AK119ub (i) or caRNA m5C (j) level upon Mbd5 or Mbd6 KD. Comparisons against “siNC” group. k, IAP RNA lifetime upon Tet2 KO or Mbd6 KD in mESCs. l, qPCR results assessing Mbd6 or Nsun2 RNA abundance in mESCs. Comparisons against “siNC” groups. m, Chromatin openness measured by DNase-TUNEL assay upon Nsun2 or Mbd6 KD. n-r, Spike-in calibrated ATAC-seq signals in WT (WT [siNC]) and Tet2 KO (Tet2 KO [siNC]) mESCs, as well as Mbd6 KD (Tet2 KO siMbd6) and Nsun2 KD (Tet2 KO siNsun2) in Tet2-KO mESC cells. Metagene profile at genes regulated by different RNA polymerases (n), protein-coding genes (o), overall signal (p,q), or clustered ATAC peaks (r) were shown. s, Correlation fold changes in spike-in calibrated ATAC-seq signals in Tet2 KO versus WT mESCs, and comparing Nsun2 KD or Mbd6 KD with control Tet2 KO mESCs. t, Venn diagram displaying the significantly up-regulated ATAC-seq peaks in Tet2 KO compared with WT mESC cells, and down-regulated ATAC-seq peaks in Nsun2 KD or Mbd6 KD compared with control mESC cells following Tet2 KO. Bar (b,c,f,h-j,l,p) or line centre (k) represents mean and whiskers s.d. P values, two-tailed unpaired t test with Welch’s correction (b,c,f,h-l), two-tailed t-distribution with n-2 degrees of freedom (s). NS, P > 0.05. n = 3 biological replicates (b-f,h-r). The depicted genome-wide data represent an integration of three biological replicates. Source DataCC BY · PubMed Central
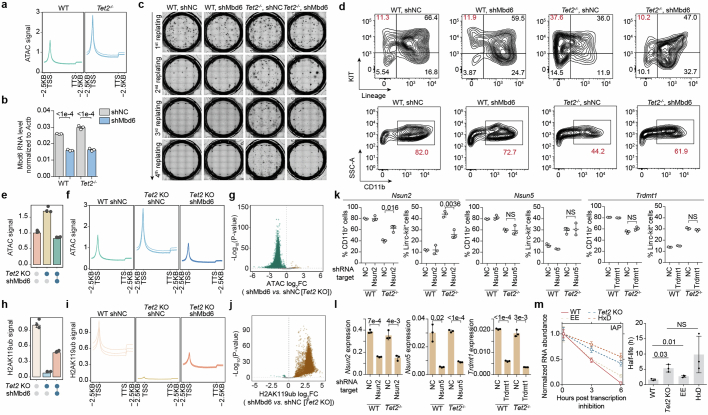
Extended Data Fig. 7 Mbd6 KD restored the TET2-loss-mediated abnormal HSPC proliferation and differentiation through carRNA m5C. a, Metagene profile of the spike-in calibrated ATAC-seq signals of WT and Tet2−/− HSPCs. b, qPCR results validating efficiency of shRNA-enabled Mbd6 KD in HSPCs. c, Colony formation of serial replating assays of HSPCs upon Mbd6 KD. d, Representative flow cytometry results characterizing HSPC frequency in suspension cultures (top, KIT and Lineage as markers, day 7) and differentiation (bottom, CD11b as marker, day14) upon Mbd6 KD. e,f, Spike-in calibrated ATAC-seq signals in WT (shNC WT) and Tet2-KO (shNC Tet2 KO) HSPCs, as well as in Mbd6-KD (shMbd6 Tet2 KO) Tet2-KO HSPCs. Overall levels (e) and metagene profiles (f) were shown. g, Volcano plot comparing spike-in calibrated ATAC-seq peak signals in Mbd6-KD versus control Tet2-KO HSPCs. h,i Spike-in calibrated H2AK119ub levels in WT (shNC WT) and Tet2-KO (shNC Tet2 KO) HSPCs, as well as in Mbd6-KD (shMbd6 Tet2 KO) Tet2-KO HSPCs. Overall levels (h) and metagene profiles (i) were shown. j, Volcano plot comparing spike-in calibrated H2AK119ub peak signals in Mbd6 KD compared with control Tet2-KO HSPCs. k, Quantifications of in vitro differentiation and maintenance of HSPCs with Nsun2, Nsun5 or Trdmt1 KD. l, qPCR results assessing efficacies of shRNA-enabled Nsun2, Nsun5 or Trdmt1 KD in HSPCs. m, Half life measurements of IAP RNA in HSPCs of different genotypes. WT denotes wild-type, Tet2 KO denotes Tet2 KO, EE mutant lost hm5C oxidation activities and HxD mutant is catalytically inactive. Bar (b,e,h,l,m) or line centre (k,m) represents mean and whiskers s.d. (b,k-m) or s.e.m. (e,h). P values, Wald test (g,j), two-tailed unpaired t test with Welch’s correction (b,e,h,k-m). NS, P > 0.05. n = 3 biological replicates (a-c,e-m). The depicted genome-wide data represent an integration of three biological replicates. Source Data
Extended Data Fig. 7 Mbd6 KD restored the TET2-loss-mediated abnormal HSPC proliferation and differentiation through carRNA m5C. a, Metagene profile of the spike-in calibrated ATAC-seq signals of WT and Tet2−/− HSPCs. b, qPCR results validating efficiency of shRNA-enabled Mbd6 KD in HSPCs. c, Colony formation of serial replating assays of HSPCs upon Mbd6 KD. d, Representative flow cytometry results characterizing HSPC frequency in suspension cultures (top, KIT and Lineage as markers, day 7) and differentiation (bottom, CD11b as marker, day14) upon Mbd6 KD. e,f, Spike-in calibrated ATAC-seq signals in WT (shNC WT) and Tet2-KO (shNC Tet2 KO) HSPCs, as well as in Mbd6-KD (shMbd6 Tet2 KO) Tet2-KO HSPCs. Overall levels (e) and metagene profiles (f) were shown. g, Volcano plot comparing spike-in calibrated ATAC-seq peak signals in Mbd6-KD versus control Tet2-KO HSPCs. h,i Spike-in calibrated H2AK119ub levels in WT (shNC WT) and Tet2-KO (shNC Tet2 KO) HSPCs, as well as in Mbd6-KD (shMbd6 Tet2 KO) Tet2-KO HSPCs. Overall levels (h) and metagene profiles (i) were shown. j, Volcano plot comparing spike-in calibrated H2AK119ub peak signals in Mbd6 KD compared with control Tet2-KO HSPCs. k, Quantifications of in vitro differentiation and maintenance of HSPCs with Nsun2, Nsun5 or Trdmt1 KD. l, qPCR results assessing efficacies of shRNA-enabled Nsun2, Nsun5 or Trdmt1 KD in HSPCs. m, Half life measurements of IAP RNA in HSPCs of different genotypes. WT denotes wild-type, Tet2 KO denotes Tet2 KO, EE mutant lost hm5C oxidation activities and HxD mutant is catalytically inactive. Bar (b,e,h,l,m) or line centre (k,m) represents mean and whiskers s.d. (b,k-m) or s.e.m. (e,h). P values, Wald test (g,j), two-tailed unpaired t test with Welch’s correction (b,e,h,k-m). NS, P > 0.05. n = 3 biological replicates (a-c,e-m). The depicted genome-wide data represent an integration of three biological replicates. Source DataCC BY · PubMed Central
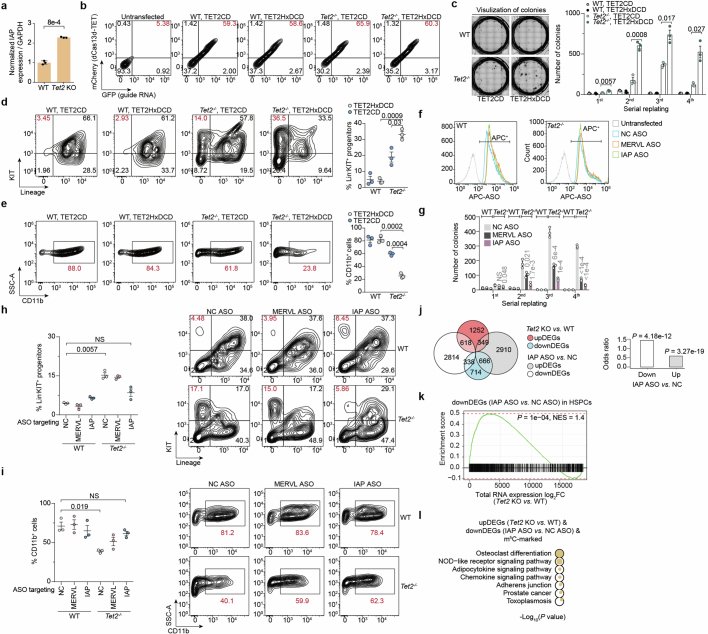
Extended Data Fig. 8 IAP is a key downstream carRNA target to rescue aberrant HSPC proliferation and differentiation caused by Tet2 deficiency. a, RT-qPCR quantification for IAP levels in caRNAs isolated from WT or Tet2-KO (Tet2−/−) HSPCs. b, Representative flow cytometry analyses of dCas13d-TET2CD fusion protein and guide RNA transfection efficiency in HSPCs. c, Replating assay of HSPCs transfected with guide RNA targeting the IAP RNA using either the RfxdCas13d fusion protein with TET2 catalytic domain (TET2CD) or the inactivated mutant (TET2HxDCD). d, Flow cytometry analyses of HSPC frequency in suspension cultures (day 7) of WT and Tet2−/− HSPCs transfected with guide RNA targeting the IAP RNA using the RfxdCas13d fusion protein with TET2CD or TET2HxDCD. e, Flow cytometry analyses of differentiation (CD11b, day 14) of WT and Tet2−/− HSPCs transfected with guide RNA targeting the IAP RNA using the RfxdCas13d fusion protein with TET2CD or TET2HxDCD. f, Representative flow cytometry analyses of ASO transfection efficiency in HSPCs. g, Replating assay of WT and Tet2−/− HSPCs transfected with control (NC ASO), MERVL-targeting (MERVL ASO) or IAP-targeting (IAP ASO) steric antisense oligos. Comparisons against “NC ASO” group. h, Flow cytometry analyses in suspension cultures (day 7) of the HSPCs frequency of WT and Tet2−/− HSPCs transfected with NC ASO, MERVL ASO or IAP ASO. i, Flow cytometry analyses of differentiation (CD11b, day 14) of WT and Tet2−/− HSPCs transfected with NC ASO, MERVL ASO or IAP ASO. j, Overlaps among differentially expressed genes upon Tet2 KO or the treatment with IAP ASO in HSPCs (total RNA-seq). Barplot depicting the odds ratio of upDEGs following Tet2 KO, in comparison to both upDEGs and downDEGs after treatment with IAP ASO in HSPCs. k, GSEA enrichment analysis conducted using genes downregulated (downDEGs) upon the treatment of ASO in HSPCs as the gene list and expression log2FC upon Tet2 KO in HSPC cells as the rank list. l, Functional enrichment analysis on genes that are upregulated following Tet2 KO and downregulated upon treatment with an ASO targeting IAP. These genes were located near m5C peaks. Bar (a,c,g) or line centre (d,e,h,i) represents mean and whiskers s.d. P values, two-tailed Fisher’s Exact Test (j), two-tailed unpaired t test with Welch’s correction (a,c-e,g-i), two-tailed permutation (k), one-tailed Fisher’s Exact Test (l). NS, P > 0.05. n = 3 biological replicates (a,c-e,g-i). The depicted genome-wide data represent an integration of three biological replicates. Source Data
Extended Data Fig. 8 IAP is a key downstream carRNA target to rescue aberrant HSPC proliferation and differentiation caused by Tet2 deficiency. a, RT-qPCR quantification for IAP levels in caRNAs isolated from WT or Tet2-KO (Tet2−/−) HSPCs. b, Representative flow cytometry analyses of dCas13d-TET2CD fusion protein and guide RNA transfection efficiency in HSPCs. c, Replating assay of HSPCs transfected with guide RNA targeting the IAP RNA using either the RfxdCas13d fusion protein with TET2 catalytic domain (TET2CD) or the inactivated mutant (TET2HxDCD). d, Flow cytometry analyses of HSPC frequency in suspension cultures (day 7) of WT and Tet2−/− HSPCs transfected with guide RNA targeting the IAP RNA using the RfxdCas13d fusion protein with TET2CD or TET2HxDCD. e, Flow cytometry analyses of differentiation (CD11b, day 14) of WT and Tet2−/− HSPCs transfected with guide RNA targeting the IAP RNA using the RfxdCas13d fusion protein with TET2CD or TET2HxDCD. f, Representative flow cytometry analyses of ASO transfection efficiency in HSPCs. g, Replating assay of WT and Tet2−/− HSPCs transfected with control (NC ASO), MERVL-targeting (MERVL ASO) or IAP-targeting (IAP ASO) steric antisense oligos. Comparisons against “NC ASO” group. h, Flow cytometry analyses in suspension cultures (day 7) of the HSPCs frequency of WT and Tet2−/− HSPCs transfected with NC ASO, MERVL ASO or IAP ASO. i, Flow cytometry analyses of differentiation (CD11b, day 14) of WT and Tet2−/− HSPCs transfected with NC ASO, MERVL ASO or IAP ASO. j, Overlaps among differentially expressed genes upon Tet2 KO or the treatment with IAP ASO in HSPCs (total RNA-seq). Barplot depicting the odds ratio of upDEGs following Tet2 KO, in comparison to both upDEGs and downDEGs after treatment with IAP ASO in HSPCs. k, GSEA enrichment analysis conducted using genes downregulated (downDEGs) upon the treatment of ASO in HSPCs as the gene list and expression log2FC upon Tet2 KO in HSPC cells as the rank list. l, Functional enrichment analysis on genes that are upregulated following Tet2 KO and downregulated upon treatment with an ASO targeting IAP. These genes were located near m5C peaks. Bar (a,c,g) or line centre (d,e,h,i) represents mean and whiskers s.d. P values, two-tailed Fisher’s Exact Test (j), two-tailed unpaired t test with Welch’s correction (a,c-e,g-i), two-tailed permutation (k), one-tailed Fisher’s Exact Test (l). NS, P > 0.05. n = 3 biological replicates (a,c-e,g-i). The depicted genome-wide data represent an integration of three biological replicates. Source DataCC BY · PubMed Central
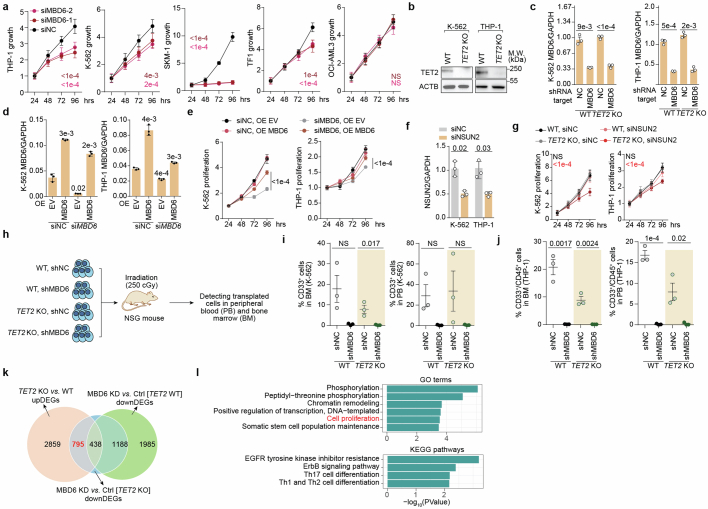
Extended Data Fig. 9 MBD6 is a targetable dependency in TET2-mutant leukaemia cells. a, Proliferation of human leukaemic cell lines upon MBD6 KD using two individual siRNAs. Comparisons against “siNC” group at 96 h. b, Western blot analysis of TET2 levels in WT and TET2-KO K-562 and THP-1 cells. c, qPCR results validating efficiency of shRNA-enabled MBD6 KD in K-562 or THP-1 cells. d, Validation of MBD6 KD and rescue via qPCR analysis. e, Proliferation curves showing that overexpressing MBD6 could rescue growth arrest caused by MBD6 KD. Comparisons against “siMBD6 OE EV” group at 96 h. f, RT-qPCR validation of NSUN2 KD in K-562 and THP-1 cells. g, Proliferation curves of K-562 and THP-1 cells upon NSUN2 KD. Comparisons against “siNC” groups of WT or TET2-KO, individually. h, NSG mice were intravenously injected with K-562 or THP-1 cells as indicated and their overall survival is depicted in the Kaplan-Meier estimator (n = 5 mice). i, Fractions of CD33+ cells in BM or PB isolated from NSG mice xenotransplanted with tumour cells (K-562) for 28–39 days. j, Fractions of CD33+/CD45+ cells in BM or PB isolated from NSG mice xenotransplanted with tumour cells (THP-1) for 20–23 days. k, Venn diagram showing genes upregulated following TET2 KO, genes downregulated upon MBD6 KD in WT K-562, and genes downregulated upon MBD6 KD in TET2-KO K-562 cells. l, Functional enrichment analysis of genes that respond to both TET2 KO, and subsequent MBD6 KD in K-562 cells, but not to MBD6 KD alone in WT K-562 cells. Bar (c,d,f) or line centre (a,e,g,i,j) represents mean and whiskers s.d. P values, two-tailed unpaired t test with Welch’s correction (a,c-g,i,j), one-tailed Fisher’s Exact Test (l). NS, P > 0.05. Biological replicates, n = 6 (a), n = 4 (g), n = 3 (b-d,f,i,j). The depicted genome-wide data represent an integration of three biological replicates. Source Data
Extended Data Fig. 9 MBD6 is a targetable dependency in TET2-mutant leukaemia cells. a, Proliferation of human leukaemic cell lines upon MBD6 KD using two individual siRNAs. Comparisons against “siNC” group at 96 h. b, Western blot analysis of TET2 levels in WT and TET2-KO K-562 and THP-1 cells. c, qPCR results validating efficiency of shRNA-enabled MBD6 KD in K-562 or THP-1 cells. d, Validation of MBD6 KD and rescue via qPCR analysis. e, Proliferation curves showing that overexpressing MBD6 could rescue growth arrest caused by MBD6 KD. Comparisons against “siMBD6 OE EV” group at 96 h. f, RT-qPCR validation of NSUN2 KD in K-562 and THP-1 cells. g, Proliferation curves of K-562 and THP-1 cells upon NSUN2 KD. Comparisons against “siNC” groups of WT or TET2-KO, individually. h, NSG mice were intravenously injected with K-562 or THP-1 cells as indicated and their overall survival is depicted in the Kaplan-Meier estimator (n = 5 mice). i, Fractions of CD33+ cells in BM or PB isolated from NSG mice xenotransplanted with tumour cells (K-562) for 28–39 days. j, Fractions of CD33+/CD45+ cells in BM or PB isolated from NSG mice xenotransplanted with tumour cells (THP-1) for 20–23 days. k, Venn diagram showing genes upregulated following TET2 KO, genes downregulated upon MBD6 KD in WT K-562, and genes downregulated upon MBD6 KD in TET2-KO K-562 cells. l, Functional enrichment analysis of genes that respond to both TET2 KO, and subsequent MBD6 KD in K-562 cells, but not to MBD6 KD alone in WT K-562 cells. Bar (c,d,f) or line centre (a,e,g,i,j) represents mean and whiskers s.d. P values, two-tailed unpaired t test with Welch’s correction (a,c-g,i,j), one-tailed Fisher’s Exact Test (l). NS, P > 0.05. Biological replicates, n = 6 (a), n = 4 (g), n = 3 (b-d,f,i,j). The depicted genome-wide data represent an integration of three biological replicates. Source DataCC BY · PubMed Central
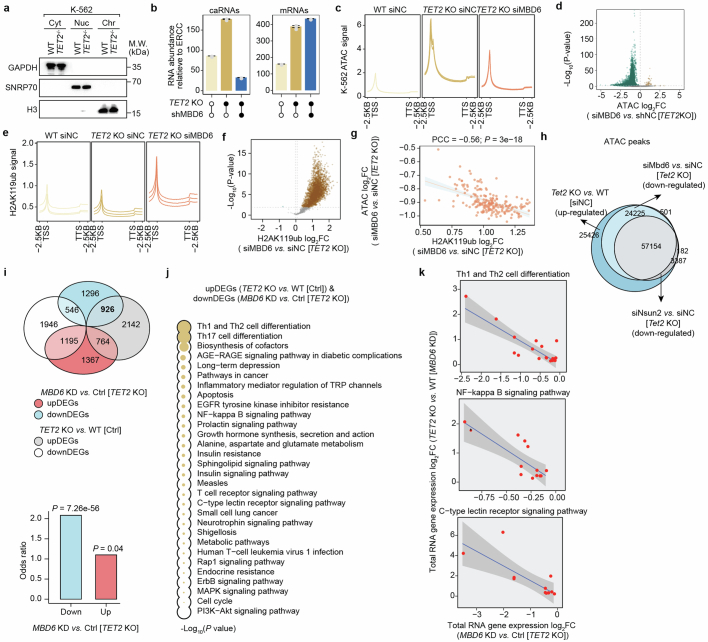
Extended Data Fig. 10 MBD6 governs a transcription program in leukaemic cell through regulating H2AK119ub. a, Representative subcellular fractionation of K-562 cells. Cyt: cytosolic; Nuc: nuclear soluble; Chr: chromatin. b, Overall caRNA and whole-cell RNA abundance relative to spike-in in WT, TET2-KO and TET2-KO + MBD6-KD K-562 cells. c, Metagene profile of the calibrated ATAC-seq signals of WT (siNC WT) and Tet2 KO (siNC Tet2 KO) K-562 cells, as well as in Mbd6 KD (siMbd6 Tet2 KO) Tet2 KO K-562 cells. d, Volcano plot comparing spike-in calibrated ATAC-seq peaks in Mbd6-KD versus control in Tet2-KO K-562 cells. e, Metagene profile of the spike-in calibrated H2AK119ub signals of WT (siNC WT) and Tet2-KO (siNC Tet2 KO) K-562 cells, as well as in Mbd6-KD (siMbd6 Tet2-KO) Tet2-KO K-562 cells. f, Volcano plot comparing spike-in calibrated H2AK119ub peaks in Mbd6-KD compared with control Tet2-KO K-562 cells. g, Correlation between changes in ATAC and H2AK119ub signals, comparing Mbd6-KD with control in Tet2-KO K-562 cells. h, Venn diagram displaying the significantly up-regulated ATAC-seq peaks in Tet2-KO compared with WT K-562 cells, and down-regulated ATAC-seq peaks in Nsun2-KD or Mbd6-KD compared with control Tet2-KO K-562 cells. i, Overlap of differentially expressed genes upon TET2 KO in control K-562 cells, and upon MBD6 KD in TET2-KO K-562 cells. Barplot depicting the odds ratio of upDEGs following TET2 KO, in comparison to both upDEGs and downDEGs upon MBD6 KD in TET2 KO K-562 cells. j, KEGG pathway enrichment analysis performed on genes that were upregulated in TET2-KO in control K-562 cells, and downregulated in MBD6-KD in TET2-KO K-562 cells. Larger circles indicate greater significance. k, Correlation of gene expression changes between TET2 KO versus WT, and MBD6 KD versus control in TET2 KO K-562 cells. The genes are associated with various signalling pathways, including Th1 and Th2 cell differentiation, NF-kappa B signalling pathway, and C-type lectin receptor signalling pathways. Error band represents standard errors. Bar represents mean (b) and whiskers s.e.m. P values, Wald test (d,f), two-tailed Fisher’s Exact Test (i), one-sided Fisher’s Exact test (j), two-tailed t-distribution with n-2 degrees of freedom (g). n = 3 biological replicates (a-c,e). The depicted genome-wide data represent an integration of three biological replicates.
Extended Data Fig. 10 MBD6 governs a transcription program in leukaemic cell through regulating H2AK119ub. a, Representative subcellular fractionation of K-562 cells. Cyt: cytosolic; Nuc: nuclear soluble; Chr: chromatin. b, Overall caRNA and whole-cell RNA abundance relative to spike-in in WT, TET2-KO and TET2-KO + MBD6-KD K-562 cells. c, Metagene profile of the calibrated ATAC-seq signals of WT (siNC WT) and Tet2 KO (siNC Tet2 KO) K-562 cells, as well as in Mbd6 KD (siMbd6 Tet2 KO) Tet2 KO K-562 cells. d, Volcano plot comparing spike-in calibrated ATAC-seq peaks in Mbd6-KD versus control in Tet2-KO K-562 cells. e, Metagene profile of the spike-in calibrated H2AK119ub signals of WT (siNC WT) and Tet2-KO (siNC Tet2 KO) K-562 cells, as well as in Mbd6-KD (siMbd6 Tet2-KO) Tet2-KO K-562 cells. f, Volcano plot comparing spike-in calibrated H2AK119ub peaks in Mbd6-KD compared with control Tet2-KO K-562 cells. g, Correlation between changes in ATAC and H2AK119ub signals, comparing Mbd6-KD with control in Tet2-KO K-562 cells. h, Venn diagram displaying the significantly up-regulated ATAC-seq peaks in Tet2-KO compared with WT K-562 cells, and down-regulated ATAC-seq peaks in Nsun2-KD or Mbd6-KD compared with control Tet2-KO K-562 cells. i, Overlap of differentially expressed genes upon TET2 KO in control K-562 cells, and upon MBD6 KD in TET2-KO K-562 cells. Barplot depicting the odds ratio of upDEGs following TET2 KO, in comparison to both upDEGs and downDEGs upon MBD6 KD in TET2 KO K-562 cells. j, KEGG pathway enrichment analysis performed on genes that were upregulated in TET2-KO in control K-562 cells, and downregulated in MBD6-KD in TET2-KO K-562 cells. Larger circles indicate greater significance. k, Correlation of gene expression changes between TET2 KO versus WT, and MBD6 KD versus control in TET2 KO K-562 cells. The genes are associated with various signalling pathways, including Th1 and Th2 cell differentiation, NF-kappa B signalling pathway, and C-type lectin receptor signalling pathways. Error band represents standard errors. Bar represents mean (b) and whiskers s.e.m. P values, Wald test (d,f), two-tailed Fisher’s Exact Test (i), one-sided Fisher’s Exact test (j), two-tailed t-distribution with n-2 degrees of freedom (g). n = 3 biological replicates (a-c,e). The depicted genome-wide data represent an integration of three biological replicates.CC BY · PubMed Central

Verification

Claims the paper makes

123 Own result · 27 Own interpretation · 24 Own method · 19 Check pending · 7 Not checked yet · 1 No full text of the sources

  • It may state two separate claims as one. 44
  • Probably not a substantial claim. 33

Create a free account to see these claims.

Create a free account to see these assumptions.

122 more claims

Create a free account to see all 201 claims and to verify the 40 references still open.

See all claims — free account

Citations

Cites

Show all 65 references

Cited by

See all 103

Metadata

Authors
Zou, Z., Dou, X., Li, Y., Zhang, Z., Wang, J., Gao, B., Xiao, Y., Wang, Y., Zhao, L., Sun, C., Liu, Q., Yu, X., Wang, H., Hong, J., Dai, Q., Yang, F.-C., Xu, M., & He, C.
Affiliations
  • Howard Hughes Medical Institute (US)
  • The University of Texas at San Antonio Health Science Center (US)
Corresponding author
  • Xu, Mingjiang
  • He, Chuan
Venue
Nature
Published
2024-10-02
Volume
634
Issue
8035
Pages
986-994
ISSN
  • 0028-0836 (ISSN-L)
  • 1476-4687
OpenAlex
W4403063005
Cited by
103
References
65
Citations by year
2026: 53 · 2025: 44 · 2024: 5
FWCI
28.59
Type
journal article
Language
en
Open access
Locations
  • Nature (publishedVersion, cc-by)
  • PubMed Central (publishedVersion, cc-by-nc-nd)
  • PubMed (publishedVersion)
  • RePEc: Research Papers in Economics (submittedVersion)
  • Knowledge@UChicago (University of Chicago) (submittedVersion)
  • University of Chicago
Funders
  • National Institutes of Health
  • National Heart, Lung, and Blood Institute (R01HL145883, R01HL146664, R01HL174477)
  • National Human Genome Research Institute (RM1HG008935)
  • National Cancer Institute (R01CA285299)
Topics
  • Health Sciences › Medicine › Hematology › Acute Myeloid Leukemia Research
  • Life Sciences › Biochemistry, Genetics and Molecular Biology › Molecular Biology › Epigenetics and DNA Methylation
  • Life Sciences › Biochemistry, Genetics and Molecular Biology › Molecular Biology › RNA modifications and cancer
Keywords
TET2, 5-methylcytosine oxidation, histone deubiquitination, open chromatin, chromatin regulation, leukemogenesis, myeloid neoplasms, hematopoietic stem cells, hematopoiesis, therapeutic target
MeSH terms
Cell Self Renewal, Animals, Chromatin, DNA-Binding Proteins, Female, Hematopoiesis, Histones, Humans, Leukemia, Male, Mutation, Oxidation-Reduction, RNA, Transcription, Genetic, Retroelements, 5-Methylcytosine, Cell Proliferation, Dioxygenases, Mice, Ubiquitination, Carcinogenesis

About these checks

Registry, retraction, Cites and statistics results are computed, not judged, with one exception: a printed reference that no index lists is read once by a model before it counts as a citation error. Claims are extracted by a model and kept only when their quote appears verbatim in the text; each cited source is then checked, with a model’s help, for whether it says what the claim relies on. Those verdicts can be wrong — read the claim’s quote and the cited source before relying on one.

A language model drew the claims from the paper on 2026-11-12, under version 3 of the claim definition (model deepseek-v4.1-flash, prompt extract-v3).

A second model labelled each claim on 2026-11-12 (model jev-1.13-20260917, definition revision gold-guideline-v0.2).

Statistics and arithmetic are recomputed, not judged.

Confidence bands are shown only for fields calibrated on our annotated test set. None is calibrated yet, so no band is shown.

What counts as a claim ›How we measure confidence ›How we check this ›

Are you an author, or do you see a problem with this page? Request a review

How to cite

Cite CoChat for the checks on this page, and the paper for its own findings.

This page
CoChat. (2026). Citation check: RNA m5C oxidation by TET2 regulates chromatin state and leukaemogenesis. https://app.cochat.ai/papers/10.1038/s41586-024-07969-x
The paper
Zou, Z., Dou, X., Li, Y., Zhang, Z., Wang, J., Gao, B., Xiao, Y., Wang, Y., Zhao, L., Sun, C., Liu, Q., Yu, X., Wang, H., Hong, J., Dai, Q., Yang, F.-C., Xu, M., & He, C. (2024). RNA m5C oxidation by TET2 regulates chromatin state and leukaemogenesis. Nature. https://doi.org/10.1038/s41586-024-07969-x