Cited by 228Single-cell and spatial transcriptomicsGene Regulatory Network AnalysisGenomics and Chromatin Dynamics

The DOI matches its Crossref record; 73 of the 73 references it cites were found in a registry or an index.

SEACells infers transcriptional and epigenomic cellular states from single-cell genomics data

Open access

Abstract

Metacells are cell groupings derived from single-cell sequencing data that represent highly granular, distinct cell states. Here we present single-cell aggregation of cell states (SEACells), an algorithm for identifying metacells that overcome the sparsity of single-cell data while retaining heterogeneity obscured by traditional cell clustering. SEACells outperforms existing algorithms in identifying comprehensive, compact and well-separated metacells in both RNA and assay for transposase-accessible chromatin (ATAC) modalities across datasets with discrete cell types and continuous trajectories. We demonstrate the use of SEACells to improve gene–peak associations, compute ATAC gene scores and infer the activities of critical regulators during differentiation. Metacell-level analysis scales to large datasets and is particularly well suited for patient cohorts, where per-patient aggregation provides more robust units for data integration. We use our metacells to reveal expression dynamics and gradual reconfiguration of the chromatin landscape during hematopoietic differentiation and to uniquely identify CD4 T cell differentiation and activation states associated with disease onset and severity in a Coronavirus Disease 2019 (COVID-19) patient cohort.

Overview

The claims and statistics of this paper haven’t been checked yet.

Run the check — free, no account needed. It reads the open-access text and checks the sources it cites.

A few free checks a day · papers already verified open instantly · results are public

Integrity signals

Registry

Crossref · 10.1038/s41587-023-01716-9

Cites

73 of 73 references verified0 citation errors · 0 not checkable

Statistics

Figures

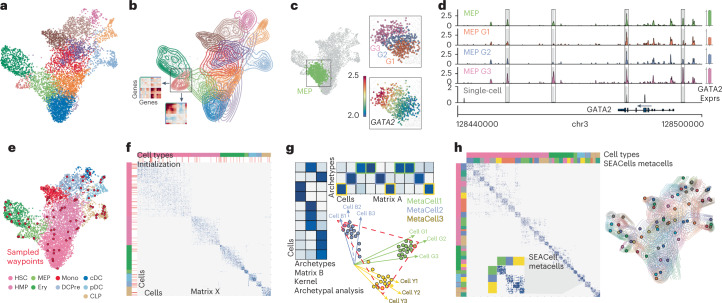
Fig. 1 Overview of the SEACells algorithm for cell state identification from single-cell data. a, scRNA-seq UMAP of 6,800 CD34+ sorted hematopoietic stem and progenitor cells (HSPCs). Cells are colored by cluster. b, Contour plots of each cluster highlight density and indicate the presence of multiple cell states within each cluster. Inset: gene–gene covariance matrices reveal that each state includes multiple distinct gene expression programs. c, Left: UMAP indicating the MEP (megakaryocyte-erythroid progenitor) cluster. Right: when the MEP cluster is divided into three equal-sized bins based on developmental progression (top, G1 to G3), it reflects imputed expression of GATA2 (known driver of MEP lineage) (bottom). d, Coverage plots showing GATA2 accessibility in all MEPs (top), in a single MEP cell (bottom) and in the three bins in c. Right: expression of GATA2 in corresponding cells. Highlighted peaks demonstrate how accessibility dynamics track with expression dynamics. Information about dynamics is masked at the cluster level, whereas peak identification in single cells is too noisy. e, UMAP as in a, colored by cell type. The SEACells algorithm for metacell identification is initialized by waypoints (large red circles), a subset of cells sampled to uniformly cover the phenotypic landscape. f, Cell-to-cell affinity matrix computed using an adaptive Gaussian kernel. Cells are sorted by cell types (top annotation row). Second annotation row shows the SEACells initialization. g, Schematic of kernel archetypal analysis. The kernel matrix is decomposed into the archetype matrix B and embedding matrix A. Metacell membership is identified based on column-wise maximal values across the matrix A. Inset: Kernel archetypal analysis partitions cells into clusters of highly similar cells, making it ideally suited to the identification of robust cell states. h, Left: cell–cell affinity matrix from f but ordered by metacell assignment. Right: contour plot overlying UMAP from e, highlighting the distribution of metacells; cells and contours are colored by metacell assignment.
Fig. 1 Overview of the SEACells algorithm for cell state identification from single-cell data. a, scRNA-seq UMAP of 6,800 CD34+ sorted hematopoietic stem and progenitor cells (HSPCs). Cells are colored by cluster. b, Contour plots of each cluster highlight density and indicate the presence of multiple cell states within each cluster. Inset: gene–gene covariance matrices reveal that each state includes multiple distinct gene expression programs. c, Left: UMAP indicating the MEP (megakaryocyte-erythroid progenitor) cluster. Right: when the MEP cluster is divided into three equal-sized bins based on developmental progression (top, G1 to G3), it reflects imputed expression of GATA2 (known driver of MEP lineage) (bottom). d, Coverage plots showing GATA2 accessibility in all MEPs (top), in a single MEP cell (bottom) and in the three bins in c. Right: expression of GATA2 in corresponding cells. Highlighted peaks demonstrate how accessibility dynamics track with expression dynamics. Information about dynamics is masked at the cluster level, whereas peak identification in single cells is too noisy. e, UMAP as in a, colored by cell type. The SEACells algorithm for metacell identification is initialized by waypoints (large red circles), a subset of cells sampled to uniformly cover the phenotypic landscape. f, Cell-to-cell affinity matrix computed using an adaptive Gaussian kernel. Cells are sorted by cell types (top annotation row). Second annotation row shows the SEACells initialization. g, Schematic of kernel archetypal analysis. The kernel matrix is decomposed into the archetype matrix B and embedding matrix A. Metacell membership is identified based on column-wise maximal values across the matrix A. Inset: Kernel archetypal analysis partitions cells into clusters of highly similar cells, making it ideally suited to the identification of robust cell states. h, Left: cell–cell affinity matrix from f but ordered by metacell assignment. Right: contour plot overlying UMAP from e, highlighting the distribution of metacells; cells and contours are colored by metacell assignment.CC BY · PubMed Central
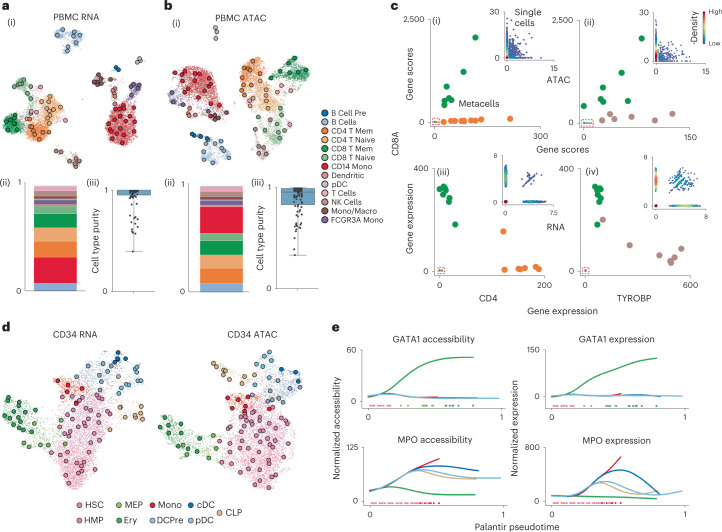
Fig. 2 SEACells metacells accurately identify cell states and outperform alternative approaches. a, (i) UMAP of human PBMCs in a 10x Genomics multiome dataset17, derived using RNA data, highlighting cell types and SEACells metacells. (ii) Distribution of metacells per cell type for the RNA modality. (iii) Distribution of cell type purity (frequency of the most represented cell type in each metacell). High purity represents a more accurate metacell. Boxes and line represent interquartile range (IQR) and median, respectively; whiskers represent ±1.5× IQR. b, UMAP, metacell and cell type purity distributions of human PBMCs as in a, using ATAC data from the multiome dataset. c, Metacell accessibility (i) and expression (iii) of CD4 and CD8A accurately distinguish CD8 (green) and CD4 (orange) T cell compartments. Metacell accessibility (ii) and expression (iv) of TYROBP and CD8A distinguish NK (brown) and CD8 (green) T cells. Insets: Corresponding single-cell accessibility is too sparse to achieve the same distinction. d, UMAPs of CD34+ HSPCs highlighting cell types and the SEACells metacells independently constructed from RNA (left) and ATAC (right) data. e, Accessibility (left) and expression (right) of GATA1 (erythroid factor) and MPO (myeloid factor) along the Palantir pseudotime axis representing hematopoietic differentiation. Palantir was run on RNA aggregates using ATAC metacells and accurately recapitulates dynamics.
Fig. 2 SEACells metacells accurately identify cell states and outperform alternative approaches. a, (i) UMAP of human PBMCs in a 10x Genomics multiome dataset17, derived using RNA data, highlighting cell types and SEACells metacells. (ii) Distribution of metacells per cell type for the RNA modality. (iii) Distribution of cell type purity (frequency of the most represented cell type in each metacell). High purity represents a more accurate metacell. Boxes and line represent interquartile range (IQR) and median, respectively; whiskers represent ±1.5× IQR. b, UMAP, metacell and cell type purity distributions of human PBMCs as in a, using ATAC data from the multiome dataset. c, Metacell accessibility (i) and expression (iii) of CD4 and CD8A accurately distinguish CD8 (green) and CD4 (orange) T cell compartments. Metacell accessibility (ii) and expression (iv) of TYROBP and CD8A distinguish NK (brown) and CD8 (green) T cells. Insets: Corresponding single-cell accessibility is too sparse to achieve the same distinction. d, UMAPs of CD34+ HSPCs highlighting cell types and the SEACells metacells independently constructed from RNA (left) and ATAC (right) data. e, Accessibility (left) and expression (right) of GATA1 (erythroid factor) and MPO (myeloid factor) along the Palantir pseudotime axis representing hematopoietic differentiation. Palantir was run on RNA aggregates using ATAC metacells and accurately recapitulates dynamics.CC BY · PubMed Central
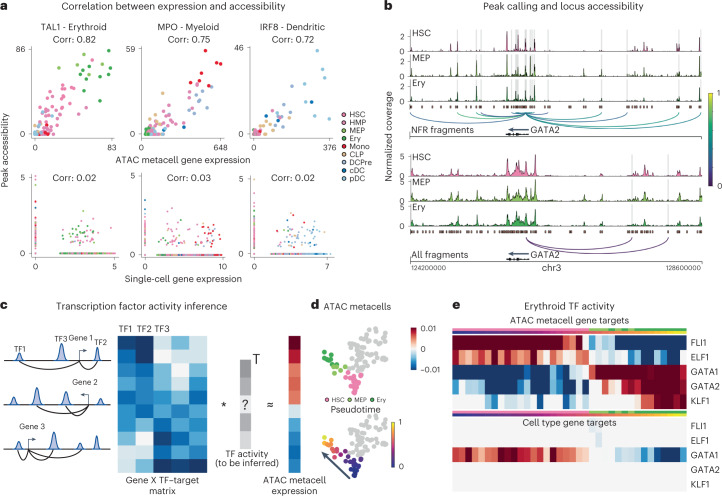
Fig. 3 SEACells empowers a gene regulatory toolkit. a, Spearman correlation between ATAC metacell-aggregated (top) or single-cell (bottom) gene expression and accessibility of the most correlated peak in TAL1 (erythroid), MPO (myeloid) and IRF (dendritic) marker genes, computed on CD34 multiome data. Each metacell and single cell is colored based on cell type. b, Accessibility landscape of erythroid factor GATA2 in HSCs, MEPs and erythroid cells (Ery) using NFR (top) or all ATAC (bottom) fragments. Restricting chromatin accessibility analysis to NFR fragments improves peak resolution and the association of regulatory elements with genes. Arcs are colored by peak–gene Spearman correlation (color values between 0 and 1 at right), determined using SEACells ATAC metacells. Highlighted peaks correlate significantly with GATA2 expression (two-sided nominal P < 0.1, empirical null distribution). c, Left: To construct a TF–target matrix for TF activity inference, motif scores of motifs within peaks are weighted by peak–gene correlations, as identified using SEACells metacells, for each gene. Right: The SEACells-derived TF–target matrix is used to predict the expression profile of a metacell and to infer TF activities per metacell. d, UMAPs highlighting metacells of the erythroid lineage, colored by pseudotime. e, Top: activities of top TFs across metacells of the erythroid lineage using the SEACells-derived TF–target matrix as input. Bottom: activities of the same TFs derived using the cell-type-specific TF–target matrix derived from pseudobulk ATAC profiles.
Fig. 3 SEACells empowers a gene regulatory toolkit. a, Spearman correlation between ATAC metacell-aggregated (top) or single-cell (bottom) gene expression and accessibility of the most correlated peak in TAL1 (erythroid), MPO (myeloid) and IRF (dendritic) marker genes, computed on CD34 multiome data. Each metacell and single cell is colored based on cell type. b, Accessibility landscape of erythroid factor GATA2 in HSCs, MEPs and erythroid cells (Ery) using NFR (top) or all ATAC (bottom) fragments. Restricting chromatin accessibility analysis to NFR fragments improves peak resolution and the association of regulatory elements with genes. Arcs are colored by peak–gene Spearman correlation (color values between 0 and 1 at right), determined using SEACells ATAC metacells. Highlighted peaks correlate significantly with GATA2 expression (two-sided nominal P < 0.1, empirical null distribution). c, Left: To construct a TF–target matrix for TF activity inference, motif scores of motifs within peaks are weighted by peak–gene correlations, as identified using SEACells metacells, for each gene. Right: The SEACells-derived TF–target matrix is used to predict the expression profile of a metacell and to infer TF activities per metacell. d, UMAPs highlighting metacells of the erythroid lineage, colored by pseudotime. e, Top: activities of top TFs across metacells of the erythroid lineage using the SEACells-derived TF–target matrix as input. Bottom: activities of the same TFs derived using the cell-type-specific TF–target matrix derived from pseudobulk ATAC profiles.CC BY · PubMed Central
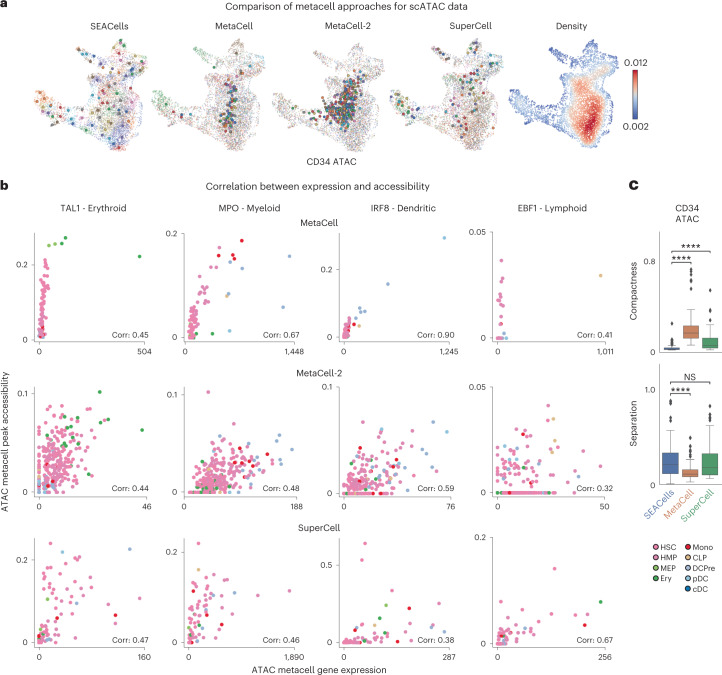
Fig. 4 SEACells outperforms existing methods in cell state representation and correlation of expression and accessibility. a, ATAC modality UMAPs of CD34+ bone marrow (as in Fig. 2d), colored by metacell aggregates identified by the specified method or colored by cell density. Dots, cells; circles, metacells. b, Pearson correlation between metacell-aggregated gene expression and accessibility of the most correlated peak in TAL1 (erythroid gene), MPO (myeloid gene), IRF (dendritic gene) and EBF1 (lymphoid gene) using the CD34+ bone marrow ATAC metacells called by MetaCell (top), MetaCell-2 (middle) or SuperCell (bottom). c, Metacell metrics measured in the ATAC modality of CD34+ bone marrow multiome data. Top: metacell compactness (average diffusion component standard deviation; Methods). A lower score indicates more compact metacells. Bottom: metacell separation (distance between nearest metacell neighbor in diffusion space; Methods). Greater separation indicates better performance. Comparisons were carried out on all metacells (n = 86). Two-sided Wilcoxon rank-sum test; NS: P > 0.05, ****P < 0.0001. Boxes and line represent interquartile range (IQR) and median, respectively; whiskers represent ±1.5× IQR. NS, not significant.
Fig. 4 SEACells outperforms existing methods in cell state representation and correlation of expression and accessibility. a, ATAC modality UMAPs of CD34+ bone marrow (as in Fig. 2d), colored by metacell aggregates identified by the specified method or colored by cell density. Dots, cells; circles, metacells. b, Pearson correlation between metacell-aggregated gene expression and accessibility of the most correlated peak in TAL1 (erythroid gene), MPO (myeloid gene), IRF (dendritic gene) and EBF1 (lymphoid gene) using the CD34+ bone marrow ATAC metacells called by MetaCell (top), MetaCell-2 (middle) or SuperCell (bottom). c, Metacell metrics measured in the ATAC modality of CD34+ bone marrow multiome data. Top: metacell compactness (average diffusion component standard deviation; Methods). A lower score indicates more compact metacells. Bottom: metacell separation (distance between nearest metacell neighbor in diffusion space; Methods). Greater separation indicates better performance. Comparisons were carried out on all metacells (n = 86). Two-sided Wilcoxon rank-sum test; NS: P > 0.05, ****P < 0.0001. Boxes and line represent interquartile range (IQR) and median, respectively; whiskers represent ±1.5× IQR. NS, not significant.CC BY · PubMed Central
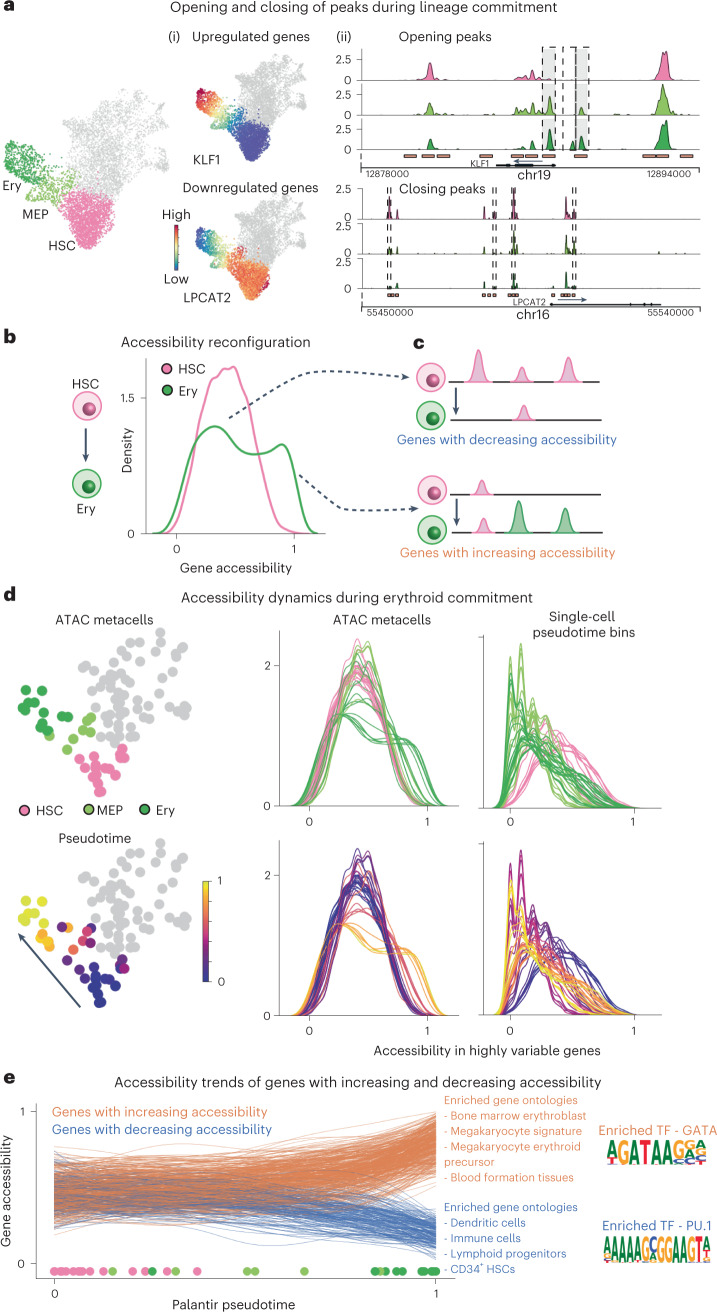
Fig. 5 Charting chromatin accessibility of hematopoietic differentiation using SEACells metacells. a, Differentiation along a particular lineage involves upregulation of lineage-defining genes and downregulation of stemness genes or genes that define alternative lineages. Left: RNA modality UMAP of CD34 bone marrow, with erythroid lineage cells highlighted. Middle: UMAPs colored by expression of erythroid gene KLF1 and stem gene LPCAT2, which are upregulated and downregulated, respectively, during erythroid differentiation. Right: accessibility landscapes of KLF1 (top) and LPCAT2 (bottom), aggregated by cell type, during erythroid differentiation. b, Distribution of gene accessibility for all highly regulated genes, for HSCs and for erythroid cells (Ery). Unimodal gene accessibility in HSCs is reconfigured to a bimodal distribution during erythroid differentiation. c, Schematic representation of observed peak dynamics. Bimodally distributed gene accessibility results from a subset of genes losing open peaks (top) and another subset gaining open peaks (bottom). d, Chromatin accessibility distribution of highly regulated genes in all metacells along the erythroid lineage (left, middle). Each line represents a metacell, colored by its stage (top) and pseudotime (bottom). The emergence of bimodality is gradual and continuous. Right: Signal is poorly defined when using single-cell pseudotime bins rather than metacells. e, Accessibility dynamics of genes that gain (orange) and lose (blue) open peaks during differentiation from HSCs to erythroid cells. Trajectory was computed using Palantir, with each line representing a fit gene trend and circles at bottom depicting pseudotime values of each respective metacell. Middle: results of Gene Ontology analysis using immune cell gene signatures. Right: Opening peaks are enriched for GATA motifs, and closing peaks are enriched for PU.1, master regulators of erythroid and myeloid fates, respectively.
Fig. 5 Charting chromatin accessibility of hematopoietic differentiation using SEACells metacells. a, Differentiation along a particular lineage involves upregulation of lineage-defining genes and downregulation of stemness genes or genes that define alternative lineages. Left: RNA modality UMAP of CD34 bone marrow, with erythroid lineage cells highlighted. Middle: UMAPs colored by expression of erythroid gene KLF1 and stem gene LPCAT2, which are upregulated and downregulated, respectively, during erythroid differentiation. Right: accessibility landscapes of KLF1 (top) and LPCAT2 (bottom), aggregated by cell type, during erythroid differentiation. b, Distribution of gene accessibility for all highly regulated genes, for HSCs and for erythroid cells (Ery). Unimodal gene accessibility in HSCs is reconfigured to a bimodal distribution during erythroid differentiation. c, Schematic representation of observed peak dynamics. Bimodally distributed gene accessibility results from a subset of genes losing open peaks (top) and another subset gaining open peaks (bottom). d, Chromatin accessibility distribution of highly regulated genes in all metacells along the erythroid lineage (left, middle). Each line represents a metacell, colored by its stage (top) and pseudotime (bottom). The emergence of bimodality is gradual and continuous. Right: Signal is poorly defined when using single-cell pseudotime bins rather than metacells. e, Accessibility dynamics of genes that gain (orange) and lose (blue) open peaks during differentiation from HSCs to erythroid cells. Trajectory was computed using Palantir, with each line representing a fit gene trend and circles at bottom depicting pseudotime values of each respective metacell. Middle: results of Gene Ontology analysis using immune cell gene signatures. Right: Opening peaks are enriched for GATA motifs, and closing peaks are enriched for PU.1, master regulators of erythroid and myeloid fates, respectively.CC BY · PubMed Central
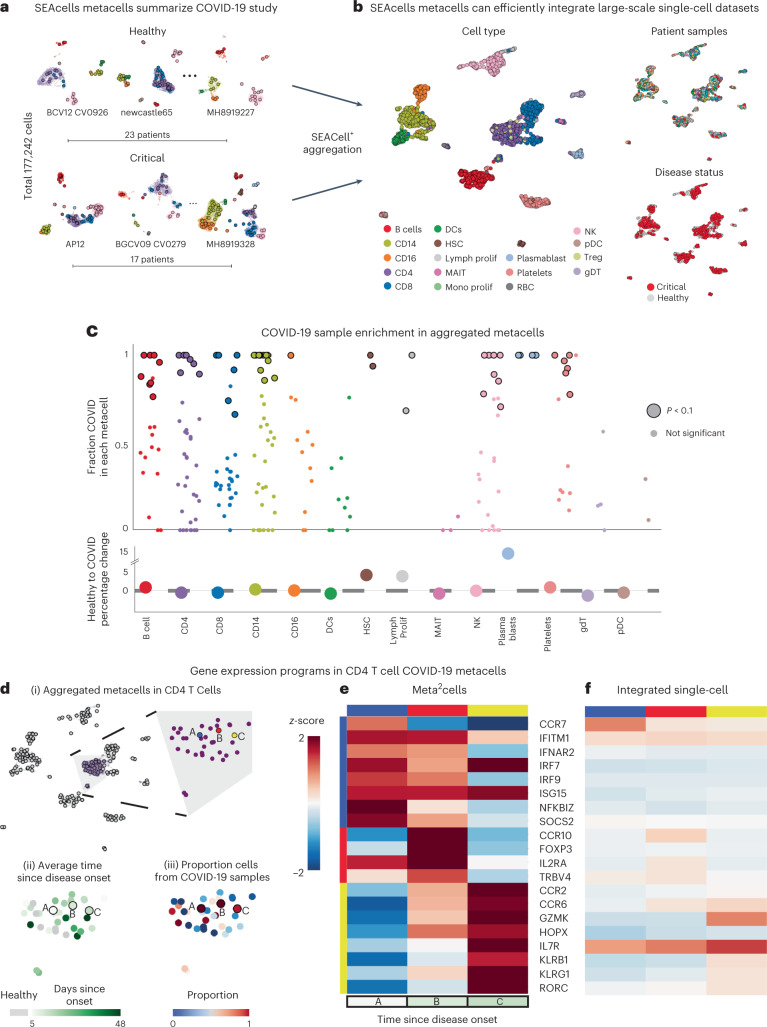
Fig. 6 SEACells metacells identify dysregulated states in patients with COVID-19. a, UMAPs showing PBMC profiles and respective metacells for a subset of healthy individuals and patients with critical COVID-19 (ref. 49). Dots, cells; circles, metacells. Cells and metacells are colored by cell type. b, UMAPs showing metacells from different patients integrated using Harmony45. Metacells are colored by cell type (left), sample (top right) or disease status (bottom right). c, Top: differential abundance of SEACells metacell states in patients with COVID-19 compared to healthy individuals, computed using a permutation test (Methods). Significantly differential metacells are plotted as enlarged circles. Bottom: difference in proportion of cells derived from patients with COVID-19 compared to healthy individuals, analyzed at the cell type level. Nominal P value derived from an empirical null distribution. d, (i) UMAP of metacell aggregates (meta2cells). Right: zoom-in on CD4 T cell meta2cells. Three meta2cells enriched in patients with COVID-19 compared to healthy individuals are highlighted. (ii) Same as (i), with meta2cells colored by time since disease onset. (iii) Same as (i), with meta2cells colored by proportion of COVID-19 cells. e, Expression patterns of T cell activation and differentiation enriched in highlighted CD4 T cell meta2cells. f, Expression patterns of the same genes in (iv) derived using pseudo-metacells by aggregating cells in the Harmony45 batch-corrected low-dimensional space.
Fig. 6 SEACells metacells identify dysregulated states in patients with COVID-19. a, UMAPs showing PBMC profiles and respective metacells for a subset of healthy individuals and patients with critical COVID-19 (ref. 49). Dots, cells; circles, metacells. Cells and metacells are colored by cell type. b, UMAPs showing metacells from different patients integrated using Harmony45. Metacells are colored by cell type (left), sample (top right) or disease status (bottom right). c, Top: differential abundance of SEACells metacell states in patients with COVID-19 compared to healthy individuals, computed using a permutation test (Methods). Significantly differential metacells are plotted as enlarged circles. Bottom: difference in proportion of cells derived from patients with COVID-19 compared to healthy individuals, analyzed at the cell type level. Nominal P value derived from an empirical null distribution. d, (i) UMAP of metacell aggregates (meta2cells). Right: zoom-in on CD4 T cell meta2cells. Three meta2cells enriched in patients with COVID-19 compared to healthy individuals are highlighted. (ii) Same as (i), with meta2cells colored by time since disease onset. (iii) Same as (i), with meta2cells colored by proportion of COVID-19 cells. e, Expression patterns of T cell activation and differentiation enriched in highlighted CD4 T cell meta2cells. f, Expression patterns of the same genes in (iv) derived using pseudo-metacells by aggregating cells in the Harmony45 batch-corrected low-dimensional space.CC BY · PubMed Central
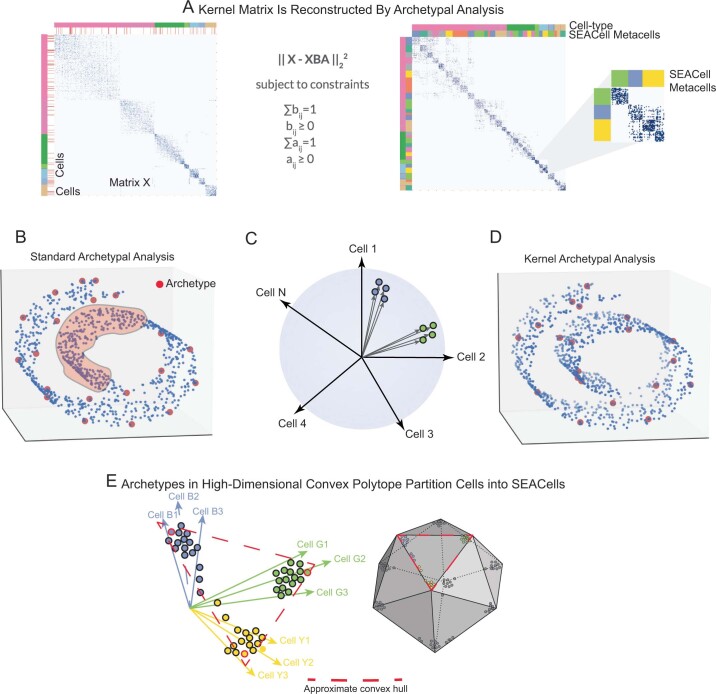
Extended Data Fig. 1 Kernel archetypal analysis to identify metacells. A. The kernel matrix (left) is decomposed into two the archetype matrix B and embedding matrix A. Metacell membership is identified based on column-wise maximal values across the matrix A. Right: The kernel matrix but ordered by metacell assignment. B. Standard archetypal analysis which uses linear convex hull approximation leads to identification of archetypes at the boundaries with no archetypes in internal regions of the manifold (highlighted region). C. The use of cell-cell similarity kernels to describe single-cell data casts highly similar cells into tiny clusters along a cone emanating from the origin. D. Kernel archetypal analysis opens up the interior regions and thus archetypes are identified across the manifold. E. The greater number of archetypes that result from kernel archetypal analysis, in addition to the use of a Gaussian kernel, creates a large number of highly similar cell ‘pockets’, each representing a unique biological state.
Extended Data Fig. 1 Kernel archetypal analysis to identify metacells. A. The kernel matrix (left) is decomposed into two the archetype matrix B and embedding matrix A. Metacell membership is identified based on column-wise maximal values across the matrix A. Right: The kernel matrix but ordered by metacell assignment. B. Standard archetypal analysis which uses linear convex hull approximation leads to identification of archetypes at the boundaries with no archetypes in internal regions of the manifold (highlighted region). C. The use of cell-cell similarity kernels to describe single-cell data casts highly similar cells into tiny clusters along a cone emanating from the origin. D. Kernel archetypal analysis opens up the interior regions and thus archetypes are identified across the manifold. E. The greater number of archetypes that result from kernel archetypal analysis, in addition to the use of a Gaussian kernel, creates a large number of highly similar cell ‘pockets’, each representing a unique biological state.CC BY · PubMed Central
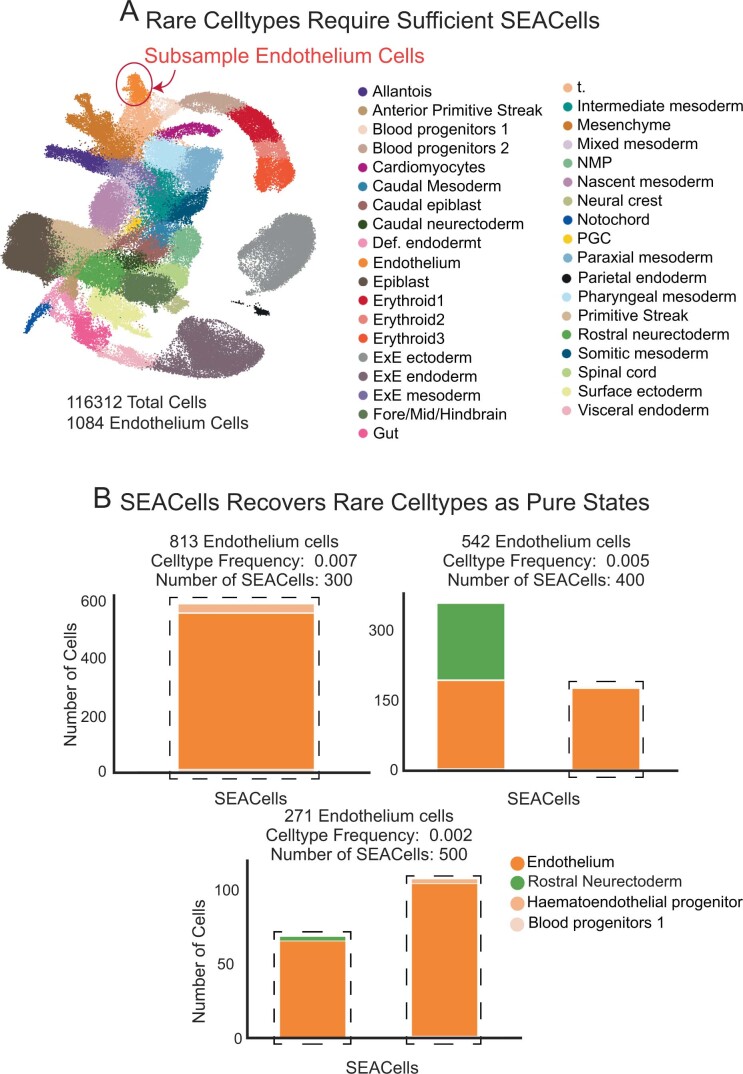
Extended Data Fig. 2 Sensitivity of SEACells algorithm to detect rare cell-types. A. UMAP of the mouse gastrulation atlas data1, with endothelial cells highlighted. B. Bar plots showing the cell-type composition of metacells containing at least 50% endothelial cells with various subsampling of endothelial cells from the mouse gastrulation data.
Extended Data Fig. 2 Sensitivity of SEACells algorithm to detect rare cell-types. A. UMAP of the mouse gastrulation atlas data1, with endothelial cells highlighted. B. Bar plots showing the cell-type composition of metacells containing at least 50% endothelial cells with various subsampling of endothelial cells from the mouse gastrulation data.CC BY · PubMed Central
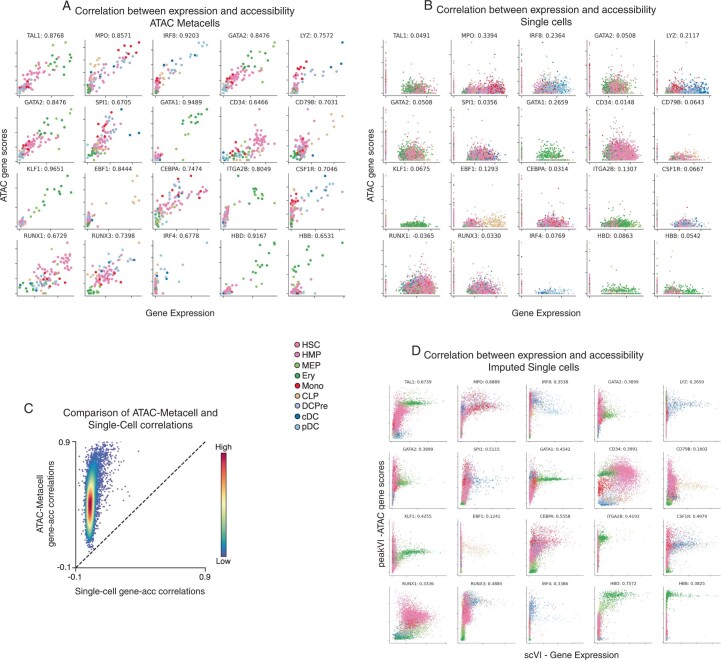
Extended Data Fig. 3 Comparison of ATAC gene scores using SEACells metacells and single cells. A. Relationship between metacell-aggregated gene expression and ATAC gene scores for a selection of key hematopoietic genes, computed on the CD34+ multiome data (Metacells computed on ATAC modality). Gene scores for metacells were computed by aggregating peaks that correlate significantly with expression. Spearman correlations appear next to the gene symbol. B. Same as in (A), but at single-cell level. Gene scores for single-cell data were computed using ArchR. C. Spearman correlations between gene expression and ATAC gene scores, plotted for metacells against single cells. Genes are colored by density. D. Correlation between scVI2-imputed gene expression and gene scores derived following peakVI3 imputation of peak accessibility for the genes in (A).
Extended Data Fig. 3 Comparison of ATAC gene scores using SEACells metacells and single cells. A. Relationship between metacell-aggregated gene expression and ATAC gene scores for a selection of key hematopoietic genes, computed on the CD34+ multiome data (Metacells computed on ATAC modality). Gene scores for metacells were computed by aggregating peaks that correlate significantly with expression. Spearman correlations appear next to the gene symbol. B. Same as in (A), but at single-cell level. Gene scores for single-cell data were computed using ArchR. C. Spearman correlations between gene expression and ATAC gene scores, plotted for metacells against single cells. Genes are colored by density. D. Correlation between scVI2-imputed gene expression and gene scores derived following peakVI3 imputation of peak accessibility for the genes in (A).CC BY · PubMed Central
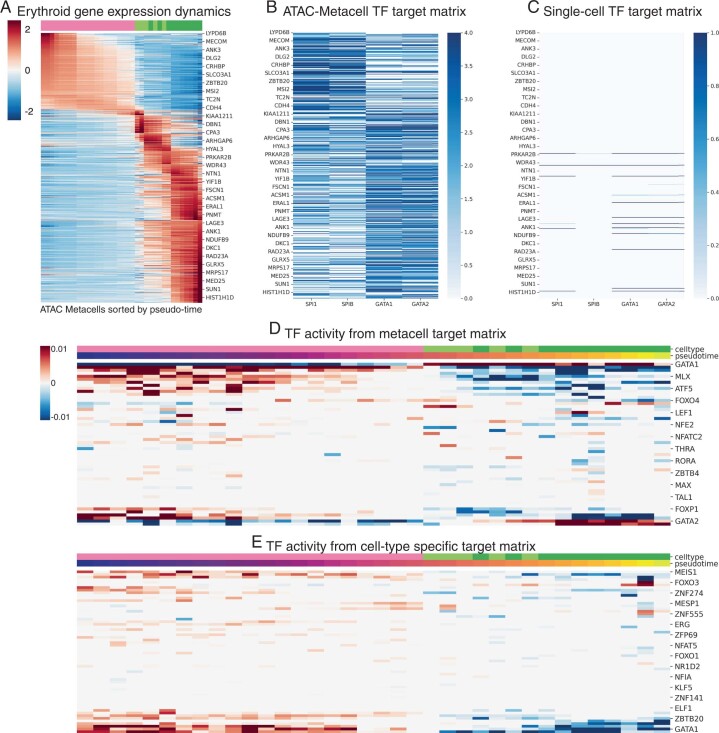
Extended Data Fig. 4 Inference of TF activities along erythroid lineage. A. z-scored expression of erythroid lineage metacells. The gene set was determined using differential expression between cell-types at the single-cell level. Each column represents a metacell along the erythroid lineage. B. TF-target matrix for SPI, SPIB, GATA1 and GATA2 for the same set of genes in (A). C. Same as (B), using the peak-gene associations derived using single cells. D. TF activities derived by applying the lasso regression approach (Methods) to the metacell derived TF-target matrix. E. TF activities derived by applying the lasso regression approach (Methods) to a TF-target matrix derived using cell-type-specific peaks.
Extended Data Fig. 4 Inference of TF activities along erythroid lineage. A. z-scored expression of erythroid lineage metacells. The gene set was determined using differential expression between cell-types at the single-cell level. Each column represents a metacell along the erythroid lineage. B. TF-target matrix for SPI, SPIB, GATA1 and GATA2 for the same set of genes in (A). C. Same as (B), using the peak-gene associations derived using single cells. D. TF activities derived by applying the lasso regression approach (Methods) to the metacell derived TF-target matrix. E. TF activities derived by applying the lasso regression approach (Methods) to a TF-target matrix derived using cell-type-specific peaks.CC BY · PubMed Central
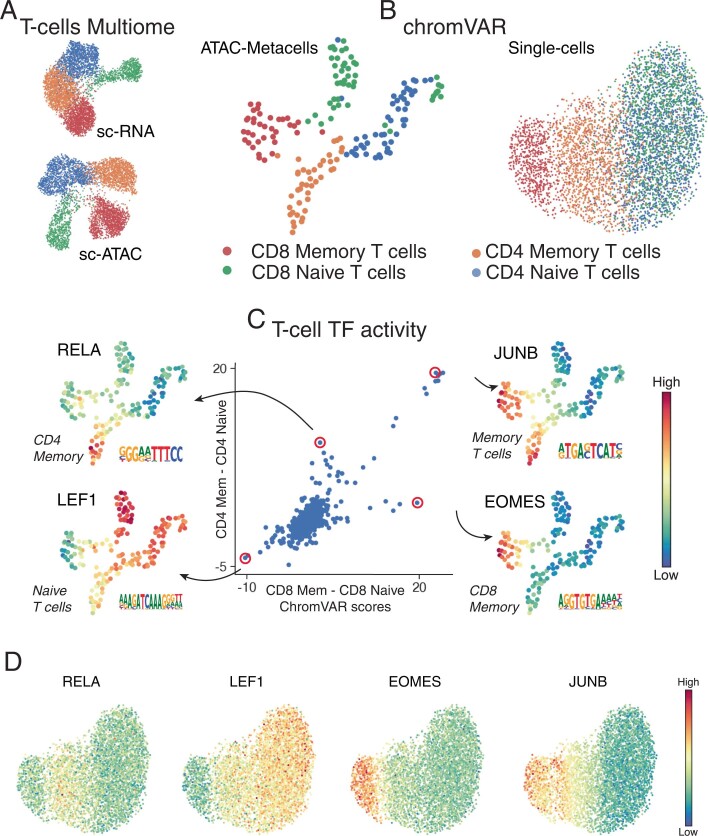
Extended Data Fig. 5 Single-cell chromVAR scores for T-cell subsets. A. RNA and ATAC UMAPs of the T-cell subset from the PBMC multiome dataset. B. UMAPs derived from chromVAR scores computed using single cells or metacell aggregates. All peaks were used for chromVAR analysis. Metacell chromVAR scores accurately recapitulate differences between T-cell subsets, whereas single-cell chromVAR scores fail to distinguish CD4+ and CD8+ T-cells. C. chromVAR score distributions can be used to identify key TFs that define different T-cell compartments. Each dot represents a TF. X-axis shows the difference between SEACells metacell chromVAR scores between the two CD8+ compartments. Y-axis shows the difference between SEACells metacell chromVAR scores between the two CD4+ compartments. D. UMAPs of T-cell subsets from PBMC multiome data (as in B) colored by single-cell chromVAR scores of key T-cell factors.
Extended Data Fig. 5 Single-cell chromVAR scores for T-cell subsets. A. RNA and ATAC UMAPs of the T-cell subset from the PBMC multiome dataset. B. UMAPs derived from chromVAR scores computed using single cells or metacell aggregates. All peaks were used for chromVAR analysis. Metacell chromVAR scores accurately recapitulate differences between T-cell subsets, whereas single-cell chromVAR scores fail to distinguish CD4+ and CD8+ T-cells. C. chromVAR score distributions can be used to identify key TFs that define different T-cell compartments. Each dot represents a TF. X-axis shows the difference between SEACells metacell chromVAR scores between the two CD8+ compartments. Y-axis shows the difference between SEACells metacell chromVAR scores between the two CD4+ compartments. D. UMAPs of T-cell subsets from PBMC multiome data (as in B) colored by single-cell chromVAR scores of key T-cell factors.CC BY · PubMed Central
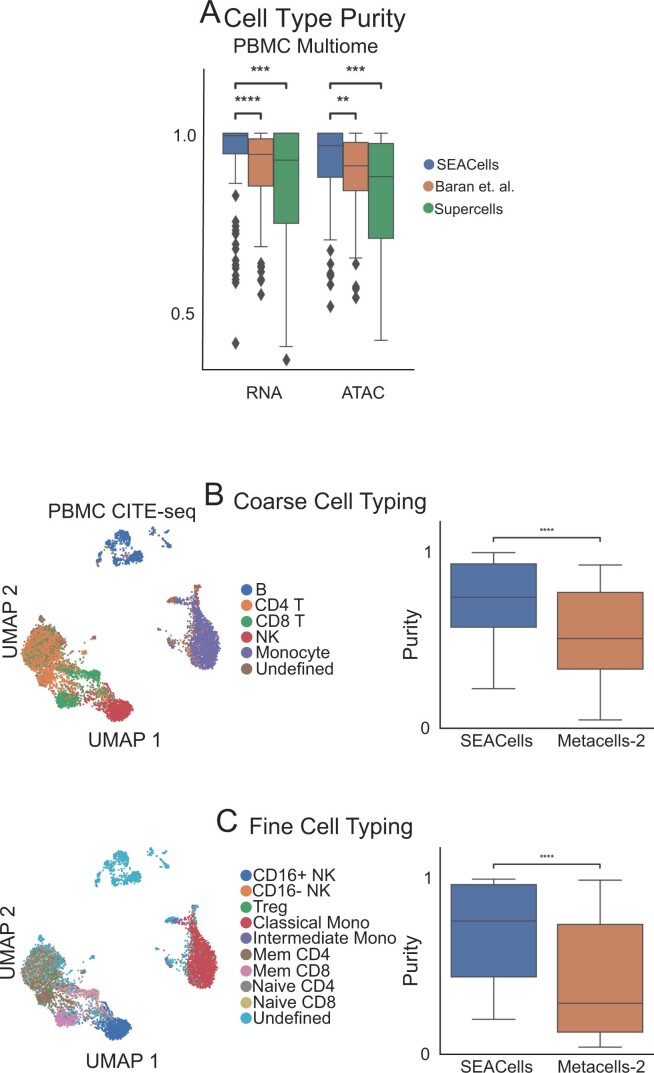
Extended Data Fig. 6 Comparison of RNA metacells to surface protein defined cell-types. A. Metacell cell-type purity (fraction of the maximally represented cell-type amongst the cells assigned to a metacell) computed by different methods on PBMC data. Wilcoxon rank-sum test was used to assess the significance of differences (** 0.001 < P < 0.01, *** 0.0001 < P < 0.0001, **** P < 0.0001). B. Left: UMAPs of 10x Genomics PBMC CITE-seq dataset5, colored by coarse cell-types. Right: Comparison of cell-type purity between SEACells and MetaCell-2 metacells. Metacells were identified using the RNA modality whereas cell types were determined using cell-surface protein profiles. C. Same as (A), for finer resolution cell-types. Box plots display median, 25th(Q1) and 75th (Q3) percentiles; whiskers extend to the furthest datapoint within the range 1.5 *(Q3-Q1); points beyond that are denoted as outliers. Number of metacells = 109.
Extended Data Fig. 6 Comparison of RNA metacells to surface protein defined cell-types. A. Metacell cell-type purity (fraction of the maximally represented cell-type amongst the cells assigned to a metacell) computed by different methods on PBMC data. Wilcoxon rank-sum test was used to assess the significance of differences (** 0.001 < P < 0.01, *** 0.0001 < P < 0.0001, **** P < 0.0001). B. Left: UMAPs of 10x Genomics PBMC CITE-seq dataset5, colored by coarse cell-types. Right: Comparison of cell-type purity between SEACells and MetaCell-2 metacells. Metacells were identified using the RNA modality whereas cell types were determined using cell-surface protein profiles. C. Same as (A), for finer resolution cell-types. Box plots display median, 25th(Q1) and 75th (Q3) percentiles; whiskers extend to the furthest datapoint within the range 1.5 *(Q3-Q1); points beyond that are denoted as outliers. Number of metacells = 109.CC BY · PubMed Central
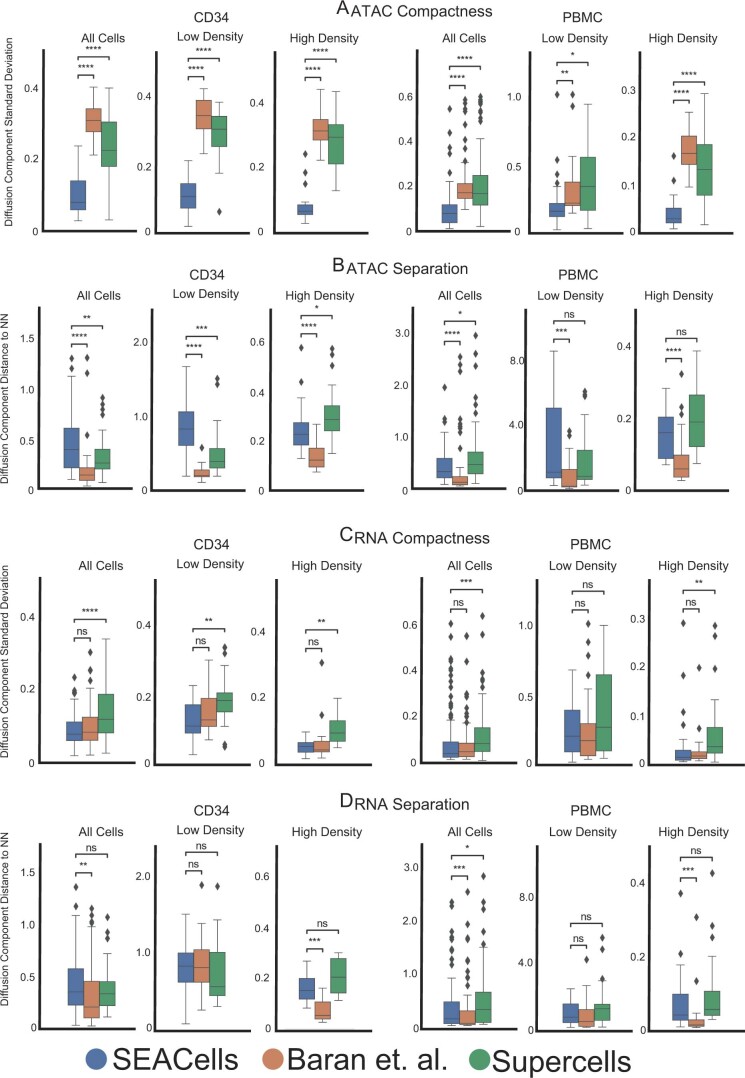
Extended Data Fig. 7 Performance of different approaches in achieving metacell compactness and separation. A. Metacell compactness (average diffusion component standard deviation; Methods) measured in the ATAC modality of CD34+ and PBMC multiome data. A lower score indicates more compact metacells. Number of metacells = 86 (CD34), 98 (PBMC). B. Metacell separation (distance between nearest metacell neighbor in diffusion space; Methods) measured in the ATAC modality of CD34+ and PBMC multiome data. Larger separation indicates better performance. Number of metacells = 86 (CD34), 98 (PBMC). C. Metacell compactness measured in the RNA modality of CD34+ and PBMC multiome data. Number of metacells = 65 (CD34), 98 (PBMC). D. Metacell separation measured in the RNA modality of CD34+ and PBMC multiome data. Larger separation indicates better performance. Number of metacells = 65 (CD34), 98 (PBMC). Comparisons were carried out on all metacells, or metacells in low-density or high-density regions. Two-sided Wilcoxon rank-sum test; ns: P > 0.05, * 0.01 < P < 0.05, ** 0.001 < P < 0.01, *** 0.0001 < P < 0.0001, **** P < 0.0001. Box plots display median, 25th(Q1) and 75th (Q3) percentiles; whiskers extend to the furthest datapoint within the range 1.5 *(Q3-Q1); points beyond that are denoted as outliers.
Extended Data Fig. 7 Performance of different approaches in achieving metacell compactness and separation. A. Metacell compactness (average diffusion component standard deviation; Methods) measured in the ATAC modality of CD34+ and PBMC multiome data. A lower score indicates more compact metacells. Number of metacells = 86 (CD34), 98 (PBMC). B. Metacell separation (distance between nearest metacell neighbor in diffusion space; Methods) measured in the ATAC modality of CD34+ and PBMC multiome data. Larger separation indicates better performance. Number of metacells = 86 (CD34), 98 (PBMC). C. Metacell compactness measured in the RNA modality of CD34+ and PBMC multiome data. Number of metacells = 65 (CD34), 98 (PBMC). D. Metacell separation measured in the RNA modality of CD34+ and PBMC multiome data. Larger separation indicates better performance. Number of metacells = 65 (CD34), 98 (PBMC). Comparisons were carried out on all metacells, or metacells in low-density or high-density regions. Two-sided Wilcoxon rank-sum test; ns: P > 0.05, * 0.01 < P < 0.05, ** 0.001 < P < 0.01, *** 0.0001 < P < 0.0001, **** P < 0.0001. Box plots display median, 25th(Q1) and 75th (Q3) percentiles; whiskers extend to the furthest datapoint within the range 1.5 *(Q3-Q1); points beyond that are denoted as outliers.CC BY · PubMed Central
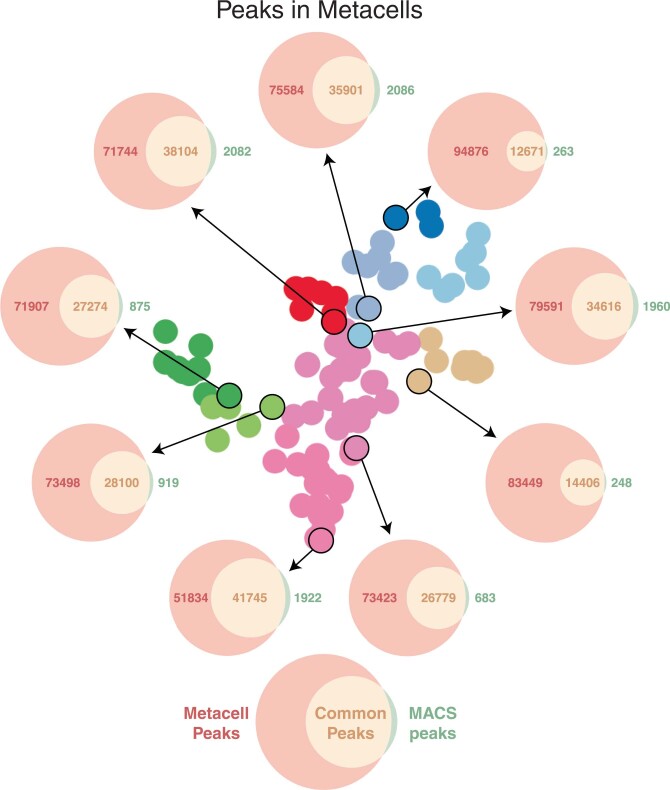
Extended Data Fig. 8 Metacell peak calling. Each Venn diagram depicts the number of peaks in a metacell based on de novo peak calling using MACS2 on the metacell ATAC fragments (green), open peaks called using Poisson statistics on ATAC fragments from all cells in the sample (red), and the intersection set (orange). De novo peak calling always leads to fewer peaks.
Extended Data Fig. 8 Metacell peak calling. Each Venn diagram depicts the number of peaks in a metacell based on de novo peak calling using MACS2 on the metacell ATAC fragments (green), open peaks called using Poisson statistics on ATAC fragments from all cells in the sample (red), and the intersection set (orange). De novo peak calling always leads to fewer peaks.CC BY · PubMed Central
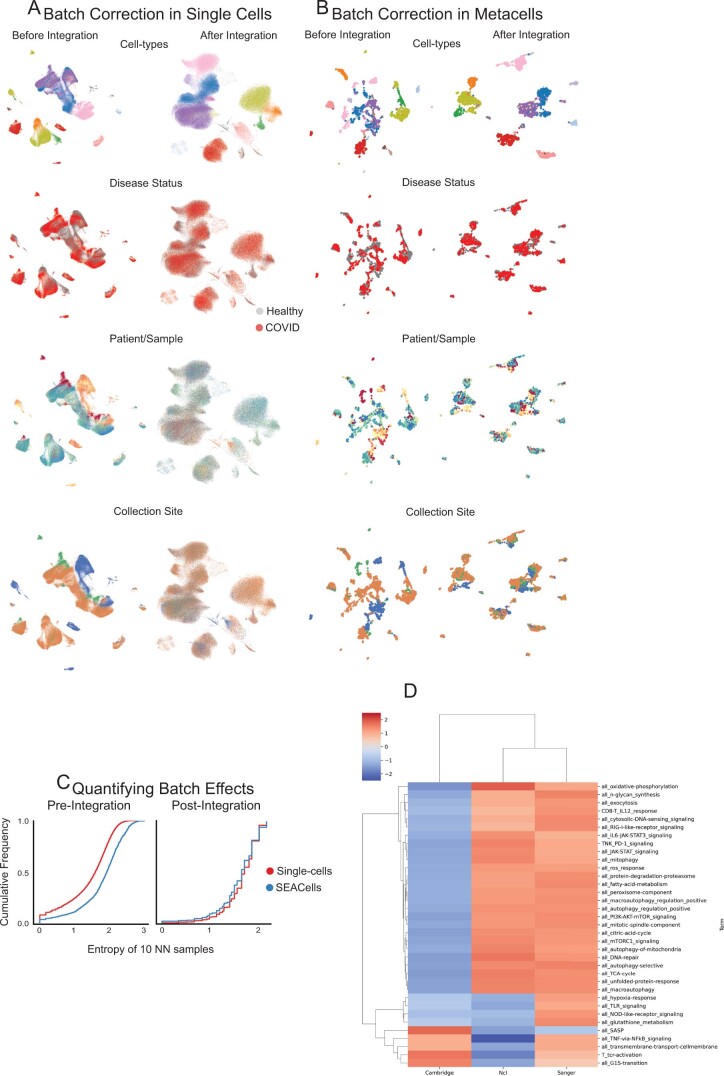
Extended Data Fig. 9 Large-scale data integration using SEACells. A. UMAPs of single-cell data from healthy donors and critical COVID-19 patients before (left) and after (right) batch correction and data integration using Harmony4. B. Same as (A) for SEACells metacells instead of single cells. C. Cumulative distribution showing the entropy of samples among 10 nearest neighbors before integration (left) and after integration (right). D. GSEA normalized enrichment scores for each T-cell pathway (Supplementary Table 1) for differentially expressed genes among CD4+ T cells from different sites of sample collection.
Extended Data Fig. 9 Large-scale data integration using SEACells. A. UMAPs of single-cell data from healthy donors and critical COVID-19 patients before (left) and after (right) batch correction and data integration using Harmony4. B. Same as (A) for SEACells metacells instead of single cells. C. Cumulative distribution showing the entropy of samples among 10 nearest neighbors before integration (left) and after integration (right). D. GSEA normalized enrichment scores for each T-cell pathway (Supplementary Table 1) for differentially expressed genes among CD4+ T cells from different sites of sample collection.CC BY · PubMed Central
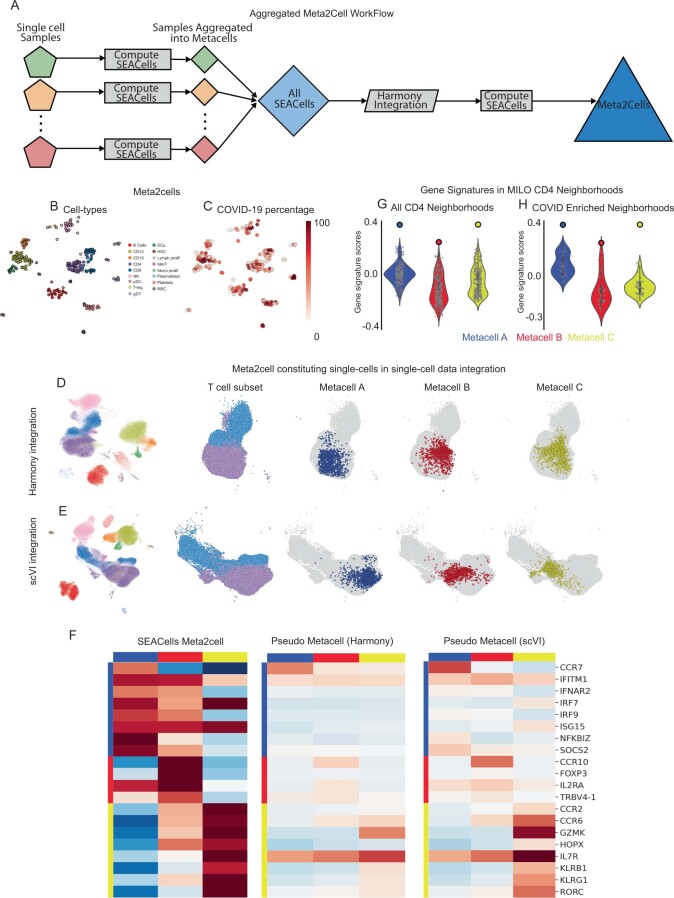
Extended Data Fig. 10 Metacell aggregates enable comparison across conditions. A. Workflow used to generate metacell aggregates, or meta2cells, that span across healthy and COVID-19 samples. B. UMAPs showing meta2cells, colored by cell type. C. Same as (B), colored by percentage of cells derived from COVID-19 patients. D. Left: Single-cell UMAPs of the healthy and COVID-19 samples following Harmony4 integration. UMAPs on the right illustrate the UMAP region with the T-cell subsets and the cells constituting meta2cells highlighted in Fig. 6D. E. Same as (D), with UMAPs derived using scVI5 latent space. F. Expression patterns of key T-cell defining genes in meta2cells from Fig. 6D, pseudo-metacells derived using Harmony and scVI. Pseudo-metacells were derived using a neighborhood of 1078, 1161, and 1119 cells for metacells A, B and C respectively from the median position of batch-corrected low-dimensional space (see Methods). G, H. Gene signature scores for the CD4+ metacells in Fig. 6D. Violin plots represent signature scores for Milo neighborhoods, solid dots represent scores for the SEACells metacells. Scores are computed for all CD4+ T-cell Milo neighborhoods (G) and for the subset of neighborhoods enriched in COVID-19 (H). Number of metacells = 276. Violin plots display median, 25th(Q1) and 75th (Q3) percentiles; whiskers extend to the furthest datapoint within the range 1.5 *(Q3-Q1); points beyond that are denoted as outliers.
Extended Data Fig. 10 Metacell aggregates enable comparison across conditions. A. Workflow used to generate metacell aggregates, or meta2cells, that span across healthy and COVID-19 samples. B. UMAPs showing meta2cells, colored by cell type. C. Same as (B), colored by percentage of cells derived from COVID-19 patients. D. Left: Single-cell UMAPs of the healthy and COVID-19 samples following Harmony4 integration. UMAPs on the right illustrate the UMAP region with the T-cell subsets and the cells constituting meta2cells highlighted in Fig. 6D. E. Same as (D), with UMAPs derived using scVI5 latent space. F. Expression patterns of key T-cell defining genes in meta2cells from Fig. 6D, pseudo-metacells derived using Harmony and scVI. Pseudo-metacells were derived using a neighborhood of 1078, 1161, and 1119 cells for metacells A, B and C respectively from the median position of batch-corrected low-dimensional space (see Methods). G, H. Gene signature scores for the CD4+ metacells in Fig. 6D. Violin plots represent signature scores for Milo neighborhoods, solid dots represent scores for the SEACells metacells. Scores are computed for all CD4+ T-cell Milo neighborhoods (G) and for the subset of neighborhoods enriched in COVID-19 (H). Number of metacells = 276. Violin plots display median, 25th(Q1) and 75th (Q3) percentiles; whiskers extend to the furthest datapoint within the range 1.5 *(Q3-Q1); points beyond that are denoted as outliers.CC BY · PubMed Central

Verification

Claims the paper makes

The claims and statistics of this paper haven’t been checked yet.

Run the check — free, no account needed. It reads the open-access text and checks the sources it cites.

A few free checks a day · papers already verified open instantly · results are public

Claims other papers make about this one

Each is checked against this paper’s own text: does it say what the citing paper says it does?

Self-check

Percentages, sums and reported differences re-computed from the paper’s own numbers.

The self-check needs the paper’s full text.

Citations

Cites

Show all 72 references

Research works printed but not linked: 2

  1. Bauckage, C., Kersting, K., Hoppe, F. & Thurau, C. in Workshop New Challenges in Neural Computation. https://www.techfak.uni-bielefeld.de/~fschleif/mlr/mlr_03_2015.pdf (2015).
  2. McDaid, A. F., Greene, D. & Hurley, N. Normalized mutual information to evaluate overlapping community finding algorithms. Preprint at https://arxiv.org/abs/1110.2515 (2011). · arXiv

Cited by

Sorted by citations

Items 201–228 of 228

Metadata

Authors
Persad, S., Choo, Z.-N., Dien, C., Sohail, N., Masilionis, I., Chaligné, R., Nawy, T., Brown, C. C., Sharma, R., Pe’er, I., Setty, M., & Pe’er, D.
Affiliations
  • Memorial Sloan Kettering Cancer Center (US)
  • Fred Hutch Cancer Center (US)
  • Columbia University (US)
Corresponding author
  • Pe’er, Itsik
  • Setty, Manu
  • Pe’er, Dana
Venue
Nature Biotechnology
Published
2023-03-27
Volume
41
Issue
12
Pages
1746-1757
ISSN
  • 0733-222X (ISSN-L)
  • 1087-0156
  • 1546-1696
OpenAlex
W4360999291
Cited by
222
References
72
Citations by year
2026: 72 · 2025: 54 · 2024: 72 · 2023: 20
FWCI
19.87
Type
journal article
Language
en
Open access
Locations
  • Nature Biotechnology (publishedVersion, cc-by)
  • PubMed Central (publishedVersion, cc-by)
  • PubMed (publishedVersion)
Funders
  • U.S. Department of Health & Human Services | NIH | National Institute of General Medical Sciences (R35 GM147125)
  • U.S. Department of Health & Human Services | NIH | National Cancer Institute (U54 CA209975, U2C CA233284)
  • Howard Hughes Medical Institute
Topics
  • Life Sciences › Biochemistry, Genetics and Molecular Biology › Molecular Biology › Single-cell and spatial transcriptomics
  • Life Sciences › Biochemistry, Genetics and Molecular Biology › Molecular Biology › Gene Regulatory Network Analysis
  • Life Sciences › Biochemistry, Genetics and Molecular Biology › Molecular Biology › Genomics and Chromatin Dynamics
Keywords
metacells, transcriptional heterogeneity, chromatin accessibility, ATAC-seq, single-cell RNA sequencing, hematopoietic differentiation, CD4+ T cell activation, COVID-19 pandemic, data integration
MeSH terms
Algorithms, Chromatin, Humans, CD4-Positive T-Lymphocytes, Genomics, Epigenomics, Single-Cell Analysis

About these checks

Registry, retraction, Cites and statistics results are computed, not judged, with one exception: a printed reference that no index lists is read once by a model before it counts as a citation error. Claims are extracted by a model and kept only when their quote appears verbatim in the text; each cited source is then checked, with a model’s help, for whether it says what the claim relies on. Those verdicts can be wrong — read the claim’s quote and the cited source before relying on one.

Statistics and arithmetic are recomputed, not judged.

Confidence bands are shown only for fields calibrated on our annotated test set. None is calibrated yet, so no band is shown.

What counts as a claim ›How we measure confidence ›How we check this ›

Are you an author, or do you see a problem with this page? Request a review