

The DOI matches its Crossref record; 22 of the 22 references it cites were found in a registry or an index.
De novo detection of somatic mutations in high-throughput single-cell profiling data sets
Published version of a preprint
Abstract
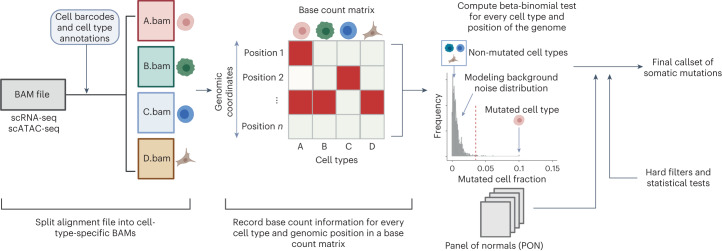
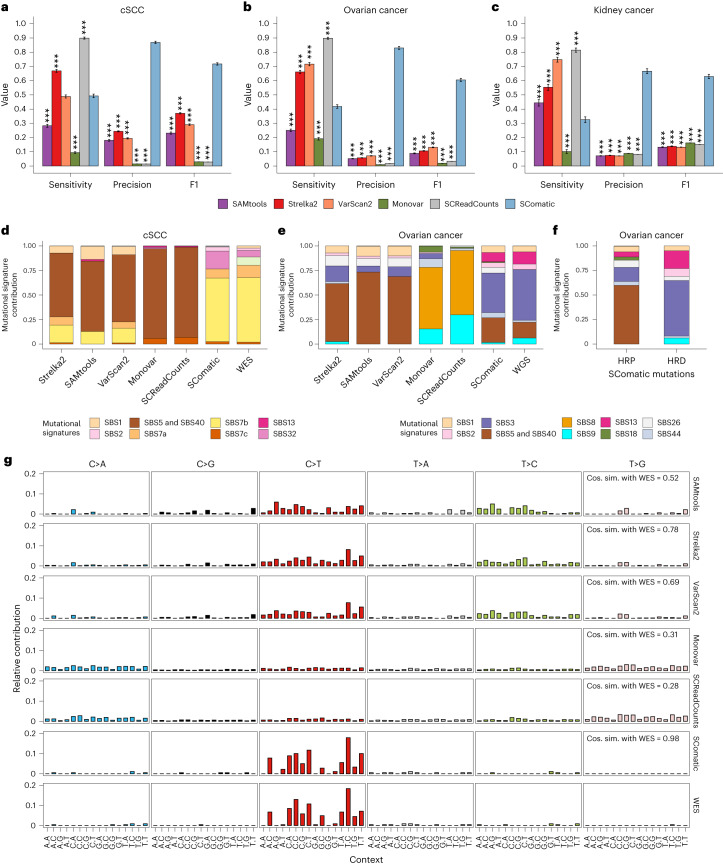
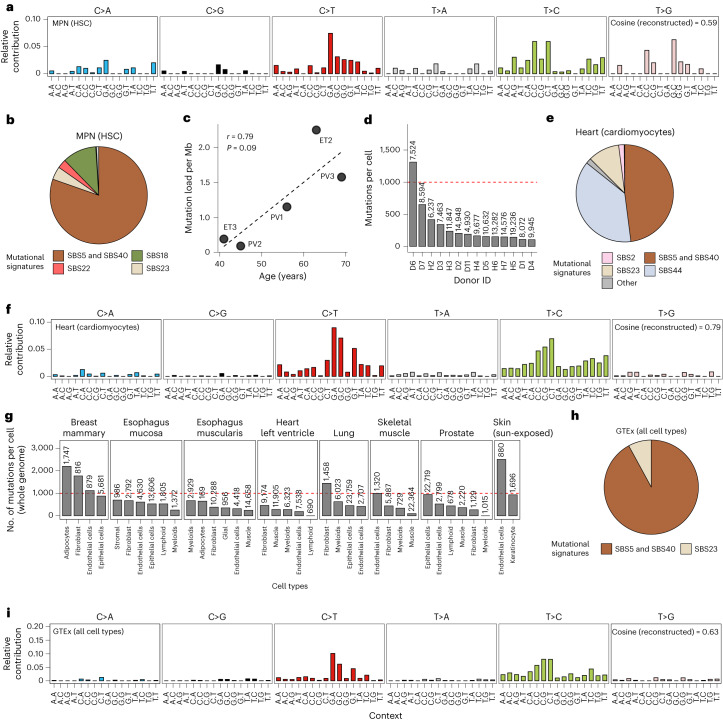
Characterization of somatic mutations at single-cell resolution is essential to study cancer evolution, clonal mosaicism and cell plasticity. Here, we describe SComatic, an algorithm designed for the detection of somatic mutations in single-cell transcriptomic and ATAC-seq (assay for transposase-accessible chromatin sequence) data sets directly without requiring matched bulk or single-cell DNA sequencing data. SComatic distinguishes somatic mutations from polymorphisms, RNA-editing events and artefacts using filters and statistical tests parameterized on non-neoplastic samples. Using >2.6 million single cells from 688 single-cell RNA-seq (scRNA-seq) and single-cell ATAC-seq (scATAC-seq) data sets spanning cancer and non-neoplastic samples, we show that SComatic detects mutations in single cells accurately, even in differentiated cells from polyclonal tissues that are not amenable to mutation detection using existing methods. Validated against matched genome sequencing and scRNA-seq data, SComatic achieves F1 scores between 0.6 and 0.7 across diverse data sets, in comparison to 0.2–0.4 for the second-best performing method. In summary, SComatic permits de novo mutational signature analysis, and the study of clonal heterogeneity and mutational burdens at single-cell resolution.
Overview
The claims and statistics of this paper haven’t been checked yet.
Run the check — free, no account needed. It reads the open-access text and checks the sources it cites.
Integrity signals
Registry
Cites
Statistics
Figures
Verification
Claims the paper makes
The claims and statistics of this paper haven’t been checked yet.
Run the check — free, no account needed. It reads the open-access text and checks the sources it cites.
Claims other papers make about this one
Each is checked against this paper’s own text: does it say what the citing paper says it does?
In the citing paper
“This strategy led to the identification of CH mutations in donors A.4 and A.7.”
From Clonal tracing with somatic epimutations reveals dynamics of blood ageing (2025) · cites this paper as [68]
Self-check
Percentages, sums and reported differences re-computed from the paper’s own numbers.
The self-check needs the paper’s full text.
Citations
Cites
Massively parallel digital transcriptional profiling of single cells
Zheng, G. X. Y., Terry, J. M., Belgrader, P., Ryvkin, P., Bent, Z. W., Wilson, R., Ziraldo, S. B., Wheeler, T. D., McDermott, G. P., Zhu, J., et al. (2017) · Nature Communications · doi:10.1038/ncomms14049 · Cited by 7,353
Comprehensive Characterization of Cancer Driver Genes and Mutations
Bailey, M. H., Tokheim, C., Porta-Pardo, E., Sengupta, S., Bertrand, D., Weerasinghe, A., Colaprico, A., Wendl, M. C., Kim, J., Reardon, B., et al. (2018) · Cell · doi:10.1016/j.cell.2018.02.060 · Cited by 2,256
Self-citationRegev, A., Teichmann, S. A., Lander, E. S., Amit, I., Benoist, C., Birney, E., Bodenmiller, B., Campbell, P., Carninci, P., Clatworthy, M., et al. (2017) · eLife · doi:10.7554/elife.27041 · Cited by 2,232 · cited 2×
“…SComatic opens the possibility to study somatic mutagenesis in humans using single-cell data sets generated under the auspices of large-scale initiatives, such as the Human Cell Atlas or the Human Tumor Atlas Network 52,53 , as well as in other organisms. https://doi.org/10.1038/s41587-023-01863-z”
InfluentialLandscape of somatic mutations in 560 breast cancer whole-genome sequences
Nik-Zainal, S., Davies, H., Staaf, J., Ramakrishna, M., Glodzik, D., Zou, X., Martincorena, I., Alexandrov, L. B., Martin, S., Wedge, D. C., et al. (2016) · Nature · doi:10.1038/nature17676 · Cited by 2,218
No evidence that carotenoid pigments boost either immune or antioxidant defenses in a songbird
Koch, R. E., Kavazis, A. N., Hasselquist, D., Hood, W. R., Zhang, Y., Toomey, M. B., & Hill, G. E. (2018) · Nature Communications · doi:10.1038/s41467-018-02974-x · Cited by 1,924
High burden and pervasive positive selection of somatic mutations in normal human skin
Martincorena, I., Roshan, A., Gerstung, M., Ellis, P., Van Loo, P., McLaren, S., Wedge, D. C., Fullam, A., Alexandrov, L. B., Tubio, J. M., et al. (2015) · Science · doi:10.1126/science.aaa6806 · Cited by 1,770
Cells of the adult human heart
Litviňuková, M., Talavera-López, C., Maatz, H., Reichart, D., Worth, C. L., Lindberg, E. L., Kanda, M., Polanski, K., Heinig, M., Lee, M., et al. (2020) · Nature · doi:10.1038/s41586-020-2797-4 · Cited by 1,729
The COSMIC Cancer Gene Census: describing genetic dysfunction across all human cancers
Sondka, Z., Bamford, S., Cole, C. G., Ward, S. A., Dunham, I., & Forbes, S. A. (2018) · Nature Reviews Cancer · doi:10.1038/s41568-018-0060-1 · Cited by 1,597
Single-Cell RNA-Seq Reveals AML Hierarchies Relevant to Disease Progression and Immunity
van Galen, P., Hovestadt, V., Wadsworth II, M. H., Hughes, T. K., Griffin, G. K., Battaglia, S., Verga, J. A., Stephansky, J., Pastika, T. J., Lombardi Story, J., et al. (2019) · Cell · doi:10.1016/j.cell.2019.01.031 · Cited by 1,164
Multimodal Analysis of Composition and Spatial Architecture in Human Squamous Cell Carcinoma
Ji, A. L., Rubin, A. J., Thrane, K., Jiang, S., Reynolds, D. L., Meyers, R. M., Guo, M. G., George, B. M., Mollbrink, A., Bergenstråhle, J., et al. (2020) · Cell · doi:10.1016/j.cell.2020.05.039 · Cited by 1,117 · cited 2×
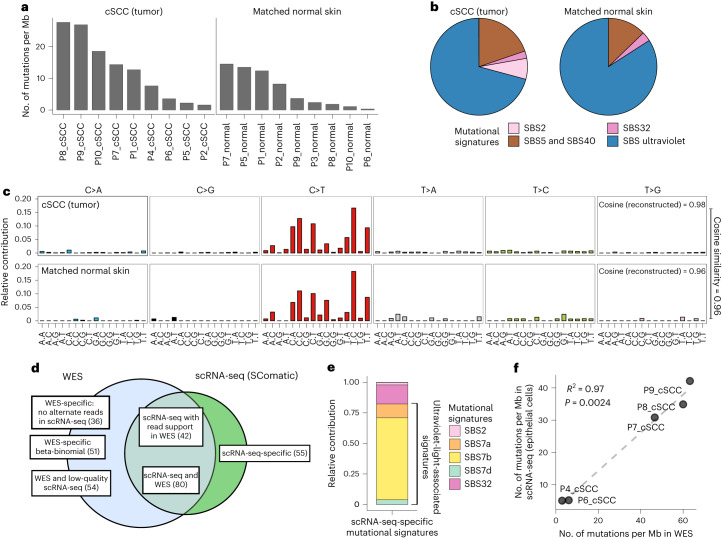
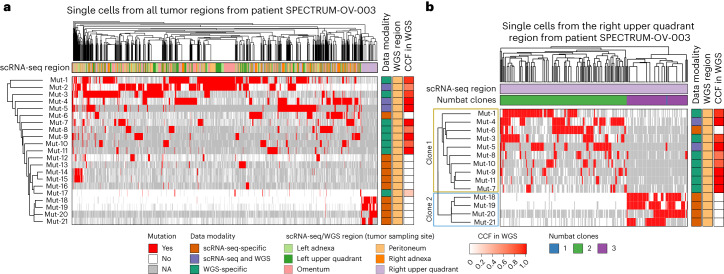
“To this end, we used the matched genome sequencing and scRNA-seq data from epithelial cells from seven out of the eight cSCC tumors described above 26 , and from nine kidney and fourteen ovarian tumors 33,34 .”
MutationalPatterns: comprehensive genome-wide analysis of mutational processes
Blokzijl, F., Janssen, R., van Boxtel, R., & Cuppen, E. (2018) · Genome Medicine · doi:10.1186/s13073-018-0539-0 · Cited by 660
Population dynamics of normal human blood inferred from somatic mutations
Lee-Six, H., Øbro, N. F., Shepherd, M. S., Grossmann, S., Dawson, K., Belmonte, M., Osborne, R. J., Huntly, B. J. P., Martincorena, I., Anderson, E., et al. (2018) · Nature · doi:10.1038/s41586-018-0497-0 · Cited by 604
Comprehensive Characterization of Cancer Driver Genes and Mutations
Bailey, M. H., Tokheim, C., Porta-Pardo, E., Sengupta, S., Bertrand, D., Weerasinghe, A., Colaprico, A., Wendl, M. C., Kim, J., Reardon, B., et al. (2018) · Cell · doi:10.1016/j.cell.2018.07.034 · Cited by 552
Self-citationThe mutational landscape of human somatic and germline cells
Moore, L., Cagan, A., Coorens, T. H. H., Neville, M. D. C., Sanghvi, R., Sanders, M. A., Oliver, T. R. W., Leongamornlert, D., Ellis, P., Noorani, A., et al. (2021) · Nature · doi:10.1038/s41586-021-03822-7 · Cited by 379
Self-citationSomatic mutations and cell identity linked by Genotyping of Transcriptomes
Nam, A. S., Kim, K.-T., Chaligne, R., Izzo, F., Ang, C., Taylor, J., Myers, R. M., Abu-Zeinah, G., Brand, R., Omans, N. D., et al. (2019) · Nature · doi:10.1038/s41586-019-1367-0 · Cited by 333
Life histories of myeloproliferative neoplasms inferred from phylogenies
Williams, N., Lee, J., Mitchell, E., Moore, L., Baxter, E. J., Hewinson, J., Dawson, K. J., Menzies, A., Godfrey, A. L., Green, A. R., et al. (2022) · Nature · doi:10.1038/s41586-021-04312-6 · Cited by 285
A general approach for detecting expressed mutations in AML cells using single cell RNA-sequencing
Petti, A. A., Williams, S. R., Miller, C. A., Fiddes, I. T., Srivatsan, S. N., Chen, D. Y., Fronick, C. C., Fulton, R. S., Church, D. M., & Ley, T. J. (2019) · Nature Communications · doi:10.1038/s41467-019-11591-1 · Cited by 215
Cellsnp-lite: an efficient tool for genotyping single cells
Huang, X., & Huang, Y. (2021) · Bioinformatics · doi:10.1093/bioinformatics/btab358 · Cited by 214
Van Egeren, D., Escabi, J., Nguyen, M., Liu, S., Reilly, C. R., Patel, S., Kamaz, B., Kalyva, M., DeAngelo, D. J., Galinsky, I., et al. (2021) · Cell Stem Cell · doi:10.1016/j.stem.2021.02.001 · Cited by 206
Self-citationConvergent somatic mutations in metabolism genes in chronic liver disease
Ng, S. W. K., Rouhani, F. J., Brunner, S. F., Brzozowska, N., Aitken, S. J., Yang, M., Abascal, F., Moore, L., Nikitopoulou, E., Chappell, L., et al. (2021) · Nature · doi:10.1038/s41586-021-03974-6 · Cited by 190 · cited 1×
“Motivated by the importance of clonal mosaicism to somatic evolution and disease 2,49 , we next assessed whether the single-cell resolution provided by SComatic permits analysis of the patterns of clonality across cell types.”
Self-citationLandmarks of human embryonic development inscribed in somatic mutations
Bizzotto, S., Dou, Y., Ganz, J., Doan, R. N., Kwon, M., Bohrson, C. L., Kim, S. N., Bae, T., Abyzov, A., NIMH Brain Somatic Mosaicism Network, et al. (2021) · Science · doi:10.1126/science.abe1544 · Cited by 117
Calibrating genomic and allelic coverage bias in single-cell sequencing
Zhang, C.-Z., Adalsteinsson, V. A., Francis, J., Cornils, H., Jung, J., Maire, C., Ligon, K. L., Meyerson, M., & Love, J. C. (2015) · Nature Communications · doi:10.1038/ncomms7822 · Cited by 112
Research works printed but not linked: 51
- Neftel, C. et al. An integrative model of cellular states, plasticity, and genetics for glioblastoma. Cell 178, 835–849.e21 (2019). · DOI · Paper page
- Kakiuchi, N. & Ogawa, S. Clonal expansion in non-cancer tissues. Nat. Rev. Cancer 21, 239–256 (2021). · DOI · Paper page
- Nam, A. S., Chaligne, R. & Landau, D. A. Integrating genetic and non-genetic determinants of cancer evolution by single-cell multi-omics. Nat. Rev. Genet. 22, 3–18 (2021). · DOI
- Lim, B., Lin, Y. & Navin, N. Advancing cancer research and medicine with single-cell genomics. Cancer Cell 37, 456–470 (2020). · DOI
- Gawad, C., Koh, W. & Quake, S. R. Single-cell genome sequencing: current state of the science. Nat. Rev. Genet. 17, 175–188 (2016). · DOI · Paper page
- Xing, D., Tan, L., Chang, C.-H., Li, H. & Xie, X. S. Accurate SNV detection in single cells by transposon-based whole-genome amplification of complementary strands. Proc. Natl Acad. Sci. USA 118, e2013106118 (2021). · DOI
- Abascal, F. et al. Somatic mutation landscapes at single-molecule resolution. Nature 593, 405–410 (2021). · DOI · Paper page
- Li, R. et al. Mapping single-cell transcriptomes in the intra-tumoral and associated territories of kidney cancer. Cancer Cell 40, 1583–1599.e10 (2022). · DOI
- Macaulay, I. C. et al. G&T-seq: parallel sequencing of single-cell genomes and transcriptomes. Nat. Methods 12, 519–522 (2015). · DOI · Paper page
- Reuter, J. A., Spacek, D. V., Pai, R. K. & Snyder, M. P. Simul-seq: combined DNA and RNA sequencing for whole-genome and transcriptome profiling. Nat. Methods 13, 953–958 (2016). · DOI
- Fan, J. et al. Linking transcriptional and genetic tumor heterogeneity through allele analysis of single-cell RNA-seq data. Genome Res. 28, 1217–1227 (2018). · DOI
- Kharchenko, P. V., Silberstein, L. & Scadden, D. T. Bayesian approach to single-cell differential expression analysis. Nat. Methods 11, 740–742 (2014). · DOI · Paper page
- Huang, A. Y. et al. Parallel RNA and DNA analysis after deep sequencing (PRDD-seq) reveals cell type-specific lineage patterns in human brain. Proc. Natl Acad. Sci. USA 117, 13886–13895 (2020). · DOI
- McCarthy, D. J. et al. Cardelino: computational integration of somatic clonal substructure and single-cell transcriptomes. Nat. Methods 17, 414–421 (2020). · DOI
- Liu, F. et al. Systematic comparative analysis of single-nucleotide variant detection methods from single-cell RNA sequencing data. Genome Biol. 20, 242 (2019). · DOI
- Coorens, T. H. H. et al. Extensive phylogenies of human development inferred from somatic mutations. Nature 597, 387–392 (2021). · DOI
- Karczewski, K. J. et al. The mutational constraint spectrum quantified from variation in 141,456 humans. Nature 581, 434–443 (2020). · DOI · Paper page
- Reble, E., Castellani, C. A., Melka, M. G., O’Reilly, R. & Singh, S. M. VarScan2 analysis of de novo variants in monozygotic twins discordant for schizophrenia. Psychiatr. Genet. 27, 62–70 (2017). · DOI
- Li, H. & Durbin, R. Fast and accurate short read alignment with Burrows–Wheeler transform. Bioinformatics 25, 1754–1760 (2009). · DOI · Paper page
- Kim, S. et al. Strelka2: fast and accurate calling of germline and somatic variants. Nat. Methods 15, 591–594 (2018). · DOI
- Zafar, H., Wang, Y., Nakhleh, L., Navin, N. & Chen, K. Monovar: single-nucleotide variant detection in single cells. Nat. Methods 13, 505–507 (2016). · DOI
- Prashant, N. M. et al. SCReadCounts: estimation of cell-level SNVs expression from scRNA-seq data. BMC Genomics 22, 689 (2021). · DOI
- Vázquez-García, I. et al. Ovarian cancer mutational processes drive site-specific immune evasion. Nature 612, 778–786 (2022). · DOI
- Li, R. et al. Mapping single-cell transcriptomes in the intra-tumoral and associated territories of kidney cancer. Cancer Cell 40, 1583–1599.e10 (2022). · DOI
- Gulhan, D. C., Lee, J. J.-K., Melloni, G. E. M., Cortés-Ciriano, I. & Park, P. J. Detecting the mutational signature of homologous recombination deficiency in clinical samples. Nat. Genet. 51, 912–919 (2019). · DOI
- Pelka, K. et al. Spatially organized multicellular immune hubs in human colorectal cancer. Cell 184, 4734–4752.e20 (2021). · DOI
- Lee, H.-O. et al. Lineage-dependent gene expression programs influence the immune landscape of colorectal cancer. Nat. Genet. 52, 594–603 (2020). · DOI
- Cortes-Ciriano, I., Lee, S., Park, W.-Y., Kim, T.-M. & Park, P. J. A molecular portrait of microsatellite instability across multiple cancers. Nat. Commun. 8, 15180 (2017). · DOI
- Haradhvala, N. J. et al. Distinct mutational signatures characterize concurrent loss of polymerase proofreading and mismatch repair. Nat. Commun. 9, 1746 (2018). · DOI
- Alexandrov, L. B. et al. The repertoire of mutational signatures in human cancer. Nature 578, 94–101 (2020). · DOI · Paper page
- Osorio, F. G. et al. Somatic mutations reveal lineage relationships and age-related mutagenesis in human hematopoiesis. Cell Rep. 25, 2308–2316.e4 (2018). · DOI · Paper page
- Choudhury, S. et al. Somatic mutations in single human cardiomyocytes reveal age-associated DNA damage and widespread oxidative genotoxicity. Nat. Aging 2, 714–725 (2022). · DOI
- Eraslan, G. et al. Single-nucleus cross-tissue molecular reference maps toward understanding disease gene function. Science 376, eabl4290 (2022). · DOI
- Zhang, K. et al. A single-cell atlas of chromatin accessibility in the human genome. Cell 184, 5985–6001.e19 (2021). · DOI · Paper page
- Gao, T. et al. Haplotype-aware analysis of somatic copy number variations from single-cell transcriptomes. Nat. Biotechnol. 41, 417–426 (2023). · DOI
- Van Egeren, D. et al. Transcriptional differences between JAK2-V617F and wild-type bone marrow cells in patients with myeloproliferative neoplasms. Exp. Hematol. 107, 14–19 (2022). · DOI
- Rozenblatt-Rosen, O. et al. The Human Tumor Atlas Network: charting tumor transitions across space and time at single-cell resolution. Cell 181, 236–249 (2020). · DOI
- Li, H. Aligning sequence reads, clone sequences and assembly contigs with BWA-MEM. Preprint at arXiv https://doi.org/10.48550/arXiv.1303.3997 (2013). · DOI
- Muyas, F., Zapata, L., Guigó, R. & Ossowski, S. The rate and spectrum of mosaic mutations during embryogenesis revealed by RNA sequencing of 49 tissues. Genome Med. 12, 49 (2020). · DOI
- Bonfield, J. K. et al. HTSlib: C library for reading/writing high-throughput sequencing data. Gigascience 10, giab007 (2021).https://github.com/pysam-developers/pysam · DOI
- Lo Giudice, C., Tangaro, M. A., Pesole, G. & Picardi, E. Investigating RNA editing in deep transcriptome datasets with REDItools and REDIportal. Nat. Protoc. 15, 1098–1131 (2020). · DOI
- Kiran, A. & Baranov, P. V. DARNED: a DAtabase of RNa EDiting in humans. Bioinformatics 26, 1772–1776 (2010). · DOI
- Nakamura, K. et al. Sequence-specific error profile of Illumina sequencers. Nucleic Acids Res. 39, e90 (2011). · DOI
- DePristo, M. A. et al. A framework for variation discovery and genotyping using next-generation DNA sequencing data. Nat. Genet. 43, 491–498 (2011). · DOI
- Fan, Y. et al. MuSE: accounting for tumor heterogeneity using a sample-specific error model improves sensitivity and specificity in mutation calling from sequencing data. Genome Biol. 17, 178 (2016). · DOI
- Dentro, S. C. et al. Characterizing genetic intra-tumor heterogeneity across 2,658 human cancer genomes. Cell 184, 2239–2254.e39 (2021). · DOI · Paper page
- Li, H. et al. The sequence alignment/map format and SAMtools. Bioinformatics 25, 2078–2079 (2009). · DOI · Paper page
- Koboldt, D. C. et al. VarScan 2: somatic mutation and copy number alteration discovery in cancer by exome sequencing. Genome Res. 22, 568–576 (2012). · DOI
- Karczewski, K. J. et al. The ExAC browser: displaying reference data information from over 60 000 exomes. Nucleic Acids Res. 45, D840–D845 (2017). · DOI
- Loh, P.-R. et al. Reference-based phasing using the Haplotype Reference Consortium panel. Nat. Genet. 48, 1443–1448 (2016). · DOI · Paper page
- Wang, K., Li, M. & Hakonarson, H. ANNOVAR: functional annotation of genetic variants from high-throughput sequencing data. Nucleic Acids Res. 38, e164 (2010). · DOI
Cited by
Clonal tracing with somatic epimutations reveals dynamics of blood ageing
Scherer, M., Singh, I., Braun, M. M., Szu-Tu, C., Sanchez Sanchez, P., Lindenhofer, D., Jakobsen, N. A., Körber, V., Kardorff, M., Nitsch, L., et al. (2025) · Nature · doi:10.1038/s41586-025-09041-8 · Cited by 89
Metadata
- Authors
- Muyas, F., Sauer, C. M., Valle-Inclán, J. E., Li, R., Rahbari, R., Mitchell, T. J., Hormoz, S., & Cortés-Ciriano, I.
- Venue
- Nature Biotechnology
- Published
- 2023-07-06
- Volume
- 42
- Issue
- 5
- Pages
- 758-767
- ISSN
- 1087-0156
- 1546-1696
- PMC
- PMC11098751
- Cited by
- 109
- References
- 22
- Language
- en
- Funders
- European Molecular Biology Laboratory
- Wellcome Trust
- Harvard Medical School
About these checks
Registry, retraction, Cites and statistics results are computed, not judged, with one exception: a printed reference that no index lists is read once by a model before it counts as a citation error. Claims are extracted by a model and kept only when their quote appears verbatim in the text; each cited source is then checked, with a model’s help, for whether it says what the claim relies on. Those verdicts can be wrong — read the claim’s quote and the cited source before relying on one.
Statistics and arithmetic are recomputed, not judged.
Confidence bands are shown only for fields calibrated on our annotated test set. None is calibrated yet, so no band is shown.
What counts as a claim ›How we measure confidence ›How we check this ›
Are you an author, or do you see a problem with this page? Request a review
