CoChat

Systema: a framework for evaluating genetic perturbation response prediction beyond systematic variation

Open access
Viñas Torné, Ramon, Wiatrak, Maciej, Piran, Zoe, Fan, Shuyang, Jiang, Liangze, Teichmann, Sarah A., Nitzan, Mor, Brbić, Maria · 2026 · Nature Biotechnology

The DOI matches its Crossref record; 37 of the 37 references it cites were found in a registry or an index.

Abstract

Predicting transcriptional responses to genetic perturbations is challenging in functional genomics. While recent methods aim to infer effects of untested perturbations, their true predictive power remains unclear. Here, we show that current methods struggle to generalize beyond systematic variation, the consistent transcriptional differences between perturbed and control cells arising from selection biases or confounders. We quantify this variation in ten datasets, spanning three technologies and five cell lines, and show that common metrics are susceptible to these biases, leading to overestimated performance. To address this, we introduce Systema, an evaluation framework that emphasizes perturbation-specific effects and identifies predictions that correctly reconstruct the perturbation landscape. Using this framework, we uncover insights into the predictive capabilities of existing methods and show that predicting responses to unseen perturbations is substantially harder than standard metrics suggest. Our work highlights the importance of heterogeneous gene panels and disentangles predictive performance from systematic effects, enabling biologically meaningful developments in perturbation response modeling.

Overview

The claims and statistics of this paper haven’t been checked yet.

Free: it reads the open-access text and checks the first 5 claims that cite a source we can check. Create a free account to check every claim.

A few free checks a day · papers already verified open instantly · results are public

Integrity signals

Registry

Crossref · 10.1038/s41587-025-02777-8

Cites

37 of 37 references verified0 citation errors · 0 not checkable

Statistics

Figures

Fig. 1 Simple baselines perform similar or better than state-of-the-art perturbation response prediction methods. a, Overview of the perturbed mean and matching mean baselines. The perturbed mean is the average of all perturbed cells in the train set, which we denote as P. The matching mean for perturbation X + Y is the average of the X and Y centroids (Methods). When X or Y are unseen at train time, their centroid is replaced by the perturbed mean. Image created in BioRender. b, Summary of datasets included in our benchmark. Outer ring shows total number of perturbations after processing (Methods). Middle ring shows perturbation technology. Inner ring shows cell line. c, Performance comparison of perturbed mean baseline and state-of-the-art methods on unseen one-gene perturbations. We evaluated performance on ten single-cell perturbation datasets from six different sources13–18 using the Pearson correlation coefficient PearsonΔ computed on differential expression profiles (Methods), using all genes (Δ) and the top 20 differentially expressed genes of each perturbation (Δ20). We report the average test performance across three independent runs with different data splits (n represents the number of test perturbations across all three independent runs, Adamson: n = 63, Norman: n = 108, Replogle K562: n = 1,362, Replogle RPE1: n = 1,059, Tian CRISPRa: n = 75, Tian CRISPRi: n = 138, Xu: n = 150, Frangieh control: n = 126, Frangieh co-culture: n = 126, Frangieh interferon: n = 126). Dark and light green colors highlight the best and second-best performing methods, respectively. d, PearsonΔ correlation on unseen two-gene perturbations of the Norman14 dataset, applied to average differential expression profiles over control (predicted versus ground truth). Results across three independent runs with different data splits (0-seen: n = 39, 1-seen: n = 147, 2-seen: n = 39). Boxes depict distribution quartiles, with the center line corresponding to the median, and whiskers span 1.5 × interquartile range. We compared the two methods with highest median scores using two-sided paired t-tests performed separately for each independent run. The resulting P values were aggregated using Fisher’s method. P values, 0-seen, 0.009; 1-seen, 2.6 × 10⁻¹²; 2-seen, 0.0009. NS, not significant, P > 0.05; *P ≤0.05, **P ≤ 0.01, ***P ≤ 0.001, ****P ≤ 0.0001. e, Mean change in expression predicted by different methods for the combinatorial FOSB+OSR2 perturbation. Only the perturbation OSR2 was observed at train time. Boxes indicate experimentally measured differential expression (n = 324 cells). Boxes depict distribution quartiles and whiskers span 1.5 × interquartile range. The dashed line denotes the average control expression. Dot colors represent different baselines (legend in d).
Fig. 1 Simple baselines perform similar or better than state-of-the-art perturbation response prediction methods. a, Overview of the perturbed mean and matching mean baselines. The perturbed mean is the average of all perturbed cells in the train set, which we denote as P. The matching mean for perturbation X + Y is the average of the X and Y centroids (Methods). When X or Y are unseen at train time, their centroid is replaced by the perturbed mean. Image created in BioRender. b, Summary of datasets included in our benchmark. Outer ring shows total number of perturbations after processing (Methods). Middle ring shows perturbation technology. Inner ring shows cell line. c, Performance comparison of perturbed mean baseline and state-of-the-art methods on unseen one-gene perturbations. We evaluated performance on ten single-cell perturbation datasets from six different sources13–18 using the Pearson correlation coefficient PearsonΔ computed on differential expression profiles (Methods), using all genes (Δ) and the top 20 differentially expressed genes of each perturbation (Δ20). We report the average test performance across three independent runs with different data splits (n represents the number of test perturbations across all three independent runs, Adamson: n = 63, Norman: n = 108, Replogle K562: n = 1,362, Replogle RPE1: n = 1,059, Tian CRISPRa: n = 75, Tian CRISPRi: n = 138, Xu: n = 150, Frangieh control: n = 126, Frangieh co-culture: n = 126, Frangieh interferon: n = 126). Dark and light green colors highlight the best and second-best performing methods, respectively. d, PearsonΔ correlation on unseen two-gene perturbations of the Norman14 dataset, applied to average differential expression profiles over control (predicted versus ground truth). Results across three independent runs with different data splits (0-seen: n = 39, 1-seen: n = 147, 2-seen: n = 39). Boxes depict distribution quartiles, with the center line corresponding to the median, and whiskers span 1.5 × interquartile range. We compared the two methods with highest median scores using two-sided paired t-tests performed separately for each independent run. The resulting P values were aggregated using Fisher’s method. P values, 0-seen, 0.009; 1-seen, 2.6 × 10⁻¹²; 2-seen, 0.0009. NS, not significant, P > 0.05; *P ≤0.05, **P ≤ 0.01, ***P ≤ 0.001, ****P ≤ 0.0001. e, Mean change in expression predicted by different methods for the combinatorial FOSB+OSR2 perturbation. Only the perturbation OSR2 was observed at train time. Boxes indicate experimentally measured differential expression (n = 324 cells). Boxes depict distribution quartiles and whiskers span 1.5 × interquartile range. The dashed line denotes the average control expression. Dot colors represent different baselines (legend in d).CC BY · PubMed Central
Fig. 2 Systematic variation in the Norman14 and Replogle15 perturbation datasets. a, Uniform Manifold Approximation and Projection (UMAP) plot of normalized gene expression values in the Norman14 dataset colored by control versus perturbed cells and AUCell scores of positive regulation of response to external stimulus and response to positive regulation of cell death. Control cells correspond to cells with nontargeting guides. b, Normalized enrichment scores and false discovery rate for top enriched pathways in the Norman14 dataset. We applied Gene Set Enrichment Analyses using Biological Process 2023 gene sets from the Gene Ontology (GO)28,29 to compare the population of perturbed cells with the population of control cells. c, UMAP plot of normalized gene expression values in the Replogle15 (RPE1) dataset colored by control versus perturbed cells, cell-cycle phase and CIN z-score of each perturbation. The perturbation CIN score was calculated as the mean single-cell sum of squared CIN values, z-normalized relative to control perturbations15. Control cells correspond to cells with nontargeting guides. d, Cell-cycle diagram. Perturbations that induce chromosomal instability are more likely to trigger cell-cycle arrest. Image created in BioRender. e, Phase density of control and perturbed cells in the Replogle15 (RPE1) dataset. The density of cells in G1 is significantly higher for perturbed cells with a P value of 2.3 × 10−43. JS, Jensen–Shannon divergence. f, Volcano plot depicting the log-fold changes (perturbed versus control cells) in the Replogle15 (RPE1) dataset for gene sets involved in DNA damage response and regulation of cell-cycle process. We used a two-sided independent two-sample t-test without adjustments.
Fig. 2 Systematic variation in the Norman14 and Replogle15 perturbation datasets. a, Uniform Manifold Approximation and Projection (UMAP) plot of normalized gene expression values in the Norman14 dataset colored by control versus perturbed cells and AUCell scores of positive regulation of response to external stimulus and response to positive regulation of cell death. Control cells correspond to cells with nontargeting guides. b, Normalized enrichment scores and false discovery rate for top enriched pathways in the Norman14 dataset. We applied Gene Set Enrichment Analyses using Biological Process 2023 gene sets from the Gene Ontology (GO)28,29 to compare the population of perturbed cells with the population of control cells. c, UMAP plot of normalized gene expression values in the Replogle15 (RPE1) dataset colored by control versus perturbed cells, cell-cycle phase and CIN z-score of each perturbation. The perturbation CIN score was calculated as the mean single-cell sum of squared CIN values, z-normalized relative to control perturbations15. Control cells correspond to cells with nontargeting guides. d, Cell-cycle diagram. Perturbations that induce chromosomal instability are more likely to trigger cell-cycle arrest. Image created in BioRender. e, Phase density of control and perturbed cells in the Replogle15 (RPE1) dataset. The density of cells in G1 is significantly higher for perturbed cells with a P value of 2.3 × 10−43. JS, Jensen–Shannon divergence. f, Volcano plot depicting the log-fold changes (perturbed versus control cells) in the Replogle15 (RPE1) dataset for gene sets involved in DNA damage response and regulation of cell-cycle process. We used a two-sided independent two-sample t-test without adjustments.CC BY · PubMed Central
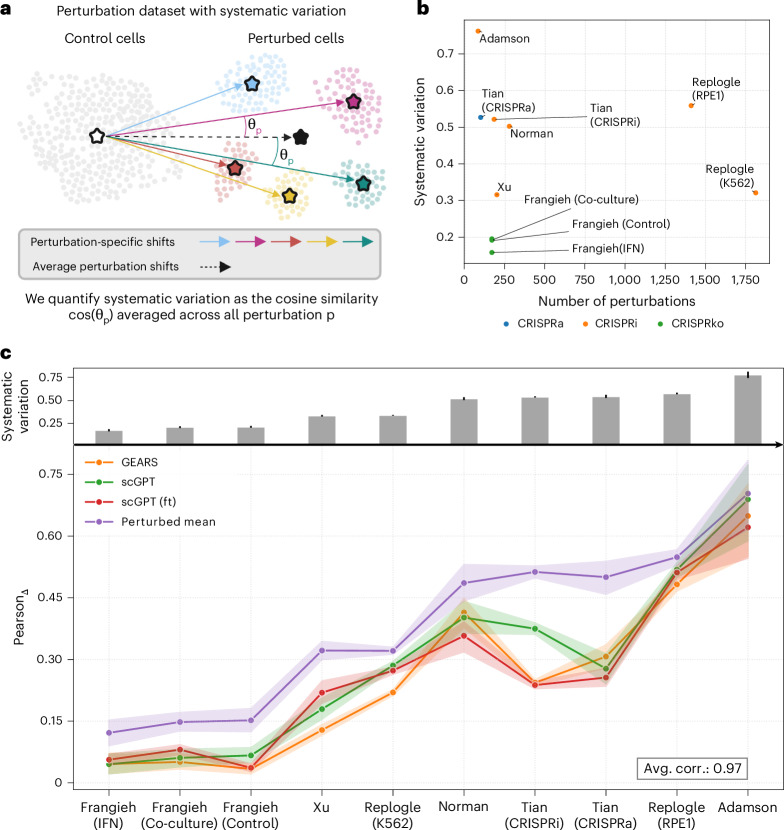
Fig. 3 Quantifying systematic variation in single-cell perturbation datasets. a, Schematic representation of a single-cell perturbation dataset with systematic variation. We measure systematic variation as the cosine similarity between each perturbation-specific shift (vector pointing to the centroid of identically perturbed cells using the control centroid as reference) and the average perturbation effect (vector pointing to the centroid of all perturbed cells). Image created in BioRender. b, Degree of systematic variation in the datasets by total number of perturbations. For each dataset, we report the average cosine similarity between perturbation-specific shifts and the average perturbation effect. Datasets are colored by perturbation technology. c, Relationship between the performance of perturbation response prediction methods and systematic variation. The performance was measured using PearsonΔ correlation on differential expression profiles on the one-gene test perturbations across ten datasets. Datasets are sorted by our measure of systematic variation. Error bars depict the 95% confidence interval of the scores across three independent runs with different data splits. The gray bars in the bar plot depict the degree of systematic variation in each dataset and error bars show the 95% confidence interval (Adamson: n = 81, Norman: n = 276, Replogle K562: n = 1,813, Replogle RPE1: n = 1,410, Tian CRISPRa: n = 97, Tian CRISPRi: n = 181, Xu: n = 198, Frangieh control: n = 167, Frangieh co-culture: n = 167, Frangieh interferon: n = 167; n is the total number of perturbations per dataset).
Fig. 3 Quantifying systematic variation in single-cell perturbation datasets. a, Schematic representation of a single-cell perturbation dataset with systematic variation. We measure systematic variation as the cosine similarity between each perturbation-specific shift (vector pointing to the centroid of identically perturbed cells using the control centroid as reference) and the average perturbation effect (vector pointing to the centroid of all perturbed cells). Image created in BioRender. b, Degree of systematic variation in the datasets by total number of perturbations. For each dataset, we report the average cosine similarity between perturbation-specific shifts and the average perturbation effect. Datasets are colored by perturbation technology. c, Relationship between the performance of perturbation response prediction methods and systematic variation. The performance was measured using PearsonΔ correlation on differential expression profiles on the one-gene test perturbations across ten datasets. Datasets are sorted by our measure of systematic variation. Error bars depict the 95% confidence interval of the scores across three independent runs with different data splits. The gray bars in the bar plot depict the degree of systematic variation in each dataset and error bars show the 95% confidence interval (Adamson: n = 81, Norman: n = 276, Replogle K562: n = 1,813, Replogle RPE1: n = 1,410, Tian CRISPRa: n = 97, Tian CRISPRi: n = 181, Xu: n = 198, Frangieh control: n = 167, Frangieh co-culture: n = 167, Frangieh interferon: n = 167; n is the total number of perturbations per dataset).CC BY · PubMed Central
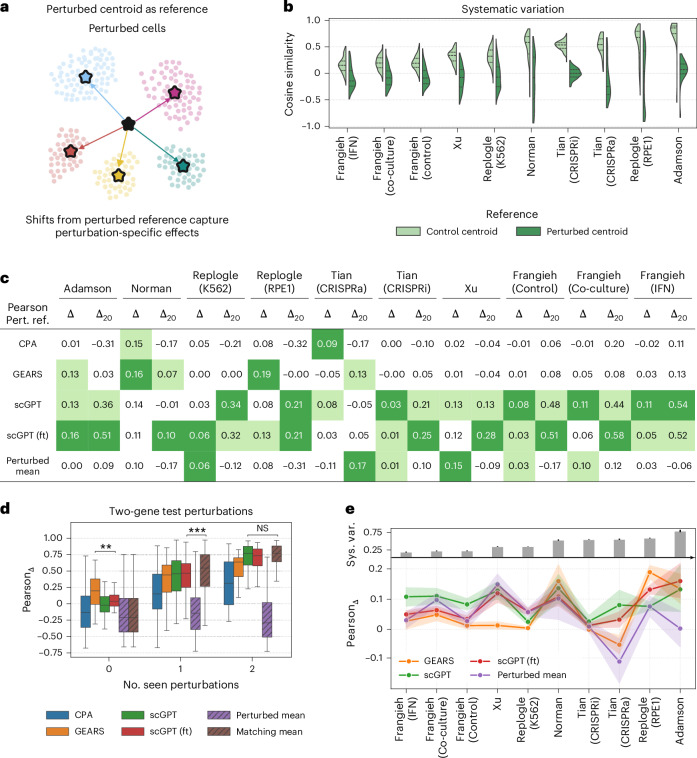
Fig. 4 Systema emphasizes perturbation-specific effects and increases robustness to systematic variation. a, In the Systema framework, perturbation-specific effects are captured by changing the reference from the centroid of control cells to that of perturbed cells, thereby focusing on perturbation effects rather than systematic variation. Image created in BioRender. b, Distribution of cosine similarities between perturbation-specific shifts and the average perturbation-specific shift on ten single-cell perturbation datasets. Perturbation-specific shifts are computed using the control (light green) and perturbed (dark green) references. Dashed lines indicate distribution quartiles. c,d, Benchmarking perturbation response prediction using differential expression profiles with respect to the perturbed reference (Methods). Performance comparison of perturbed mean baseline and state-of-the-art methods on unseen one-gene perturbations (c). We report the average test performance across three independent runs with different data splits (n indicates number of test perturbations across all three independent runs, Adamson: n = 63, Norman: n = 108, Replogle K562: n = 1,362, Replogle RPE1: n = 1,059, Tian CRISPRa: n = 75, Tian CRISPRi: n = 138, Xu: n = 150, Frangieh control: n = 126, Frangieh co-culture: n = 126, Frangieh interferon: n = 126). Pearson correlation on unseen two-gene perturbations of the Norman14 dataset, applied to average differential expression profiles with respect to the perturbed reference (predicted versus ground truth) (d). Boxes depict distribution quartiles, with the center line corresponding to the median, and whiskers span 1.5 × interquartile range. Results across three independent runs with different train-test splits (0-seen: n = 39, 1-seen: n = 147, 2-seen: n = 39). We compared the two methods with highest median scores using two-sided paired t-tests performed separately for each independent run. The resulting P values were aggregated using Fisher’s method. 0-seen, P = 0.002; 1-seen, P = 0.0003; 2-seen, P = 0.6. Significance is denoted as NS, not significant (P > 0.05), *P ≤ 0.05, **P ≤ 0.01, ***P ≤ 0.001, ****P ≤ 0.0001. e, Relationship between the performance of perturbation response prediction methods and systematic variation. The performance was measured using PearsonΔ correlation on differential expression profiles on the one-gene test perturbations across ten datasets, using the perturbed centroid as reference. Datasets are sorted by our measure of systematic variation. Error bars depict the 95% confidence interval of the scores across three independent runs with different data splits. The gray bars in the bar plot depict the degree of systematic variation in each dataset and error bars show the 95% confidence interval (Adamson: n = 81, Norman: n = 276, Replogle K562: n = 1,813, Replogle RPE1: n = 1,410, Tian CRISPRa: n = 97, Tian CRISPRi: n = 181, Xu: n = 198, Frangieh control: n = 167, Frangieh co-culture: n = 167, Frangieh interferon: n = 167; n is the total number of perturbations per dataset).
Fig. 4 Systema emphasizes perturbation-specific effects and increases robustness to systematic variation. a, In the Systema framework, perturbation-specific effects are captured by changing the reference from the centroid of control cells to that of perturbed cells, thereby focusing on perturbation effects rather than systematic variation. Image created in BioRender. b, Distribution of cosine similarities between perturbation-specific shifts and the average perturbation-specific shift on ten single-cell perturbation datasets. Perturbation-specific shifts are computed using the control (light green) and perturbed (dark green) references. Dashed lines indicate distribution quartiles. c,d, Benchmarking perturbation response prediction using differential expression profiles with respect to the perturbed reference (Methods). Performance comparison of perturbed mean baseline and state-of-the-art methods on unseen one-gene perturbations (c). We report the average test performance across three independent runs with different data splits (n indicates number of test perturbations across all three independent runs, Adamson: n = 63, Norman: n = 108, Replogle K562: n = 1,362, Replogle RPE1: n = 1,059, Tian CRISPRa: n = 75, Tian CRISPRi: n = 138, Xu: n = 150, Frangieh control: n = 126, Frangieh co-culture: n = 126, Frangieh interferon: n = 126). Pearson correlation on unseen two-gene perturbations of the Norman14 dataset, applied to average differential expression profiles with respect to the perturbed reference (predicted versus ground truth) (d). Boxes depict distribution quartiles, with the center line corresponding to the median, and whiskers span 1.5 × interquartile range. Results across three independent runs with different train-test splits (0-seen: n = 39, 1-seen: n = 147, 2-seen: n = 39). We compared the two methods with highest median scores using two-sided paired t-tests performed separately for each independent run. The resulting P values were aggregated using Fisher’s method. 0-seen, P = 0.002; 1-seen, P = 0.0003; 2-seen, P = 0.6. Significance is denoted as NS, not significant (P > 0.05), *P ≤ 0.05, **P ≤ 0.01, ***P ≤ 0.001, ****P ≤ 0.0001. e, Relationship between the performance of perturbation response prediction methods and systematic variation. The performance was measured using PearsonΔ correlation on differential expression profiles on the one-gene test perturbations across ten datasets, using the perturbed centroid as reference. Datasets are sorted by our measure of systematic variation. Error bars depict the 95% confidence interval of the scores across three independent runs with different data splits. The gray bars in the bar plot depict the degree of systematic variation in each dataset and error bars show the 95% confidence interval (Adamson: n = 81, Norman: n = 276, Replogle K562: n = 1,813, Replogle RPE1: n = 1,410, Tian CRISPRa: n = 97, Tian CRISPRi: n = 181, Xu: n = 198, Frangieh control: n = 167, Frangieh co-culture: n = 167, Frangieh interferon: n = 167; n is the total number of perturbations per dataset).CC BY · PubMed Central
Fig. 5 Systema queries predicted post-perturbation profiles to infer downstream, coarse-grained perturbation effects. a, Systema incorporates a novel metric, centroid accuracy, to evaluate whether the predicted post-perturbation profiles are closer to their ground-truth centroids than to the centroids of other perturbations. Image created in BioRender. b, Contrasting the centroid accuracies of the perturbed mean baseline (x axis) and a specific baseline (y axis). Each dot represents a perturbation. Perturbations in the diagonal are uninformative (they can be equally well predicted by the perturbation model and the perturbed mean), which captures systematic variation exclusively. Image created in BioRender. c, Comparing the centroid accuracy on unseen one-gene perturbations. We report the average test performance across three independent runs with different data splits (n indicates number of unique test perturbations across all three independent runs, Adamson: n = 49, Norman: n = 85, Replogle K562: n = 1,043, Replogle RPE1: n = 806, Tian CRISPRa: n 61, Tian CRISPRi: n = 107, Xu: n = 116, Frangieh control: n = 99, Frangieh co-culture: n = 99, Frangieh interferon: n = 99). Error bars depict the 95% confidence interval of the scores across three independent runs with different data splits. d, Contrasting the centroid accuracies of the perturbed mean baseline (x axis) and fine-tuned scGPT (y axis) on the Replogle15 (K562) dataset. Perturbations related to translation (for example, perturbations that target genes coding for ribosomal proteins) can be better inferred by scGPT. e, ROC curve for CIN prediction on the Replogle15 (K562) dataset. We split perturbations into low CIN (z-score < 0) and high CIN (z-score > 2) and computed centroids for the two classes. For each perturbation, we then calculated distances from the inferred centroid to the class-specific centroids and ranked perturbations based on the difference between the two distances (Methods). Only the fine-tuned version of scGPT could partially recapitulate CIN effects for held-out perturbations.
Fig. 5 Systema queries predicted post-perturbation profiles to infer downstream, coarse-grained perturbation effects. a, Systema incorporates a novel metric, centroid accuracy, to evaluate whether the predicted post-perturbation profiles are closer to their ground-truth centroids than to the centroids of other perturbations. Image created in BioRender. b, Contrasting the centroid accuracies of the perturbed mean baseline (x axis) and a specific baseline (y axis). Each dot represents a perturbation. Perturbations in the diagonal are uninformative (they can be equally well predicted by the perturbation model and the perturbed mean), which captures systematic variation exclusively. Image created in BioRender. c, Comparing the centroid accuracy on unseen one-gene perturbations. We report the average test performance across three independent runs with different data splits (n indicates number of unique test perturbations across all three independent runs, Adamson: n = 49, Norman: n = 85, Replogle K562: n = 1,043, Replogle RPE1: n = 806, Tian CRISPRa: n 61, Tian CRISPRi: n = 107, Xu: n = 116, Frangieh control: n = 99, Frangieh co-culture: n = 99, Frangieh interferon: n = 99). Error bars depict the 95% confidence interval of the scores across three independent runs with different data splits. d, Contrasting the centroid accuracies of the perturbed mean baseline (x axis) and fine-tuned scGPT (y axis) on the Replogle15 (K562) dataset. Perturbations related to translation (for example, perturbations that target genes coding for ribosomal proteins) can be better inferred by scGPT. e, ROC curve for CIN prediction on the Replogle15 (K562) dataset. We split perturbations into low CIN (z-score < 0) and high CIN (z-score > 2) and computed centroids for the two classes. For each perturbation, we then calculated distances from the inferred centroid to the class-specific centroids and ranked perturbations based on the difference between the two distances (Methods). Only the fine-tuned version of scGPT could partially recapitulate CIN effects for held-out perturbations.CC BY · PubMed Central

Verification

Claims the paper makes

The claims and statistics of this paper haven’t been checked yet.

Free: it reads the open-access text and checks the first 5 claims that cite a source we can check. Create a free account to check every claim.

A few free checks a day · papers already verified open instantly · results are public

Claims other papers make about this one

Each is checked against this paper’s own text: does it say what the citing paper says it does?

Self-check

Percentages, sums and reported differences re-computed from the paper’s own numbers.

The self-check needs the paper’s full text.

Citations

Cites

Show all 37 references

Research works printed but not linked: 2

  1. Hetzel, L. et al. Predicting cellular responses to novel drug perturbations at a single-cell resolution. Adv. Neural Info. Process. Syst. 35, 26711–26722 (2022).
  2. Lopez, R., Hütter, J. C., Pritchard, J. & Regev, A. Large-scale differentiable causal discovery of factor graphs. Adv. Neural Info. Process. Syst. 35, 19290–303 (2022).

Cited by

See all 58

Metadata

Authors
Viñas Torné, R., Wiatrak, M., Piran, Z., Fan, S., Jiang, L., Teichmann, S. A., Nitzan, M., & Brbić, M.
Affiliations
  • Wellcome/MRC Cambridge Stem Cell Institute (GB)
  • Hebrew University of Jerusalem (IL)
  • École Polytechnique Fédérale de Lausanne (CH)
  • Canadian Institute for Advanced Research (CA)
  • SIB Swiss Institute of Bioinformatics (CH)
Corresponding author
  • Nitzan, Mor
  • Brbić, Maria
Venue
Nature Biotechnology
Published
2025-08-25
Volume
44
Issue
6
Pages
1050-1059
ISSN
  • 0733-222X (ISSN-L)
  • 1087-0156
  • 1546-1696
OpenAlex
W4413495491
Cited by
58
References
37
Citations by year
2026: 49 · 2025: 9
FWCI
17.19
Type
journal article
Language
en
Open access
Licence
Locations
  • Nature Biotechnology (publishedVersion, cc-by)
  • PubMed (publishedVersion)
  • PubMed Central (publishedVersion, cc-by)
  • Apollo (University of Cambridge) (submittedVersion, cc-by)
  • Infoscience (Ecole Polytechnique Fédérale de Lausanne) (submittedVersion)
Funders
  • Schweizerischer Nationalfonds zur Förderung der Wissenschaftlichen Forschung (TMSGI2_226252, IC00I0-231922)
  • Peter und Traudl Engelhorn Foundation
  • European Union
Topics
  • Life Sciences › Biochemistry, Genetics and Molecular Biology › Molecular Biology › Gene Regulatory Network Analysis
  • Life Sciences › Biochemistry, Genetics and Molecular Biology › Molecular Biology › Bioinformatics and Genomic Networks
  • Life Sciences › Biochemistry, Genetics and Molecular Biology › Molecular Biology › Genomics and Chromatin Dynamics
Keywords
transcriptional response, systematic variation, selection bias, confounding, evaluation framework, performance indicators, CRISPR/Cas9, cell lines
MeSH terms
Humans, Gene Expression Profiling, Genomics

About these checks

Registry, retraction, Cites and statistics results are computed, not judged, with one exception: a printed reference that no index lists is read once by a model before it counts as a citation error. Claims are extracted by a model and kept only when their quote appears verbatim in the text; each cited source is then checked, with a model’s help, for whether it says what the claim relies on. Those verdicts can be wrong — read the claim’s quote and the cited source before relying on one.

Statistics and arithmetic are recomputed, not judged.

Confidence bands are shown only for fields calibrated on our annotated test set. None is calibrated yet, so no band is shown.

What counts as a claim ›How we measure confidence ›How we check this ›

Are you an author, or do you see a problem with this page? Request a review

How to cite

Cite CoChat for the checks on this page, and the paper for its own findings.

This page
CoChat. (2026). Citation check: Systema: a framework for evaluating genetic perturbation response prediction beyond systematic variation. https://app.cochat.ai/papers/10.1038/s41587-025-02777-8
The paper
Viñas Torné, R., Wiatrak, M., Piran, Z., Fan, S., Jiang, L., Teichmann, S. A., Nitzan, M., & Brbić, M. (2026). Systema: a framework for evaluating genetic perturbation response prediction beyond systematic variation. Nature Biotechnology. https://doi.org/10.1038/s41587-025-02777-8

Data sources

Bibliographic data: Semantic Scholar, OpenAlex, Crossref.

Contains information from the Semantic Scholar Academic Graph Datasets, made available under the ODC Attribution License (ODC-BY 1.0).

Semantic Scholar’s data is described in: Kinney, R., et al. (2023). The Semantic Scholar Open Data Platform. arXiv:2301.10140.